


 |
市场调查报告书
商品编码
1683507
胶原蛋白:市场占有率分析、产业趋势与统计、成长预测(2025-2030 年)Collagen - Market Share Analysis, Industry Trends & Statistics, Growth Forecasts (2025 - 2030) |
||||||
价格
※ 本网页内容可能与最新版本有所差异。详细情况请与我们联繫。
简介目录
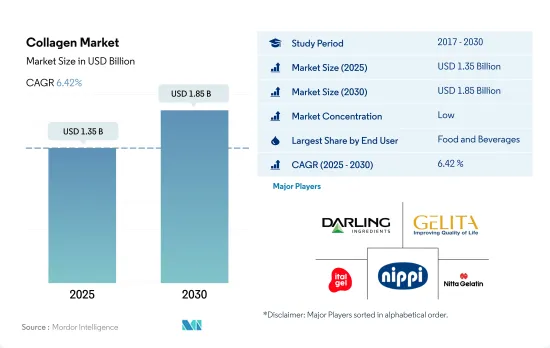
胶原蛋白市场规模预计在 2025 年为 13.5 亿美元,预计到 2030 年将达到 18.5 亿美元,预测期内(2025-2030 年)的复合年增长率为 6.42%。
由于消费者对基于胶原蛋白的美容产品(即具有皮肤益处的产品)的偏好日益增长,预计预测期内个人护理和化妆品领域的销售额将增加。
- 根据最终用户,饮料、烘焙和零嘴零食子区隔占据了大部分应用,其中食品和饮料仍然是最大的细分市场。预计该领域也将引领市场,预测期内销售复合年增长率为 5.99%。这种需求是由其多功能性和营养价值所驱动。
- 然而,胶原蛋白在个人护理和化妆品领域的应用预计将优于其他领域,在预测期内,其产量复合年增长率最快,为 7.02%。在该领域,人们使用水解形式的胶原胶原蛋白,因为它们对皮肤的刺激、致敏性和光毒性最小。随着健康意识的增强,蛋白质强化已成为全球消费者关注的焦点。例如,到2021年,全球75%的消费者将为强化蛋白质的食品和饮料支付更高的价格,其中超过一半的消费者愿意支付10%的溢价,15%的消费者愿意支付25%的溢价。
- 饮料子区隔是胶原蛋白市场中最大的终端用户细分市场,占 2023 年总消费量的 44.2% 以上。胶原蛋白饮料市场正处于发展初期。随着消费者越来越意识到饮料的健康益处,预计整体胶原蛋白饮料市场将会扩大。胶原蛋白饮料含有大量的羟脯氨酸和氨基酸甘氨酸、精氨酸和脯氨酸,这些与能量供应、细胞再生和新陈代谢有关。胶原蛋白可用于多种热饮,为具有健康益处的创新产品铺平了道路。因此,富含胶原蛋白的热饮(如咖啡和热巧克力)的消费量正在快速增长。
由于胶原蛋白蛋白产品越来越受欢迎,且各类製造单位实力雄厚,亚太地区将在 2022 年占据大部分份额。
- 亚太地区的胶原蛋白市场最大,主要得益于中国和印度的原料产量不断增加。在中国,胶原蛋白不仅有助于美容,还有助于增强免疫力、关节健康和运动表现,因此被用于补充剂。该地区胶原蛋白的销售受到人口老化和企业逐渐在其产品线中添加基于胶原蛋白的成分的推动。在东南亚,60岁及以上人口比例预计将从2017年的9.8%上升到2030年的13.7%。
- 欧洲是该市场的第二大区域,预计在预测期内以 6.48% 的最快以金额为准成长。这是由于区域参与者的增加,他们采用独特的策略来满足不断增长的需求,例如针对个人护理和化妆品等高潜力终端用户群体不断进行产品创新。在德国,以胶原蛋白为基础的胶原蛋白饮料和以胶原蛋白胜肽为基础的饮料(如Sanotact和BeautyHacker的美容胶原蛋白饮料)的日益普及促进了这一增长。
- 中东和非洲是另一个潜力市场。由于许多消费者遵循伊斯兰教义,该地区的市场参与者看到了供应胶原蛋白和海洋胶原胶原蛋白的机会。随着信仰政策的推出和实施,需求预计会增加,主要是为了为胶原蛋白蛋白产品的使用提供灵活性。预测期内,中东和非洲的海洋胶原蛋白市场预计将分别以 7.47% 和 8.21% 的复合年增长率成长。
全球胶原蛋白市场趋势
健康零食偏好和线上平台的成长将推动市场成长
- 全球消费者的健康意识日益增强,越来越喜欢吃零食的生活方式。这种转变明显表现为人们更倾向于选择比传统零嘴零食更有营养的替代品。例如,2021 年 6 月在英国,25% 的 Z 世代(16-24 岁)更喜欢标有「低卡路里」的零食,而 18% 的千禧世代(25-34 岁)想要蛋白质含量更高的零食。此外,36% 的 55 岁以上的人正在积极寻找「低碳水化合物」或「零碳水化合物」零食。因此,产业领导者纷纷推出各种低脂、低热量的产品。
- 此外,消费者越来越多地透过社群媒体来了解食品趋势和灵感,Instagram 和 YouTube 等平台已成为发现新零食的重要工具。 2022 年,超过 70% 的全球消费者,尤其是 Z 世代和千禧世代,在发现新零食时会向社群媒体寻求灵感。线上平台的兴起进一步简化了这个流程,让消费者可以在舒适的家中探索和购买各种零食。
- 优质化也推动了零嘴零食产业的创新,强调零嘴零食的新鲜、健康和功能性。浓郁的辛辣口味和异国风的配料越来越受欢迎,满足了全球多样化的口味,并有助于推动区域市场的成长。零食不再只是一种营养来源;它已经深深植根于现代文化之中。在家工作或娱乐时吃零食正变得越来越普遍。例如,Godrej Yummiez 在 2022 年 11 月发布的一份报告强调,45% 的印度消费者更喜欢在聚会和节庆期间吃零食。这些文化转变凸显了零食如何从个人选择演变为社会期望。
肉类主要用作生产胶原蛋白的原料
- 肉类是世界各地人们重要的营养来源。过去50年来,全球对肉类的需求不断扩大,肉类产量增加了两倍。目前,全球每年肉类产量超过3.5亿吨。从区域来看,亚太地区是最大的肉类生产地区,占全球肉类产量的很大一部分。这标誌着与过去几十年相比的重大转变。近年来,欧洲的肉类产量也增加了一倍。预计中国将占肉类产量成长的大部分,其次是美国、巴西和印度。
- 美国是牛肉和水牛肉的最大生产国,其次是巴西和中国。阿根廷、澳洲和印度的贡献也值得关注。在鸡肉领域,美国引领市场,中国和巴西也扮演重要角色。整体来看,欧洲的鸡肉产量与美国相当。然而,在人均肉品消费量已经很高的高所得国家,需求预计会停滞甚至下降。这些变化是由人口老化和优先考虑更多种类蛋白质的饮食偏好的改变所驱动。
- 牛和畜群数量的扩大,尤其是在中国,正在支撑全球肉类产量的上升趋势。这一趋势,加上畜牧业生产和技术的进步(特别是在中低收入国家),将提高生产力。鸡肉尤其推动了全球肉类产量的激增。
胶原蛋白产业概况
胶原蛋白市场较为分散,前五大公司的市占率为11.59%。市场的主要企业有:Darling Ingredients Inc.、GELITA AG、Italgelatine SpA、Nippi。 Inc. 和 Nitta Gelatin Inc.(按字母顺序排列)。
其他福利
- Excel 格式的市场预测 (ME) 表
- 3 个月的分析师支持
目录
第 1 章执行摘要和主要发现
第 2 章 简介
- 研究假设和市场定义
- 研究范围
- 调查方法
第三章 产业主要趋势
- 最终用户市场规模
- 婴儿食品和婴儿奶粉
- 麵包店
- 饮料
- 早餐用麦片谷类
- 调味品/酱料
- 糖果零食
- 乳製品和乳製品替代品
- 老年营养与医学营养
- 肉类、家禽、鱼贝类和肉类替代品
- RTE/RTC 食品
- 小吃
- 运动/运动营养
- 动物饲料
- 个人护理和化妆品
- 蛋白质消费趋势
- 动物
- 生产趋势
- 动物
- 法律规范
- 中国
- 法国
- 德国
- 印度
- 义大利
- 日本
- 英国
- 美国
- 价值链与通路分析
第 4 章 市场细分
- 形式
- 动物性
- 海洋类
- 最终用户
- 动物饲料
- 饮食
- 按次级最终用户
- 麵包店
- 饮料
- 早餐用麦片谷类
- 小吃
- 个人护理和化妆品
- 补充
- 按次级最终用户
- 老年营养与医学营养
- 运动/运动营养
- 按地区
- 非洲
- 按类型
- 按最终用户
- 按国家
- 奈及利亚
- 南非
- 非洲其他地区
- 亚太地区
- 按类型
- 按最终用户
- 按国家
- 澳洲
- 中国
- 印度
- 印尼
- 日本
- 马来西亚
- 纽西兰
- 韩国
- 泰国
- 越南
- 其他亚太地区
- 欧洲
- 按类型
- 按最终用户
- 按国家
- 比利时
- 法国
- 德国
- 义大利
- 荷兰
- 俄罗斯
- 西班牙
- 土耳其
- 英国
- 其他欧洲国家
- 中东
- 按类型
- 按最终用户
- 按国家
- 伊朗
- 沙乌地阿拉伯
- 阿拉伯聯合大公国
- 其他中东地区
- 北美洲
- 按类型
- 按最终用户
- 按国家
- 加拿大
- 墨西哥
- 美国
- 北美其他地区
- 南美洲
- 按类型
- 按最终用户
- 按国家
- 阿根廷
- 巴西
- 其他南美洲地区
- 非洲
第五章 竞争格局
- 主要策略趋势
- 市场占有率分析
- 业务状况
- 公司简介(包括全球概况、市场层级概况、主要业务部门、财务状况、员工人数、关键资讯、市场排名、市场占有率、产品和服务以及最新发展分析)
- ASAHI GELATINE INDUSTRIAL Co.,Ltd.
- Darling Ingredients Inc.
- Ewald-Gelatine GmbH
- Foodchem International Corporation
- GELITA AG
- Italgelatine SpA
- Jellice Pioneer Private Limited
- Nippi. Inc.
- Nitta Gelatin Inc.
第六章 执行长的关键策略问题
第七章 附录
- 世界概况
- 概述
- 五力分析框架
- 全球价值链分析
- 市场动态(DRO)
- 资讯来源和进一步阅读
- 图片列表
- 关键见解
- 资料包
- 词彙表
简介目录
Product Code: 90227
The Collagen Market size is estimated at 1.35 billion USD in 2025, and is expected to reach 1.85 billion USD by 2030, growing at a CAGR of 6.42% during the forecast period (2025-2030).
Personal care and cosmetic segment is expected to gain higher sales in forecast period due to growing consumer preferences for collagen-based beauty products i.e. beneficial for skin
- By end user, F&B remained the largest segment, with the majority of applications in the beverage, bakery, and snacks sub-segments. The segment is also anticipated to drive the market with a CAGR of 5.99%, by volume, in the forecast period. This demand can be attributed to its multi-functionality and nutritional benefits.
- However, in the forecast period, collagen application in the personal care and cosmetics segment is projected to outpace other segments with the fastest CAGR of 7.02% by volume. The segment uses collagen in the hydrolyzed form, owing to its negligible skin irritation, sensitization, or indication of phototoxicity. Protein fortification has become a major interest among global consumers, with a rise in their health concerns. For example, in 2021, 75% of global consumers paid a higher price for protein-fortified food and beverages, while more than half paid a 10% premium, and 15% of consumers would be willing to pay a 25% premium.
- The beverages sub-segment is the largest end-user segment in the collagen market and represents over 44.2% of the total consumption volume in 2023. The collagen drinks market is in its early stages of development. As consumers become increasingly aware of the health benefits of the beverages they consume, it is expected to increase the overall market for collagen drinks. Collagen-based drinks are high in hydroxyproline, amino acids glycine, arginine, and proline, which are associated with energy supply, cell regeneration, and metabolism. Collagen can be used in many hot beverages, which paves the way for innovative products with health benefits. Hence, the consumption of collagen-enhanced hot beverages such as coffee and hot chocolate is increasing at a high pace.
Asia-pacific accounted majority of share in 2022 due to growing popularity of collagen based products coupled with strong presence of various manufacturing units
- The Asia-Pacific collagen market is the largest, owing to the higher production of raw materials in the region, mainly in China and India. In China, collagen application in supplements is not only used for skin beauty but also beneficial for immune, joint health, and sports performance. Collagen sales in the region are being driven by the aging population and companies that are progressively adding collagen-based ingredients to their product lines. In Southeast Asia, the proportion of individuals aged 60 years and older was 9.8% in 2017, which is projected to rise to 13.7% by 2030.
- Europe is the second-largest regional segment for the market and is also projected to record the fastest CAGR of 6.48%, by value, during the forecast period, attributed to a rise in regional players catering to the surging demand by adopting distinct strategies like constant product innovation for highly potential end-user segments, like personal care and cosmetics. The growing popularity of collagen-based beauty drinks and collagen peptide-based beverages like Sanotact and BeautyHacker beauty collagen drinks in Germany contributes to this growth.
- Middle East & Africa is another promising market, as most consumers follow Islamic principles, thus creating opportunities for market players in the region to supply collagen sourced from halal sources or marine-based collagen/ With the introduction and implementation of religion-based policies, the demand is anticipated to increase, primarily to render flexibility for using collagen-based products. The marine-sourced collagen market in the Middle East and African regions is projected to record a CAGR of 7.47% and 8.21%, respectively, during the forecast period.
Global Collagen Market Trends
Healthy snacking preferences with growth in online platforms are supporting market growth
- Consumers worldwide increasingly embrace a snacking lifestyle with a heightened focus on health. This shift is evident in their preference for nutritious alternatives over traditional snacks. For instance, in June 2021, 25% of Gen Zs (16 to 24 years old) in the United Kingdom favored snacks labeled "low in calories," while 18% of millennials (25 to 34 years old) sought out high-protein options. Additionally, 36% of those over 55 actively sought snacks with "low" or "no sugar" content. Consequently, leading industry players have responded by introducing a variety of low-fat and low-calorie offerings.
- Furthermore, with users increasingly relying on social media for food trends and inspiration, platforms like Instagram and YouTube have emerged as crucial tools for discovering new snacks. Over 70% of global consumers, particularly Gen Zs and millennials, attributed their discovery of new snacks in 2022 to social media. The rise of online platforms has further streamlined the process, allowing consumers to explore and purchase a diverse range of snacks from the comfort of their homes.
- Also, premiumization is driving innovation innovation in the snacks segment, emphasizing fresh, better-for-you, and functional snacks. Bold, spicy flavors and exotic ingredients are gaining traction, appealing to a diverse global palate and fueling growth in regional markets. Snacking has transcended mere sustenance, becoming deeply ingrained in modern culture. It has become common to snack while working or enjoying entertainment at home. For example, a November 2022 report from Godrej Yummiez highlighted that 45% of Indian consumers favored snacking during parties and celebrations. This cultural shift highlights the transformation of snacking from a personal choice to a societal expectation.
Meat is majorly used as a raw material by collagen manufacturers
- Meat is an important source of nutrition for people around the world. Global demand for meat has grown over the past 50 years, with meat production tripling. Global produce presently stands at more than 350 million tonnes each year. Regionally, Asia-Pacific holds the position of being the largest meat producer, contributing a substantial portion of the total global meat production. This represents a significant shift from previous decades. Europe's meat output has also doubled in recent years. China is projected to account for most of the total increase in meat production, followed by the United States, Brazil, and India.
- The United States takes the crown as the top producer of beef and buffalo meat, with Brazil and China following suit. Noteworthy contributions also come from Argentina, Australia, and India. In the poultry realm, the United States leads the pack, with China and Brazil playing pivotal roles. As a collective, Europe matches the United States in its substantial poultry output. However, in high-income nations, where per capita meat consumption is already high, a plateau or even a decline in demand is foreseen. This shift is attributed to aging populations and evolving dietary preferences, emphasizing a broader protein palette.
- Expanding herds and flocks, especially in China, are underpinning global meat production's upward trajectory. This trend is set to bolster productivity, coupled with advancements in animal breeding and technology, particularly in low and middle-income nations. Poultry meat, in particular, is driving this surge in global meat production.
Collagen Industry Overview
The Collagen Market is fragmented, with the top five companies occupying 11.59%. The major players in this market are Darling Ingredients Inc., GELITA AG, Italgelatine SpA, Nippi. Inc. and Nitta Gelatin Inc. (sorted alphabetically).
Additional Benefits:
- The market estimate (ME) sheet in Excel format
- 3 months of analyst support
TABLE OF CONTENTS
1 EXECUTIVE SUMMARY & KEY FINDINGS
2 INTRODUCTION
- 2.1 Study Assumptions & Market Definition
- 2.2 Scope of the Study
- 2.3 Research Methodology
3 KEY INDUSTRY TRENDS
- 3.1 End User Market Volume
- 3.1.1 Baby Food and Infant Formula
- 3.1.2 Bakery
- 3.1.3 Beverages
- 3.1.4 Breakfast Cereals
- 3.1.5 Condiments/Sauces
- 3.1.6 Confectionery
- 3.1.7 Dairy and Dairy Alternative Products
- 3.1.8 Elderly Nutrition and Medical Nutrition
- 3.1.9 Meat/Poultry/Seafood and Meat Alternative Products
- 3.1.10 RTE/RTC Food Products
- 3.1.11 Snacks
- 3.1.12 Sport/Performance Nutrition
- 3.1.13 Animal Feed
- 3.1.14 Personal Care and Cosmetics
- 3.2 Protein Consumption Trends
- 3.2.1 Animal
- 3.3 Production Trends
- 3.3.1 Animal
- 3.4 Regulatory Framework
- 3.4.1 China
- 3.4.2 France
- 3.4.3 Germany
- 3.4.4 India
- 3.4.5 Italy
- 3.4.6 Japan
- 3.4.7 United Kingdom
- 3.4.8 United States
- 3.5 Value Chain & Distribution Channel Analysis
4 MARKET SEGMENTATION (includes market size in Value in USD and Volume, Forecasts up to 2030 and analysis of growth prospects)
- 4.1 Form
- 4.1.1 Animal Based
- 4.1.2 Marine Based
- 4.2 End User
- 4.2.1 Animal Feed
- 4.2.2 Food and Beverages
- 4.2.2.1 By Sub End User
- 4.2.2.1.1 Bakery
- 4.2.2.1.2 Beverages
- 4.2.2.1.3 Breakfast Cereals
- 4.2.2.1.4 Snacks
- 4.2.3 Personal Care and Cosmetics
- 4.2.4 Supplements
- 4.2.4.1 By Sub End User
- 4.2.4.1.1 Elderly Nutrition and Medical Nutrition
- 4.2.4.1.2 Sport/Performance Nutrition
- 4.3 Region
- 4.3.1 Africa
- 4.3.1.1 By Form
- 4.3.1.2 By End User
- 4.3.1.3 By Country
- 4.3.1.3.1 Nigeria
- 4.3.1.3.2 South Africa
- 4.3.1.3.3 Rest of Africa
- 4.3.2 Asia-Pacific
- 4.3.2.1 By Form
- 4.3.2.2 By End User
- 4.3.2.3 By Country
- 4.3.2.3.1 Australia
- 4.3.2.3.2 China
- 4.3.2.3.3 India
- 4.3.2.3.4 Indonesia
- 4.3.2.3.5 Japan
- 4.3.2.3.6 Malaysia
- 4.3.2.3.7 New Zealand
- 4.3.2.3.8 South Korea
- 4.3.2.3.9 Thailand
- 4.3.2.3.10 Vietnam
- 4.3.2.3.11 Rest of Asia-Pacific
- 4.3.3 Europe
- 4.3.3.1 By Form
- 4.3.3.2 By End User
- 4.3.3.3 By Country
- 4.3.3.3.1 Belgium
- 4.3.3.3.2 France
- 4.3.3.3.3 Germany
- 4.3.3.3.4 Italy
- 4.3.3.3.5 Netherlands
- 4.3.3.3.6 Russia
- 4.3.3.3.7 Spain
- 4.3.3.3.8 Turkey
- 4.3.3.3.9 United Kingdom
- 4.3.3.3.10 Rest of Europe
- 4.3.4 Middle East
- 4.3.4.1 By Form
- 4.3.4.2 By End User
- 4.3.4.3 By Country
- 4.3.4.3.1 Iran
- 4.3.4.3.2 Saudi Arabia
- 4.3.4.3.3 United Arab Emirates
- 4.3.4.3.4 Rest of Middle East
- 4.3.5 North America
- 4.3.5.1 By Form
- 4.3.5.2 By End User
- 4.3.5.3 By Country
- 4.3.5.3.1 Canada
- 4.3.5.3.2 Mexico
- 4.3.5.3.3 United States
- 4.3.5.3.4 Rest of North America
- 4.3.6 South America
- 4.3.6.1 By Form
- 4.3.6.2 By End User
- 4.3.6.3 By Country
- 4.3.6.3.1 Argentina
- 4.3.6.3.2 Brazil
- 4.3.6.3.3 Rest of South America
- 4.3.1 Africa
5 COMPETITIVE LANDSCAPE
- 5.1 Key Strategic Moves
- 5.2 Market Share Analysis
- 5.3 Company Landscape
- 5.4 Company Profiles (includes Global Level Overview, Market Level Overview, Core Business Segments, Financials, Headcount, Key Information, Market Rank, Market Share, Products and Services, and Analysis of Recent Developments).
- 5.4.1 ASAHI GELATINE INDUSTRIAL Co.,Ltd.
- 5.4.2 Darling Ingredients Inc.
- 5.4.3 Ewald-Gelatine GmbH
- 5.4.4 Foodchem International Corporation
- 5.4.5 GELITA AG
- 5.4.6 Italgelatine SpA
- 5.4.7 Jellice Pioneer Private Limited
- 5.4.8 Nippi. Inc.
- 5.4.9 Nitta Gelatin Inc.
6 KEY STRATEGIC QUESTIONS FOR PROTEIN INGREDIENTS INDUSTRY CEOS
7 APPENDIX
- 7.1 Global Overview
- 7.1.1 Overview
- 7.1.2 Porter's Five Forces Framework
- 7.1.3 Global Value Chain Analysis
- 7.1.4 Market Dynamics (DROs)
- 7.2 Sources & References
- 7.3 List of Tables & Figures
- 7.4 Primary Insights
- 7.5 Data Pack
- 7.6 Glossary of Terms
02-2729-4219
+886-2-2729-4219
 胶原蛋白原料市场规模、份额及成长分析(依原料来源、产品类型、应用、形态及地区划分)-产业预测(2026-2033 年)
 未变性 II 型胶原蛋白市场按来源、形式、剂量、最终用途、分销管道和应用划分——全球预测,2026-2032 年食品级尿石素A市场按应用、形态、最终用户、来源和通路划分-2026-2032年全球预测
 欧洲胶原蛋白:市场占有率分析、产业趋势与统计、成长预测(2026-2031)
 日本胶原蛋白市场报告(按来源、产品、应用和地区划分,2026-2034年)
 胶原蛋白市场机会、成长驱动因素、产业趋势分析及预测(2025-2034年)
 胶原蛋白市场规模、份额和趋势分析报告:按原材料、产品、应用、地区和细分市场预测(2025-2033 年)
 胶原蛋白:全球市场份额和排名、总收入和需求预测(2025-2031年)胶原蛋白市场(依胶原蛋白类型、来源、产品类型、形态、萃取製程、应用和销售管道)——2025-2032 年全球预测
 全球胶原蛋白市场:预测(2025-2030)
▼