


 |
市场调查报告书
商品编码
1683789
Speed Pedelec 电动自行车:市场占有率分析、产业趋势与统计、成长预测(2025-2029 年)Speed Pedelec E-Bike - Market Share Analysis, Industry Trends & Statistics, Growth Forecasts (2025 - 2029) |
||||||
※ 本网页内容可能与最新版本有所差异。详细情况请与我们联繫。
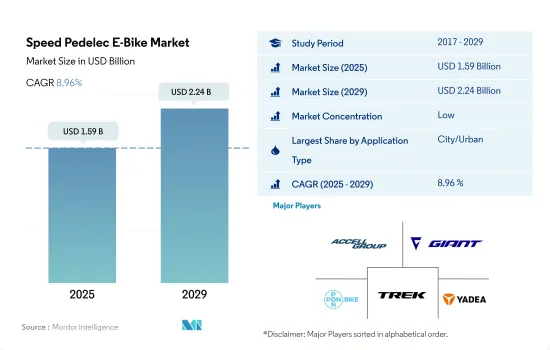
2025 年 Speed Pedelec 电动自行车市场规模估计为 15.9 亿美元,预计到 2029 年将达到 22.4 亿美元,预测期内(2025-2029 年)的复合年增长率为 8.96%。
- 电动自行车在世界各地迅速普及,越来越多的人购买电动自行车用于交通和通勤。以前我用的是山地自行车和健行车。然而,人们对电动自行车的偏好正在增长,因为它们是通勤的更好选择,而且在冬季更容易使用,尤其是在大城镇。 《交通研究》杂誌最近发表的一项研究发现,在六个月的时间里,挪威的电动自行车骑士将自行车作为日常交通方式的使用量增加了四倍以上。购买电动自行车后,骑士们每天平均骑行 9.2 公里(5.7 英里),高于购买前每天平均骑行 2.1 公里(1.3 英里)。
- 市场扩大的主要因素是年轻人的运动和健康意识不断增强。脚踏自行车市场不断扩大,原因有很多,包括消费者健康意识的增强、交通拥堵问题的加剧以及环保意识的增强。这些电动自行车实用、充电方便、操作简单。这些因素导致 2021 年和 2022 年对 Speed Pedelec 电动自行车的需求增加。
- 电动自行车产业的参与者正致力于引进尖端技术创新,例如智慧控制系统,可用于实现最高能源效率的高速电动自行车的自动或半自动变速箱。预计在预测期内,越野骑行等休閒活动的需求和高速电动自行车的需求将推动 250W 及以上电动自行车的需求。
国家概况
- 预计全球电动自行车市场将主要受到全球范围内越来越多地采用电动自行车作为日常交通方式的推动。其他福利包括健康福利、经济机动性和乘坐便利。
- 在亚太地区电动自行车市场,2023年的销量约为3,480万辆。中国、日本和印尼占了大部分销售额。以销量计算,2022年中国将占全球电动自行车市场的90%以上。然而,中国电动自行车市场近年来成长停滞,已接近饱和状态。
- 近年来,电动自行车在欧洲的销售量激增,德国、比利时、荷兰等国电动自行车销量庞大。消费者对用于交通、运动和休閒的电动自行车的偏好日益增长,推动了电动自行车的销售。此外,瑞典、比利时和法国对电动自行车的补贴和税收优惠预计将在预测期内支持欧洲电动自行车市场的显着成长。
- 在北美,由于近年来人们对低速两轮车的偏好增加,电动自行车市场目前正处于早期成长阶段。随着各共享单车业者不断增加电动自行车数量以扩充其车队,预计在不久的将来电动自行车的销售将会成长。
全球 Speed Pedelec 电动自行车市场趋势
全球电动自行车普及率的稳定上升反映了全球向永续、高效的个人移动解决方案的转变。
- 近年来,许多国家对电动自行车的需求不断增加。汽油价格上涨、交通高峰期拥挤以及运动带来的健康益处推动了英国和美国等多个国家开始普及电动自行车。欧洲是 2019 年电动自行车销售的主要市场,与其他地区相比,采用率更高。与 2018 年相比,2019 年对电动自行车的需求不断增加,加速了电动自行车的普及率。
- 新冠肺炎疫情在全球迅速蔓延,对自行车产业产生了正面影响。与其他交通途径相比,电动自行车是日常通勤和其他本地地点旅行最实用且经济实惠的解决方案之一,并且彻底改变了消费者的通勤方式。这鼓励了人们投资电动自行车,2020 年全球电动自行车的普及率与 2019 年相比有所加速。
- 商业营运的恢復和停工等贸易限制的解除加速了世界各国对电动自行车的普及。进出口活动的改善是全球贸易壁垒消除的结果。根据估计和预测,在预测期内,由于电动自行车具有边骑行边锻炼、无燃料成本、清洁骑行等特点和优势,消费者对电动自行车的兴趣将会增加,从而导致全球许多国家的电动自行车普及率提高。
全球范围内通勤距离在 5 至 15 公里之间的增长凸显了随着工作与生活动态以及城市规划的不断发展,人们普遍转向更适中的通勤距离。
- 全球自行车市场包括北美、欧洲和亚太等几个热爱自行车的地区。近年来,许多国家不同地区对自行车的需求正在增加。许多国家和地区的人们越来越多地使用自行车进行每天5至15公里的通勤,以及前往办公室和商业区等附近的地方。在所有地区中,亚太地区每天通勤距离在 5-15 公里之间的人数最多。
- 在新冠肺炎疫情爆发后,全球多个国家的健身房和公共交通被迫关闭,许多人发现骑自行车是安全且隔离的交通方式。此外,在疫情期间,2020年全球每天出行5至15公里的通勤人数与2019年相比有所增加,因为人们更喜欢在周末骑自行车或在附近跑步来锻炼身体。每天通勤 5-15 公里的消费者倾向于选择配备尖端电池组的电动自行车,其续航里程可延长至 40-45 公里。
Speed Pedelec 电动自行车产业概况
Speed Pedelec电动自行车市场较为分散,前五大企业占了29.69%的市场。该市场的主要企业是:Accell Group、Giant Manufacturing、Pon Holding BV、Trek Bicycle Corporation和Yadea Group Holdings Ltd.(按字母顺序排列)。
其他福利
- Excel 格式的市场预测 (ME) 表
- 3 个月的分析师支持
目录
第 1 章执行摘要和主要发现
第二章 报告要约
第 3 章 简介
- 研究假设和市场定义
- 研究范围
- 调查方法
第四章 产业主要趋势
- 自行车销量
- 人均国内生产毛额
- 通货膨胀率
- 电动自行车普及率
- 每天出游 5 至 15 公里的人口/通勤者百分比
- 自行车出租
- 电动自行车电池价格
- 电池化学价格表
- 超本地化配送
- 自行车道
- 徒步人数
- 电池充电容量
- 交通拥堵指数
- 法律规范
- 价值链与通路分析
第五章 市场区隔
- 应用程式类型
- 货运/公用设施
- 城市/城区
- 健行
- 电池类型
- 铅酸电池
- 锂离子电池
- 其他的
- 地区
- 非洲
- 按国家
- 南非
- 非洲以外
- 亚太地区
- 按国家
- 澳洲
- 中国
- 印度
- 日本
- 纽西兰
- 韩国
- 亚太地区其他国家
- 欧洲
- 按国家
- 奥地利
- 比利时
- 捷克共和国
- 丹麦
- 芬兰
- 法国
- 德国
- 义大利
- 卢森堡
- 荷兰
- 挪威
- 波兰
- 西班牙
- 瑞典
- 瑞士
- 英国
- 其他欧洲国家
- 中东
- 按国家
- 沙乌地阿拉伯
- 阿拉伯聯合大公国
- 其他中东地区
- 北美洲
- 按国家
- 加拿大
- 墨西哥
- 美国
- 北美其他地区
- 南美洲
- 按国家
- 阿根廷
- 巴西
- 南美洲其他地区
- 非洲
第六章 竞争格局
- 关键策略趋势
- 市场占有率分析
- 业务状况
- 公司简介
- Accell Group
- Aima Technology Group Co. Ltd
- Cycling Sports Group, Inc.
- Fritzmeier Systems GmbH & Co. KG(M1 Sporttechnik)
- Giant Manufacturing Co. Ltd.
- Kalkhoff Werke GmbH
- Merida Industry Co. Ltd
- Pon Holding BV
- Riese & Muller
- Royal Dutch Gazelle
- Specialized Bicycle Components
- Tianjin Fuji-Ta Bicycle Co. Ltd.
- Trek Bicycle Corporation
- VanMoof BV
- Yadea Group Holdings Ltd.
- Yamaha Motor Co., Ltd.
第七章:执行长的关键策略问题
第 8 章 附录
- 世界概况
- 概述
- 五力分析框架
- 全球价值链分析
- 市场动态(DRO)
- 资讯来源和进一步阅读
- 图片列表
- 关键见解
- 资料包
- 词彙表
The Speed Pedelec E-Bike Market size is estimated at 1.59 billion USD in 2025, and is expected to reach 2.24 billion USD by 2029, growing at a CAGR of 8.96% during the forecast period (2025-2029).
- Electric bicycles are rapidly becoming more popular globally, with the increasing trend of more people buying e-bikes for transportation and commuting. Previously, people used mountain bikes or trekking bikes for this purpose. However, the preference for e-bikes is growing, as they are more suited for commuting and can be more easily used in wintertime, especially in big towns. According to a recent study published in the journal of Transportation Research, Norwegian e-bike riders more than quadrupled their daily use of the bicycle for transport over six months. After buying an e-bike, riders covered 9.2 km (5.7 miles) per day on average, up from 2.1 km (1.3 miles) per day before their purchase.
- The primary driver of the market's expansion is a rise in young people's awareness of exercise and health. The market for pedelecs is expanding due to reasons like rising consumer health awareness, growing traffic congestion problems, and growing environmental consciousness. These e-bikes are practical and simple to charge, and easy to operate. Due to these factors, the demand for speed pedelec e-bikes increased in 2021 and 2022.
- Players in the e-bike industry are working to introduce cutting-edge technological innovations, including intelligent control systems, which may be used to implement automatic or semi-automatic transmission for speed pedelecs that have the best energy efficiency. The growing demand for recreational activities like off-road cycling and the demand for speed pedelecs are likely to drive the demand for above 250 W e-bikes during the forecast period.
Country Level Overview
- The global e-bike market is expected to be mainly driven by the increasing adoption of electric bikes as a daily mode of transportation globally. Additionally, the market is seeing an upsurge in the unit sales of electric bikes owing to their benefits, such as health benefits, economic mobility, and convenience in riding.
- In the APAC e-bike market, unit sales amounted to around 34.8 million in 2023. China, Japan, and Indonesia accounted for the majority of unit sales during the historical period. China accounted for over a 90% share by volume in the global electric bike market in 2022. However, the Chinese e-bike market has been witnessing growth stagnate in recent years and is almost at saturation point.
- In Europe, electric bike sales have skyrocketed in recent years, with countries including Germany, Belgium, and the Netherlands selling large numbers of electric bikes. The sales are being driven by consumers' growing preference for using electric bikes for transportation, sports, and leisure activities. Additionally, the subsidies and tax incentives programs for electric bikes in Sweden, Belgium, and France are expected to support the significant growth of the European electric bike market during the forecast period.
- In North America, the electric bike market is currently at an early growth stage as people's preference for using low-speed two-wheelers has increased only in recent years. The inclusion of more electric bikes by various bike-sharing operators as part of their fleet expansion is expected to support the sales growth of these bikes in the near future.
Global Speed Pedelec E-Bike Market Trends
The steady global increase in e-bike adoption rates reflects a worldwide shift toward sustainable and efficient personal mobility solutions
- There has been an increase in the demand for electric bicycles in many countries over the past several years. Increased gasoline costs, traffic congestion during rush hours, and the health advantages of exercise are driving the adoption of e-bikes in several countries, including the United Kingdom and the United States. With a greater adoption rate in 2019 compared to other regions, Europe was the primary market for the sales of electric bikes. The increasing demand for e-bikes accelerated the adoption rate in 2019 compared to 2018.
- The bicycle industry was favorably impacted by the rapid global expansion of COVID-19 cases. E-bikes are one of the most practical and affordable solutions for everyday commutes to work and other local locations compared to other means of transportation, which has revolutionized how consumers commute. This has encouraged people to invest in e-bikes, which accelerated their adoption rate in 2020 over 2019 in various countries worldwide.
- The return of commercial operations and the lifting of trade restrictions like lockouts have accelerated the adoption of e-bikes in numerous countries throughout the world. The improvement of import and export activities has been a result of the removal of trade obstacles globally. According to estimates, during the forecast period, the adoption rate of e-bikes will increase in a number of countries worldwide due to consumers' growing interest in them as a result of their features and advantages, such as the ability to exercise while riding, the lack of fuel costs, and cleaner rides.
A global uptick in 5-15 km commutes underscores a universal shift towards moderate commuting distances, aligning with evolving work-life dynamics and urban planning.
- The global bicycle market is made up of several bicycle-friendly regions, including North America, Europe, and Asia-Pacific. Bicycle demand has grown recently among many countries in various regions. People from different countries and regions are gradually shifting to using bicycles for their everyday commutes of 5 to 15 km or other nearby locations such as offices and commercial districts. The APAC region has witnessed the most daily commuters traveling 5 to 15 km among all regions.
- Following the COVID-19 outbreak, which forced the closing of gyms and public transportation in several countries worldwide, many people discovered bicycles to be a secure and isolated method of transportation. People also preferred to exercise during the pandemic by bicycling or going on weekend runs to neighboring sites, which led to an increase in the number of commuters with a daily journey distance of 5 to 15 km in 2020 over 2019 globally. Consumers who commute 5 to 15 km daily are drawn to e-bikes with cutting-edge battery packs that offer an increased range of up to 40 to 45 km.
Speed Pedelec E-Bike Industry Overview
The Speed Pedelec E-Bike Market is fragmented, with the top five companies occupying 29.69%. The major players in this market are Accell Group, Giant Manufacturing Co. Ltd., Pon Holding B.V., Trek Bicycle Corporation and Yadea Group Holdings Ltd. (sorted alphabetically).
Additional Benefits:
- The market estimate (ME) sheet in Excel format
- 3 months of analyst support
TABLE OF CONTENTS
1 EXECUTIVE SUMMARY & KEY FINDINGS
2 REPORT OFFERS
3 INTRODUCTION
- 3.1 Study Assumptions & Market Definition
- 3.2 Scope of the Study
- 3.3 Research Methodology
4 KEY INDUSTRY TRENDS
- 4.1 Bicycle Sales
- 4.2 GDP Per Capita
- 4.3 Inflation Rate
- 4.4 Adoption Rate Of E-bikes
- 4.5 Percent Population/commuters With 5-15 Km Daily Travel Distance
- 4.6 Bicycle Rental
- 4.7 E-bike Battery Price
- 4.8 Price Chart Of Different Battery Chemistry
- 4.9 Hyper-local Delivery
- 4.10 Dedicated Bicycle Lanes
- 4.11 Number Of Trekkers
- 4.12 Battery Charging Capacity
- 4.13 Traffic Congestion Index
- 4.14 Regulatory Framework
- 4.15 Value Chain & Distribution Channel Analysis
5 MARKET SEGMENTATION (includes market size in Value in USD and Volume, Forecasts up to 2029 and analysis of growth prospects)
- 5.1 Application Type
- 5.1.1 Cargo/Utility
- 5.1.2 City/Urban
- 5.1.3 Trekking
- 5.2 Battery Type
- 5.2.1 Lead Acid Battery
- 5.2.2 Lithium-ion Battery
- 5.2.3 Others
- 5.3 Region
- 5.3.1 Africa
- 5.3.1.1 By Country
- 5.3.1.1.1 South Africa
- 5.3.1.1.2 Rest-of-Africa
- 5.3.2 Asia-Pacific
- 5.3.2.1 By Country
- 5.3.2.1.1 Australia
- 5.3.2.1.2 China
- 5.3.2.1.3 India
- 5.3.2.1.4 Japan
- 5.3.2.1.5 New Zealand
- 5.3.2.1.6 South Korea
- 5.3.2.1.7 Rest-of-APAC
- 5.3.3 Europe
- 5.3.3.1 By Country
- 5.3.3.1.1 Austria
- 5.3.3.1.2 Belgium
- 5.3.3.1.3 Czech Republic
- 5.3.3.1.4 Denmark
- 5.3.3.1.5 Finland
- 5.3.3.1.6 France
- 5.3.3.1.7 Germany
- 5.3.3.1.8 Italy
- 5.3.3.1.9 Luxembourg
- 5.3.3.1.10 Netherlands
- 5.3.3.1.11 Norway
- 5.3.3.1.12 Poland
- 5.3.3.1.13 Spain
- 5.3.3.1.14 Sweden
- 5.3.3.1.15 Switzerland
- 5.3.3.1.16 UK
- 5.3.3.1.17 Rest-of-Europe
- 5.3.4 Middle East
- 5.3.4.1 By Country
- 5.3.4.1.1 Saudi Arabia
- 5.3.4.1.2 United Arab Emirates
- 5.3.4.1.3 Rest-of-Middle East
- 5.3.5 North America
- 5.3.5.1 By Country
- 5.3.5.1.1 Canada
- 5.3.5.1.2 Mexico
- 5.3.5.1.3 US
- 5.3.5.1.4 Rest-of-North America
- 5.3.6 South America
- 5.3.6.1 By Country
- 5.3.6.1.1 Argentina
- 5.3.6.1.2 Brazil
- 5.3.6.1.3 Rest-of-South America
- 5.3.1 Africa
6 COMPETITIVE LANDSCAPE
- 6.1 Key Strategic Moves
- 6.2 Market Share Analysis
- 6.3 Company Landscape
- 6.4 Company Profiles
- 6.4.1 Accell Group
- 6.4.2 Aima Technology Group Co. Ltd
- 6.4.3 Cycling Sports Group, Inc.
- 6.4.4 Fritzmeier Systems GmbH & Co. KG (M1 Sporttechnik)
- 6.4.5 Giant Manufacturing Co. Ltd.
- 6.4.6 Kalkhoff Werke GmbH
- 6.4.7 Merida Industry Co. Ltd
- 6.4.8 Pon Holding B.V.
- 6.4.9 Riese & Muller
- 6.4.10 Royal Dutch Gazelle
- 6.4.11 Specialized Bicycle Components
- 6.4.12 Tianjin Fuji-Ta Bicycle Co. Ltd.
- 6.4.13 Trek Bicycle Corporation
- 6.4.14 VanMoof BV
- 6.4.15 Yadea Group Holdings Ltd.
- 6.4.16 Yamaha Motor Co., Ltd.
7 KEY STRATEGIC QUESTIONS FOR E BIKES CEOS
8 APPENDIX
- 8.1 Global Overview
- 8.1.1 Overview
- 8.1.2 Porter's Five Forces Framework
- 8.1.3 Global Value Chain Analysis
- 8.1.4 Market Dynamics (DROs)
- 8.2 Sources & References
- 8.3 List of Tables & Figures
- 8.4 Primary Insights
- 8.5 Data Pack
- 8.6 Glossary of Terms


