


 |
市场调查报告书
商品编码
1684061
建筑修復和维修化学品-市场占有率分析、行业趋势和统计、成长预测(2025-2030 年)Construction Repair and Rehabilitation Chemicals - Market Share Analysis, Industry Trends & Statistics, Growth Forecasts (2025 - 2030) |
||||||
※ 本网页内容可能与最新版本有所差异。详细情况请与我们联繫。
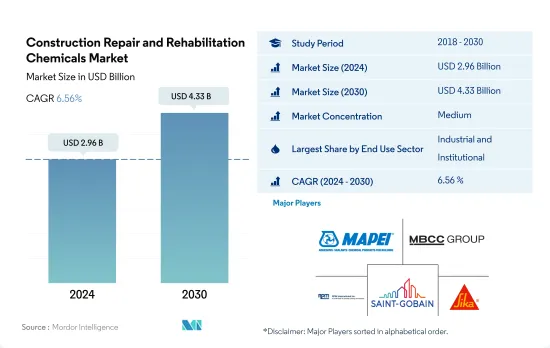
建筑修復和维修化学品市场规模估计和预测到 2024 年将达到 29.6 亿美元,预计到 2030 年将达到 43.3 亿美元,在市场估计和预测期(2024-2030 年)内以 6.56% 的复合年增长率增长。
工业建筑的兴起可能会推动对建筑修復和维修化学品的需求
- 2022 年,全球建筑修復和维修化学品市场价值成长了 4.72%,这得益于商业、工业和机构建筑行业需求的不断增长。预计这种成长将在 2023 年持续,预计成长率将比 2022 年提高 4.64%。
- 2022 年,工业和设施产业成为主要消费者,占建筑修復和维修化学品市场的 48.20% 左右。预计2023年该产业的占地面积将增加90.2亿平方英尺,主要原因是工业、教育和医疗保健建设投资增加。因此,预计 2023 年该行业对建筑修復和维修化学品的需求将增长约 5.25%。
- 展望未来,工业和设施产业预计将保持成长轨迹,2023 年至 2030 年以金额为准的复合年增长率为 7%。预计该产业的全球现有占地面积将在 2023 年达到 3,600 亿平方英尺,到 2030 年将进一步达到 4,290 亿平方英尺。此外,印度、印尼和越南等经济体正在快速扩张,这将显着影响这些国家对工业房地产的需求,以满足其对高效能工厂的需求。因此,该领域的修復和翻新化学品市场规模预计将从 2023 年的 13.3 亿美元飙升至 2030 年的 21.5 亿美元。
- 因此,预计预测期内它将经历显着增长。
亚太国家GDP成长对建筑修復和维修化学品市场未来的影响
- 受建筑和基础设施维修热潮的推动,2022 年全球建筑修復和维修化学品市场以金额为准增加了 5%。这些倡议旨在促进经济成长并加强能源效率标准。预计到 2023 年,全球建筑修復和维修化学品市场以金额为准将进一步成长 4.6%,其中北美和亚太地区将引领这一成长。
- 以中国、日本和印度等国家为首的亚太地区在全球建筑修復和维修化学品消费中占据主导地位。光是这三个国家就将在2022年占据28%的市场。值得注意的是,微混凝土砂浆对亚太市场贡献巨大,其次是可注射水泥浆材料。
- 欧洲在建筑修復和维修化学品的消费量方面排名第二,其中德国、法国和英国是主要贡献者。到2022年,这三个国家将占欧洲市值的近47%。工业、设施和基础设施部门是欧洲化学品的主要消费者。
- 预计亚太地区建筑修復和维修化学品市场将实现最高成长,2023 年至 2030 年期间的以金额为准为 7.12%。这一成长可能受到该地区强劲经济的推动,包括印度、中国、泰国和日本。尤其是中国和印度的GDP年增率分别为5.2%和5.9%。
建筑修復和维修化学品市场的全球趋势
商业建筑投资和办公空间的增加可能会促进商业部门的发展
- 2022 年,受办公大楼、饭店和零售商场等房地产需求激增的推动,全球商业建筑占地面积增加 2%。尤其值得注意的是印度的零售业,其排名前七的城市的购物中心面积超过 260 万平方英尺,较 2021 年增长 27%。接下来的一年,即 2023 年,全球商业部门的占地面积预计将激增约 68 亿平方英尺,这主要得益于外国直接投资 (FDI) 的激增,从而在全球范围内产生对新办公室、仓库和零售空间的需求。
- 2018年至2021年间,全球商业建筑占地面积扩大了6.33%。 2021年,全球近390个大城市的办公大楼运转率强劲成长,成长超过80%。此外,从 2021 年第三季开始,办公空间净吸收量达到 3,000 万平方英尺。因此,2021 年全球商业建筑占地面积与前一年同期比较增加约 65 亿平方英尺。
- 根据预测,预测期内全球商业建筑占地面积(以体积计算)的复合年增长率将达到 2.21%。这一增长是由商业建筑支出和办公空间需求的不断增长所推动的。例如,预计到 2027 年,美国的商业建筑支出将达到 6,460 亿美元。在印度,预计到 2026 年,前七大城的甲级办公室市场将扩大至约 10 亿平方英尺,到 2030 年将进一步扩大至 12 亿平方英尺。
住宅需求的增加和维修投资的增加可能会推动住宅产业的建设
- 2022年,受人口成长、富裕程度提高及都市化快速发展等因素推动,全球住宅现有占地面积将增加1.35%。尤其是住宅建筑领域,2023 年占地面积将急剧增加至约 282 亿平方英尺,主要是由于住宅单元数量的增加。尤其是美国,预计到2023年将建造2.4119亿住宅。
- 2018年至2021年间,全球住宅领域的占地面积以体积计算扩大了约4.05%。 2020年,住宅领域占全球建设产业的44%,巩固了其作为最大子部门的地位,并成为全球成长的关键驱动力。 2021年全球住宅占地面积将增加约276亿平方英尺,光是美国就将完工133万套住宅,与前一年同期比较增加4%。
- 展望未来,全球住宅占地面积预计将以 1.50% 的复合年增长率成长。这一增长将受到持续的住宅需求、不断增加的投资和政府的支持性政策的推动。对经济适用住宅的关注可能会振兴全球住宅建筑业并有助于经济復苏。例如,据估计,到 2030 年,印度将需要额外 2,500 万套经济适用住宅来满足其不断增长的城市人口的需求。此外,欧洲计划在2030年投资约25亿欧元用于住宅维修。
建筑修復和维修化学品行业概况
建筑修復和维修化学品市场适度整合,前五大公司占据51.58%的市场份额。该市场的主要企业有:MAPEI SpA、MBCC Group、RPM International Inc.、Saint-Gobain 和 Sika AG(按字母顺序排列)。
其他福利
- Excel 格式的市场预测 (ME) 表
- 3个月的分析师支持
目录
第一章执行摘要和主要发现
第二章 报告要约
第三章 引言
- 研究假设和市场定义
- 研究范围
- 调查方法
第四章 产业主要趋势
- 最终用途趋势
- 商业
- 工业/设施
- 住宅
- 法律规范
- 价值炼和通路分析
第五章市场区隔
- 最终用途类别
- 商业
- 工业/设施
- 基础设施
- 住宅
- 子产品
- 光纤缠绕系统
- 水泥浆料
- 微混凝土砂浆
- 改质砂浆
- 钢筋保护材料
- 地区
- 亚太地区
- 按国家
- 澳洲
- 中国
- 印度
- 印尼
- 日本
- 马来西亚
- 韩国
- 泰国
- 越南
- 其他亚太地区
- 欧洲
- 按国家
- 法国
- 德国
- 义大利
- 俄罗斯
- 西班牙
- 英国
- 其他欧洲国家
- 中东和非洲
- 按国家
- 沙乌地阿拉伯
- 阿拉伯聯合大公国
- 其他中东和非洲地区
- 北美洲
- 按国家
- 加拿大
- 墨西哥
- 美国
- 南美洲
- 按国家
- 阿根廷
- 巴西
- 南美洲其他地区
- 亚太地区
第六章 竞争格局
- 关键策略趋势
- 市场占有率分析
- 商业状况
- 公司简介
- Ardex Group
- Fosroc, Inc.
- MAPEI SpA
- MBCC Group
- MC-Bauchemie
- Remmers Gruppe AG
- RPM International Inc.
- Saint-Gobain
- Sika AG
- Simpson Strong-Tie Company, Inc.
第 7 章 CEO 的关键策略问题CEO 的关键策略问题
第 8 章 附录
- 世界概况
- 概述
- 五力分析框架(产业吸引力分析)
- 全球价值链分析
- 市场动态(DRO)
- 资讯来源及延伸阅读
- 图片列表
- 关键见解
- 资料包
- 词彙表
The Construction Repair and Rehabilitation Chemicals Market size is estimated at 2.96 billion USD in 2024, and is expected to reach 4.33 billion USD by 2030, growing at a CAGR of 6.56% during the forecast period (2024-2030).
Rising industrial construction is likely to drive the demand for repair and rehabilitation chemicals
- The global market for repair and rehabilitation chemicals experienced a 4.72% growth in value in 2022, driven by rising demand from the commercial and industrial and institutional construction sectors. This growth was estimated to continue in 2023, with a projected rate of 4.64% compared to 2022.
- In 2022, the industrial and institutional sector emerged as the dominant consumer, accounting for approximately 48.20% of the repair and rehabilitation chemicals market. This sector's floor area was set to expand by 9.02 billion square feet in 2023, primarily fueled by increased investments in industrial, education, and healthcare construction. Consequently, the demand for repair and rehabilitation chemicals in this sector is expected to rise by about 5.25% in 2023.
- Looking ahead, the industrial and institutional sector is poised to maintain its growth trajectory, with a projected CAGR of 7% in value from 2023 to 2030. The global existing floor area for this sector is forecasted to reach 360 billion square feet in 2023 and further climb to 429 billion square feet by 2030, driven by heightened industrial construction investments worldwide. Furthermore, several economies such as India, Indonesia, and Vietnam have shown rapid expansion that considerably impacted the need for an industrial property to meet the demands of efficient factories in the countries. As a result, the market for repair and rehabilitation chemicals in this sector is anticipated to surge from USD 1.33 billion in 2023 to USD 2.15 billion in 2030.
- Therefore, the market studied is expected to witness substantial growth during the forecast period.
The future of the construction repair and rehabilitation chemicals market is set to be influenced by the GDP growth of Asia-Pacific countries
- The global construction repair and rehabilitation chemicals market witnessed a 5% increase in terms of value in 2022, driven by a surge in building and infrastructure renovations. These initiatives aimed to boost economic growth and enhance energy efficiency standards. The global construction repair and rehabilitation chemicals market is projected to record a further 4.6% growth in 2023 by value, with North America and Asia-Pacific leading the way.
- Asia-Pacific, led by countries such as China, Japan, and India, dominates the global consumption of repair and rehabilitation chemicals. These three nations alone accounted for 28% of the market's value in 2022. Notably, micro-concrete mortars emerged as a significant contributor to the Asia-Pacific market, following injection grouting materials.
- Europe ranks second in terms of repair and rehabilitation chemical consumption, with Germany, France, and the United Kingdom being the primary contributors. In 2022, these three countries represented nearly 47% of Europe's market value. The industrial, institutional, and infrastructure segments are the major consumers of these chemicals in Europe.
- Asia-Pacific is projected to witness the highest growth in the construction repair and rehabilitation chemicals market, with a CAGR of 7.12% in terms of value from 2023 to 2030. This growth is likely to be fueled by the region's robust economies, including India, China, Thailand, and Japan. Notably, China and India's GDPs are growing at annual rates of 5.2% and 5.9%, respectively.
Global Construction Repair and Rehabilitation Chemicals Market Trends
Rising commercial construction investment and office spaces are likely to boost the commercial sector
- In 2022, the global commercial sector witnessed a 2% increase in its floor area, driven by a surge in demand for properties like offices, hotels, and retail malls. Notably, the Indian retail industry saw a significant uptick, with its top seven cities adding over 2.6 million sq. ft of mall space, marking a 27% jump from 2021. The following year, in 2023, the global commercial sector's floor area surged by approximately 6.8 billion sq. ft, largely propelled by a surge in foreign direct investment (FDI), necessitating new offices, warehouses, and retail outlets worldwide.
- Between 2018 and 2021, the global commercial sector's floor area expanded by 6.33% in volume. In 2021, office occupancy witnessed a robust growth of over 80% across nearly 390 metro cities globally. Additionally, from Q3 2021, there was a net absorption of 30 million sq. ft. of office space. Consequently, the global commercial sector's floor area swelled by approximately 6.5 billion sq. ft. in 2021 compared to the previous year.
- Projections indicate that the global commercial sector's floor area will register a CAGR of 2.21% in volume during the forecast period. This growth is fueled by heightened demand for commercial construction spending and office spaces. For instance, commercial construction spending in the United States is set to hit USD 646 billion by 2027. In India, the Grade A office market in the top seven cities is expected to expand to nearly 1 billion sq. ft by 2026 and further to 1.2 billion sq. ft by 2030.
Increasing demand for housing units and investments in renovation are likely to boost residential sector constructions
- In 2022, the global residential sector witnessed a 1.35% increase in its existing floor area, driven by factors like population growth, rising wealth, and rapid urbanization. The residential construction sector, specifically, saw a surge of around 28.2 billion sq. ft in its floor area in 2023, primarily due to a rise in the number of homes. Notably, the United States was projected to have 241.19 million homes by 2023.
- Between 2018 and 2021, the global residential sector's floor area expanded by approximately 4.05% in terms of volume. In 2020, the residential sector accounted for 44% of the global construction industry, solidifying its position as the largest subsector and a key driver of global growth. The global residential floor area grew by about 27.6 billion sq. ft in 2021, with the United States alone completing 1.33 million housing units, marking a 4% increase from the previous year.
- Looking ahead, the global residential sector's floor area is projected to witness a CAGR of 1.50% in terms of volume. This growth will be fueled by sustained housing demand, increased investments, and supportive government policies. The emphasis on affordable housing is set to rejuvenate the global residential construction sector, aiding its recovery. For instance, it is estimated that India will require an additional 25 million affordable housing units by 2030 to meet the needs of its expanding urban population. Additionally, Europe has plans to invest approximately EUR 2.5 billion in residential dwelling renovations by 2030.
Construction Repair and Rehabilitation Chemicals Industry Overview
The Construction Repair and Rehabilitation Chemicals Market is moderately consolidated, with the top five companies occupying 51.58%. The major players in this market are MAPEI S.p.A., MBCC Group, RPM International Inc., Saint-Gobain and Sika AG (sorted alphabetically).
Additional Benefits:
- The market estimate (ME) sheet in Excel format
- 3 months of analyst support
TABLE OF CONTENTS
1 EXECUTIVE SUMMARY & KEY FINDINGS
2 REPORT OFFERS
3 INTRODUCTION
- 3.1 Study Assumptions & Market Definition
- 3.2 Scope of the Study
- 3.3 Research Methodology
4 KEY INDUSTRY TRENDS
- 4.1 End Use Sector Trends
- 4.1.1 Commercial
- 4.1.2 Industrial and Institutional
- 4.1.3 Residential
- 4.2 Regulatory Framework
- 4.3 Value Chain & Distribution Channel Analysis
5 MARKET SEGMENTATION (includes market size, forecasts up to 2030 and analysis of growth prospects.)
- 5.1 End Use Sector
- 5.1.1 Commercial
- 5.1.2 Industrial and Institutional
- 5.1.3 Infrastructure
- 5.1.4 Residential
- 5.2 Sub Product
- 5.2.1 Fiber Wrapping Systems
- 5.2.2 Injection Grouting Materials
- 5.2.3 Micro-concrete Mortars
- 5.2.4 Modified Mortars
- 5.2.5 Rebar Protectors
- 5.3 Region
- 5.3.1 Asia-Pacific
- 5.3.1.1 By Country
- 5.3.1.1.1 Australia
- 5.3.1.1.2 China
- 5.3.1.1.3 India
- 5.3.1.1.4 Indonesia
- 5.3.1.1.5 Japan
- 5.3.1.1.6 Malaysia
- 5.3.1.1.7 South Korea
- 5.3.1.1.8 Thailand
- 5.3.1.1.9 Vietnam
- 5.3.1.1.10 Rest of Asia-Pacific
- 5.3.2 Europe
- 5.3.2.1 By Country
- 5.3.2.1.1 France
- 5.3.2.1.2 Germany
- 5.3.2.1.3 Italy
- 5.3.2.1.4 Russia
- 5.3.2.1.5 Spain
- 5.3.2.1.6 United Kingdom
- 5.3.2.1.7 Rest of Europe
- 5.3.3 Middle East and Africa
- 5.3.3.1 By Country
- 5.3.3.1.1 Saudi Arabia
- 5.3.3.1.2 United Arab Emirates
- 5.3.3.1.3 Rest of Middle East and Africa
- 5.3.4 North America
- 5.3.4.1 By Country
- 5.3.4.1.1 Canada
- 5.3.4.1.2 Mexico
- 5.3.4.1.3 United States
- 5.3.5 South America
- 5.3.5.1 By Country
- 5.3.5.1.1 Argentina
- 5.3.5.1.2 Brazil
- 5.3.5.1.3 Rest of South America
- 5.3.1 Asia-Pacific
6 COMPETITIVE LANDSCAPE
- 6.1 Key Strategic Moves
- 6.2 Market Share Analysis
- 6.3 Company Landscape
- 6.4 Company Profiles
- 6.4.1 Ardex Group
- 6.4.2 Fosroc, Inc.
- 6.4.3 MAPEI S.p.A.
- 6.4.4 MBCC Group
- 6.4.5 MC-Bauchemie
- 6.4.6 Remmers Gruppe AG
- 6.4.7 RPM International Inc.
- 6.4.8 Saint-Gobain
- 6.4.9 Sika AG
- 6.4.10 Simpson Strong-Tie Company, Inc.
7 KEY STRATEGIC QUESTIONS FOR CONCRETE, MORTARS AND CONSTRUCTION CHEMICALS CEOS
8 APPENDIX
- 8.1 Global Overview
- 8.1.1 Overview
- 8.1.2 Porter's Five Forces Framework (Industry Attractiveness Analysis)
- 8.1.3 Global Value Chain Analysis
- 8.1.4 Market Dynamics (DROs)
- 8.2 Sources & References
- 8.3 List of Tables & Figures
- 8.4 Primary Insights
- 8.5 Data Pack
- 8.6 Glossary of Terms
 建筑化学品市场按产品类型、技术、形式、建筑类型、应用、最终用户和分销管道划分 - 2025-2030 年全球预测
 全球混凝土裂缝填充材市场
 2025年建筑化学品全球市场报告
 建筑化学品市场:全球产业分析、市场规模、份额、成长、趋势和未来预测(2025-2032 年)
 建筑化学品市场 - 2025-2030 年预测
 东南亚建筑化学品:市场占有率分析、产业趋势、统计数据和成长预测(2025-2030 年)
 日本建筑化学品市场报告(按类型(混凝土外加剂、防水和屋顶、修补、地板、密封剂和黏合剂等)、应用(住宅、非住宅)和地区)2025-2033建筑化学品市场规模、份额、趋势及预测(按类型、应用和地区)2025-2033
 建筑化学品市场规模、份额及成长分析(混凝土外加剂、防水剂、防护被覆剂、黏合剂及密封剂、修补剂及修復剂及地区)- 2025-2032 年产业预测中东和非洲的建筑化学品:市场占有率分析、行业趋势和成长预测(2025-2030 年)