


 |
市场调查报告书
商品编码
1684067
防水解决方案:市场占有率分析、产业趋势与统计、成长预测(2025-2030 年)Waterproofing Solutions - Market Share Analysis, Industry Trends & Statistics, Growth Forecasts (2025 - 2030) |
||||||
价格
※ 本网页内容可能与最新版本有所差异。详细情况请与我们联繫。
简介目录
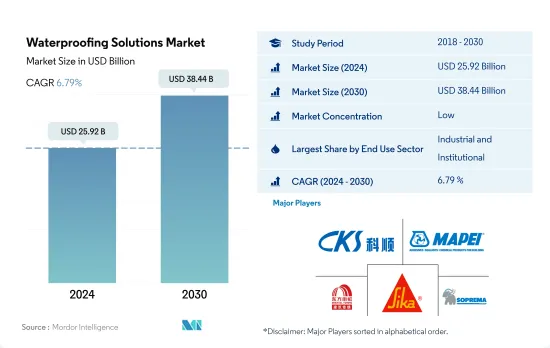
防水解决方案市场规模预计在 2024 年达到 259.2 亿美元,预计到 2030 年将达到 384.4 亿美元,预测期内(2024-2030 年)的复合年增长率为 6.79%。
主要国家的建设计画可能会推动对防水解决方案的需求,例如印度计划在 2030 年之前建造约 5 亿平方英尺的仓库空间。
- 2022年,受工业、机构和住宅建筑领域需求成长的推动,全球防水解决方案消费量以金额为准成长了5.15%。到 2023 年,防水解决方案预计将占全球建筑化学品市场的约 28.46%。
- 预计工业和机构部门将成为防水解决方案的最大消费者,到 2022 年将占 32.09% 的份额。对新工业建筑的投资,尤其是在美国,预计到 2026 年支出将达到 475.9 亿美元,将推动这一成长。因此,预计 2023-2030 年预测期内该领域对防水解决方案的需求将增加 42 亿美元。
- 预计住宅领域将成为防水解决方案成长最快的消费者,预测期内复合年增长率将达到 7.80%。都市化、政府措施以及国内外投资等因素正在推动该地区的住宅需求。到 2030 年,预计印度将有超过 40% 的人口居住在都市区,这将需要约 2,500 万套额外的经济适用住宅。预计需求激增将推动全球住宅防水解决方案市场规模从 2023 年的 57 亿美元增长至 2030 年的 96 亿美元,从而确保预测期内的市场成长。
亚太地区和北美的快速建设活动预计将推动全球对防水解决方案的需求
- 防水解决方案在建筑物的设计和建造中发挥着至关重要的作用,是防止水侵入的关键防御措施。 2022年全球防水解决方案市场与前一年同期比较增5.15%。其中,中东和非洲地区以9.85%的增幅领先市场,紧随其后的是北美地区,增幅达6.21%。 2023年,全球防水解决方案市场预计将维持上一年的成长动能,销售量成长5.77%。
- 2022 年,亚太地区占据市场主导地位,占据 53% 的市场占有率。值得注意的是,中国、日本和印度等国家对该地区防水解决方案的需求产生了强大的影响。中国对交通基础设施的投资从 2021 年的 1,576 亿美元飙升至 2022 年的 1,656 亿美元。日本製造设施的增加以及印度透过公路、铁路和高速公路加强连通性的倡议推动了建筑业的发展,从而增加了防水解决方案的消费。
- 在防水解决方案市场的其他区域中,预计亚太地区的复合年增长率最高,为 7.50%,紧随其后的是北美,预测期内的复合年增长率为 6.73%。在政府大力资助和外国直接投资支持重大计划的情况下,该地区的住宅、基础设施和商业建设活动预计将激增,从而推动对防水解决方案的需求。
全球防水解决方案市场趋势
亚太地区大型办公大楼建设计划的激增将增加全球商业建筑的占地面积。
- 2022年,全球新建商业建筑占地面积将与前一年同期比较去年小幅成长0.15%。欧洲表现突出,增幅达 12.70%,这得益于欧洲大力推行节能办公大楼,以实现 2030 年二氧化碳排放目标。随着员工重返办公室,欧洲公司正在重新签订租约,刺激 2022 年新办公大楼建设面积达到 450 万平方英尺。预计这一势头将在 2023 年持续下去,全球成长率预计为 4.26%。
- 新冠疫情造成劳动力和材料短缺,导致商业建筑计划取消和延迟。然而,随着停工缓解和建设活动恢復,2021 年全球新增商业占地面积飙升 11.11%,其中亚太地区以 20.98% 的成长率领先。
- 展望未来,全球新增商业占地面积的复合年增长率将达到4.56%。预计亚太地区的复合年增长率将达到 5.16%,超过其他地区。这一成长背后的驱动力是中国、印度、韩国和日本商业设施建设计划的活性化。尤其北京、上海、香港、台北等中国主要城市的甲级办公室建设正在加速。此外,印度计划于 2023 年至 2025 年间在七大城市开设约 60 家购物中心,总面积约 2,325 万平方英尺。总合到 2030 年,亚太地区的这些措施将比 2022 年增加 15.6 亿平方英尺的新零售占地面积。
预计南美洲的住宅将出现最快的成长,这得益于政府加大对经济适用住宅计画的投资,这将推动全球住宅产业的发展。
- 2022年,全球新建住宅占地面积与2021年相比减少了约2.89亿平方英尺。这是由于土地稀缺、劳动力短缺以及建筑材料价格不可持续的高企造成的住宅危机。这场危机对亚太地区造成了严重影响,2022 年新占地面积与 2021 年相比下降了 5.39%。不过,2023 年的前景更加光明,预计全球新建占地面积将比 2022 年增长 3.31%,这要归功于政府投资,这些投资可以为 2030 年之前 30 亿人建造新的经济适用住宅提供资金。
- 新冠疫情造成经济放缓,导致大量住宅建设计划取消或延后,2020年全球新建占地面积较2019年下降4.79%。随着2021年限制措施的解除,住宅计划被压抑的需求得到释放,2021年全球新建占地面积较2020年增长11.22%,其中欧洲增幅最高,为18.28%,其次是南美洲,2021年较2020年增长17.36%。
- 预测期内,全球住宅新占地面积预计复合年增长率为 3.81%,其中南美洲的增长速度最快,为 4.05%。巴西的「Minha Casa Minha Vida」计画于 2023 年宣布,这是政府计划投资 19.8 亿美元为低收入家庭提供经济适用住宅的计画。
防水解决方案产业概况
防水解决方案市场分散,前五大公司占据24.75%的市场。市场的主要企业有:科顺防水科技、马贝集团、东方雨虹、西卡集团和索普瑞玛集团。
其他福利
- Excel 格式的市场预测 (ME) 表
- 3个月的分析师支持
目录
第一章执行摘要和主要发现
第二章 报告要约
第三章 引言
- 研究假设和市场定义
- 研究范围
- 调查方法
第四章 产业主要趋势
- 最终用途趋势
- 商业
- 工业/设施
- 基础设施
- 住宅
- 重大基础设施计划(目前和已宣布)
- 法律规范
- 价值炼和通路分析
第五章市场区隔
- 最终用途部门
- 商业
- 工业/设施
- 基础设施
- 住宅
- 子产品
- 化学产品
- 依技术
- 环氧型
- 聚氨酯
- 水性
- 其他技术
- 膜
- 依技术
- 冷液
- 全黏性片材
- 热液体
- 鬆铺布
- 化学产品
- 按地区
- 亚太地区
- 按国家
- 澳洲
- 中国
- 印度
- 印尼
- 日本
- 马来西亚
- 韩国
- 泰国
- 越南
- 其他亚太地区
- 欧洲
- 按国家
- 法国
- 德国
- 义大利
- 俄罗斯
- 西班牙
- 英国
- 其他欧洲国家
- 中东和非洲
- 按国家
- 沙乌地阿拉伯
- 阿拉伯聯合大公国
- 其他中东和非洲地区
- 北美洲
- 按国家
- 加拿大
- 墨西哥
- 美国
- 南美洲
- 按国家
- 阿根廷
- 巴西
- 南美洲其他地区
- 亚太地区
第六章竞争格局
- 关键策略趋势
- 市场占有率分析
- 商业状况
- 公司简介
- Ardex Group
- Fosroc, Inc.
- Keshun Waterproof Technology Co., ltd.
- MAPEI SpA
- Oriental Yuhong
- RPM International Inc.
- Saint-Gobain
- Sika AG
- Soprema
- Standard Industries Inc.
第 7 章 CEO 的关键策略问题CEO 的关键策略问题
第 8 章 附录
- 世界概况
- 概述
- 五力分析框架(产业吸引力分析)
- 全球价值链分析
- 市场动态(DRO)
- 资讯来源及延伸阅读
- 图片列表
- 关键见解
- 资料包
- 词彙表
简介目录
Product Code: 50002020
The Waterproofing Solutions Market size is estimated at 25.92 billion USD in 2024, and is expected to reach 38.44 billion USD by 2030, growing at a CAGR of 6.79% during the forecast period (2024-2030).
Leading countries' plans for construction, such as India's plan of warehousing space of around 500 million sq. ft by 2030, likely to drive the demand for waterproofing solutions
- In 2022, the global consumption of waterproofing solutions grew by 5.15% in value, driven by rising demand from the industrial and institutional and residential construction sectors. By 2023, waterproofing solutions are projected to make up approximately 28.46% of the global construction chemicals market.
- The industrial and institutional sector emerged as the largest consumer of waterproofing solutions, accounting for a 32.09% share in 2022. Investments in new industrial buildings, such as in the United States, where spending is set to hit USD 47.59 billion by 2026, are poised to fuel this growth. Globally, the new industrial floor area is expected to rise by 3.09% in 2030, with a notable surge in warehousing, like India's plan of reaching a projected 500 million sq. ft. Consequently, the demand for waterproofing solutions in this sector is projected to rise by USD 4.2 billion over the forecast period from 2023 to 2030.
- The residential sector is anticipated to be the fastest-growing consumer of waterproofing solutions, with a robust CAGR of 7.80% during the forecast period. Factors such as urbanization, government initiatives, and both foreign and domestic investments are driving the region's housing needs. By 2030, it is estimated that over 40% of India's population will reside in urban areas, creating a demand for approximately 25 million additional affordable housing units. This surge in demand is expected to propel global waterproofing solutions for the residential sector from USD 5.7 billion in 2023 to USD 9.6 billion in 2030, ensuring the market's growth over the forecast period.
Fast-paced construction activities in Asia-Pacific and North America projected to bolster the demand for waterproofing solutions globally
- Waterproofing solutions play a pivotal role in building design and construction, serving as a crucial defense against water infiltration. In 2022, the global market for waterproofing solutions witnessed a 5.15% increase in value over the previous year. Notably, the Middle East & Africa led the market, with a remarkable 9.85% surge in value, closely followed by North America, which saw a 6.21% uptick. In 2023, the global waterproofing solutions market was projected to grow by 5.77% in volume, building on the momentum of the previous year.
- In 2022, Asia-Pacific emerged as the dominant force, commanding a significant 53% market share by value. Notably, countries like China, Japan, and India exerted a strong influence on the region's demand for waterproofing solutions. China's investment in transport infrastructure surged to USD 165.6 billion in 2022, up from USD 157.6 billion in 2021. Japan's uptick in manufacturing facilities and India's push for enhanced connectivity through roads, railways, and highways fueled the construction sector, consequently driving the consumption of waterproofing solutions.
- Asia-Pacific is poised to witness the highest CAGR of 7.50% by value among other regional segments of the waterproofing solutions market, followed closely by North America, with a CAGR of 6.73% during the forecast period. With robust government funding and foreign direct investments bolstering major projects, the regions are set to witness a surge in residential, infrastructure, and commercial construction activities, thereby amplifying the demand for waterproofing solutions.
Global Waterproofing Solutions Market Trends
Asia-Pacific's surge in large-scale office building projects is set to elevate the global floor area dedicated to commercial construction
- In 2022, the global new floor area for commercial construction witnessed a modest growth of 0.15% from the previous year. Europe stood out with a significant surge of 12.70%, driven by a push for high-energy-efficient office buildings to align with its 2030 carbon emission targets. As employees returned to offices, European companies, resuming lease decisions, spurred the construction of 4.5 million square feet of new office space in 2022. This momentum is poised to persist in 2023, with a projected global growth rate of 4.26%.
- The COVID-19 pandemic caused labor and material shortages, leading to cancellations and delays in commercial construction projects. However, as lockdowns eased and construction activities resumed, the global new floor area for commercial construction surged by 11.11% in 2021, with Asia-Pacific taking the lead with a growth rate of 20.98%.
- Looking ahead, the global new floor area for commercial construction is set to achieve a CAGR of 4.56%. Asia-Pacific is anticipated to outpace other regions, with a projected CAGR of 5.16%. This growth is fueled by a flurry of commercial construction projects in China, India, South Korea, and Japan. Notably, major Chinese cities like Beijing, Shanghai, Hong Kong, and Taipei are gearing up for an uptick in Grade A office space construction. Additionally, India is set to witness the opening of approximately 60 shopping malls, spanning 23.25 million square feet, in its top seven cities between 2023 and 2025. Collectively, these endeavors across Asia-Pacific are expected to add a staggering 1.56 billion square feet to the new floor area for commercial construction by 2030, compared to 2022.
South America's estimated fastest growth in residential constructions due to increasing government investments in schemes for affordable housing to boost the global residential sector
- In 2022, the global new floor area for residential construction declined by around 289 million square feet compared to 2021. This can be attributed to the housing crisis generated due to the shortage of land, labor, and unsustainably high construction materials prices. This crisis severely impacted Asia-Pacific, where the new floor area declined 5.39% in 2022 compared to 2021. However, a more positive outlook is expected in 2023 as the global new floor area is predicted to grow by 3.31% compared to 2022, owing to government investments that can finance the construction of new affordable homes capable of accommodating 3 billion people by 2030.
- The COVID-19 pandemic caused an economic slowdown, due to which many residential construction projects got canceled or delayed, and the global new floor area declined by 4.79% in 2020 compared to 2019. As the restrictions were lifted in 2021 and pent-up demand for housing projects was released, new floor area grew 11.22% compared to 2020, with Europe having the highest growth of 18.28%, followed by South America, which rose 17.36% in 2021 compared to 2020.
- The global new floor area for residential construction is expected to register a CAGR of 3.81% during the forecast period, with South America predicted to develop at the fastest CAGR of 4.05%. Schemes and initiatives like the Minha Casa Minha Vida in Brazil announced in 2023 with a few regulatory changes, for which the government plans an investment of USD 1.98 billion to provide affordable housing units for low-income families, and the FOGAES in Chile also publicized in 2023, with an initial investment of USD 50 million, are aimed at providing mortgage loans to families for affordable housing and will encourage the construction of new residential units.
Waterproofing Solutions Industry Overview
The Waterproofing Solutions Market is fragmented, with the top five companies occupying 24.75%. The major players in this market are Keshun Waterproof Technology Co., ltd., MAPEI S.p.A., Oriental Yuhong, Sika AG and Soprema (sorted alphabetically).
Additional Benefits:
- The market estimate (ME) sheet in Excel format
- 3 months of analyst support
TABLE OF CONTENTS
1 EXECUTIVE SUMMARY & KEY FINDINGS
2 REPORT OFFERS
3 INTRODUCTION
- 3.1 Study Assumptions & Market Definition
- 3.2 Scope of the Study
- 3.3 Research Methodology
4 KEY INDUSTRY TRENDS
- 4.1 End Use Sector Trends
- 4.1.1 Commercial
- 4.1.2 Industrial and Institutional
- 4.1.3 Infrastructure
- 4.1.4 Residential
- 4.2 Major Infrastructure Projects (current And Announced)
- 4.3 Regulatory Framework
- 4.4 Value Chain & Distribution Channel Analysis
5 MARKET SEGMENTATION (includes market size, forecasts up to 2030 and analysis of growth prospects.)
- 5.1 End Use Sector
- 5.1.1 Commercial
- 5.1.2 Industrial and Institutional
- 5.1.3 Infrastructure
- 5.1.4 Residential
- 5.2 Sub Product
- 5.2.1 Chemicals
- 5.2.1.1 By Technology
- 5.2.1.1.1 Epoxy-based
- 5.2.1.1.2 Polyurethane-based
- 5.2.1.1.3 Water-based
- 5.2.1.1.4 Other Technologies
- 5.2.2 Membranes
- 5.2.2.1 By Technology
- 5.2.2.1.1 Cold Liquid Applied
- 5.2.2.1.2 Fully Adhered Sheet
- 5.2.2.1.3 Hot Liquid Applied
- 5.2.2.1.4 Loose Laid Sheet
- 5.2.1 Chemicals
- 5.3 Region
- 5.3.1 Asia-Pacific
- 5.3.1.1 By Country
- 5.3.1.1.1 Australia
- 5.3.1.1.2 China
- 5.3.1.1.3 India
- 5.3.1.1.4 Indonesia
- 5.3.1.1.5 Japan
- 5.3.1.1.6 Malaysia
- 5.3.1.1.7 South Korea
- 5.3.1.1.8 Thailand
- 5.3.1.1.9 Vietnam
- 5.3.1.1.10 Rest of Asia-Pacific
- 5.3.2 Europe
- 5.3.2.1 By Country
- 5.3.2.1.1 France
- 5.3.2.1.2 Germany
- 5.3.2.1.3 Italy
- 5.3.2.1.4 Russia
- 5.3.2.1.5 Spain
- 5.3.2.1.6 United Kingdom
- 5.3.2.1.7 Rest of Europe
- 5.3.3 Middle East and Africa
- 5.3.3.1 By Country
- 5.3.3.1.1 Saudi Arabia
- 5.3.3.1.2 United Arab Emirates
- 5.3.3.1.3 Rest of Middle East and Africa
- 5.3.4 North America
- 5.3.4.1 By Country
- 5.3.4.1.1 Canada
- 5.3.4.1.2 Mexico
- 5.3.4.1.3 United States
- 5.3.5 South America
- 5.3.5.1 By Country
- 5.3.5.1.1 Argentina
- 5.3.5.1.2 Brazil
- 5.3.5.1.3 Rest of South America
- 5.3.1 Asia-Pacific
6 COMPETITIVE LANDSCAPE
- 6.1 Key Strategic Moves
- 6.2 Market Share Analysis
- 6.3 Company Landscape
- 6.4 Company Profiles
- 6.4.1 Ardex Group
- 6.4.2 Fosroc, Inc.
- 6.4.3 Keshun Waterproof Technology Co., ltd.
- 6.4.4 MAPEI S.p.A.
- 6.4.5 Oriental Yuhong
- 6.4.6 RPM International Inc.
- 6.4.7 Saint-Gobain
- 6.4.8 Sika AG
- 6.4.9 Soprema
- 6.4.10 Standard Industries Inc.
7 KEY STRATEGIC QUESTIONS FOR CONCRETE, MORTARS AND CONSTRUCTION CHEMICALS CEOS
8 APPENDIX
- 8.1 Global Overview
- 8.1.1 Overview
- 8.1.2 Porter's Five Forces Framework (Industry Attractiveness Analysis)
- 8.1.3 Global Value Chain Analysis
- 8.1.4 Market Dynamics (DROs)
- 8.2 Sources & References
- 8.3 List of Tables & Figures
- 8.4 Primary Insights
- 8.5 Data Pack
- 8.6 Glossary of Terms
02-2729-4219
+886-2-2729-4219
 2025年防水化学品全球市场报告
 全球防水系统市场研究报告-产业分析、规模、份额、成长、趋势及2025年至2033年预测
 2032 年防水包装市场预测:按类型、材料类型、技术、应用、最终用户和地区进行的全球分析2025年全球防水外加剂市场报告
 防水产品市场-全球产业规模、份额、趋势、机会和预测(细分、按产品类型、按应用、按地区、按竞争,2020-2030 年)
 亚太防水解决方案:市场占有率分析、行业趋势和成长预测(2025-2030 年)印尼防水解决方案:市场占有率分析、行业趋势和成长预测(2025-2030 年)印度防水解决方案:市场占有率分析、产业趋势与统计、成长预测(2025-2030 年)防水化学品-市场占有率分析、产业趋势与统计、成长预测(2025-2030 年)全球结晶防水市场研究报告 - 产业分析、规模、份额、成长、趋势和预测 2025 年至 2033 年
▼