


 |
市场调查报告书
商品编码
1684068
印度水泥:市场占有率分析、行业趋势和统计、成长预测(2025-2030 年)India Cement - Market Share Analysis, Industry Trends & Statistics, Growth Forecasts (2025 - 2030) |
||||||
价格
※ 本网页内容可能与最新版本有所差异。详细情况请与我们联繫。
简介目录
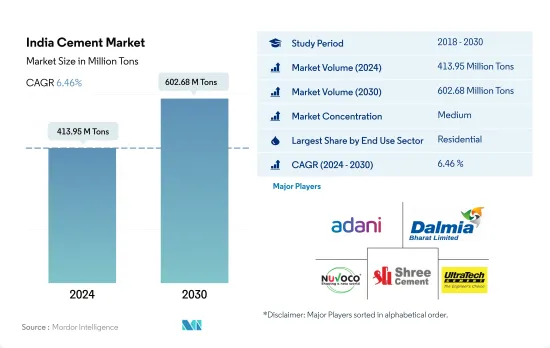
预计 2024 年印度水泥市场规模为 4.1395 亿吨,到 2030 年将达到 6.0268 亿吨,预测期内(2024-2030 年)的复合年增长率为 6.46%。
预计到 2030 年,印度甲级办公空间将达到 12 亿平方英尺,这将推动水泥需求。
- 2022年,受住宅和基础建设领域强劲需求的推动,印度水泥消费量将年增与前一年同期比较 %。到 2023 年,印度水泥市场预计将占亚太市场的 12.82% 左右。
- 2022 年,住宅领域占 60.88%,是印度最大的水泥消费领域。该国正在经历快速的都市化,加上政府措施以及国内外投资,住宅需求日益增长。预计这一趋势将导致住宅大幅增加。据预测,2023年住宅建筑占地面积将达26.6亿平方米,2030年将达32.7亿平方米。因此,预计到2030年住宅水泥市场将较2023年大幅增加1.17亿吨。
- 印度商业部门预计将成为成长最快的水泥消费领域,预测期内复合年增长率将达到 8.60%。 2023 年至 2030 年间,商业占地面积预计将增加 3.58 亿平方英尺。激增的原因是人们对购物中心、办公空间、零售店和其他商业设施的需求不断增加。例如,印度七大城市的甲级办公室市场规模预计到2026年将扩大至10亿平方英尺,2030年将进一步达到12亿平方英尺。因此,印度商业领域水泥市场规模预计将从2023年的3,932万吨激增至2030年的7,005万吨。
印度水泥市场的趋势
预计到 2030 年,印度甲级办公室市场规模将达到 12 亿平方英尺,这可能会推动商业建筑领域的需求。
- 2022 年,印度新的商业占地面积比 2021 年成长了 6.2%。零售业需求强劲,尤其是在前七大城市(德里国家首都辖区、班加罗尔、海得拉巴、孟买、普纳、清奈和加尔各答),购物中心面积超过 260 万平方英尺,比 2021 年增长 27%。展望 2023 年,由于外国直接投资 (FDI) 的激增推动了对新办公、零售和其他设施的需求,该行业的新增占地面积预计将激增 3,800 万平方英尺。尤其是,预计2023年建筑业的外国直接投资流入将达到9,600万美元。
- 2020 年,印度新建商业占地面积较 2019 年下降 68.3%。下降的主要原因是政府在全国范围内实施封锁,导致正在进行的计划暂停、供应链紧张并影响了劳动力的可用性。然而,随着 2021 年限制措施的放鬆,出现了强劲復苏,新建占地面积激增约 5.26 亿平方英尺。此外,2021 年绿建筑倡议显着增加,约有 55% 的商业计划采用了永续性,进一步刺激了该领域的需求。
- 展望 2030 年,印度新的商业占地面积预计将达到 3.58 亿平方英尺,较 2023 年大幅成长。这一增长带来了对购物中心、办公空间和其他商业设施的需求。例如,印度前七大城市的甲级办公大楼市场到 2026 年将扩大到 10 亿平方英尺,到 2030 年将进一步扩大到 12 亿平方英尺。因此,预计该国新的商业占地面积在预测期内将实现 5.26% 的强劲成长率。
住宅需求增加和房地产行业的扩张将刺激住宅行业的需求
- 2022年,印度住宅占地面积成长9.4%,高于前一年。印度住宅需求激增,前七大城市(德里国家首都辖区、班加罗尔、海得拉巴、孟买、浦那、普纳清奈和加尔各答)总合建造约 402,000 套新房,比 2021 年增加 44%。 2023 年第一季,这些城市的住宅销售量达到 114,000 套,比上年大幅增加 99,500 多套。因此,预计 2023 年印度新建住宅占地面积将比 2022 年增加约 7,100 万平方英尺。
- 2020年,印度住宅产业遭遇挫折,新屋占地面积与前一年同期比较%。下降的原因是全国范围内的封锁、供应链中断、劳动力短缺、建筑生产率放缓以及外国投资下降。不过,印度住宅房地产市场在 2021 年有所復苏,排名前七位的城市增加了约 163,000 套住宅。这一激增导致 2021 年住宅领域的新建占地面积与 2020 年相比大幅增加,达到约 6.49 亿平方英尺。
- 展望未来,预计 2023 年至 2030 年间印度住宅产业的复合年增长率将达到 2.95%。这一增长得益于持续的住宅需求、不断增加的投资和有利的政府政策。特别是到2030年,预计印度40%以上的人口将居住在都市区,这将带来约2500万套额外经济适用住宅的需求。此外,到2030年,主要城市的住宅房地产市场预计将达到150万套,这将进一步推动该产业的需求。
印度水泥业概况
印度水泥市场适度整合,前五大公司占据59.22%的市场份额。该市场的主要企业是:Adani Group、Dalmia Bharat Limited、Nuvoco Vistas Corp Ltd.、Shree Cement Limited 和 UltraTech Cement Ltd.(按字母顺序排列)。
其他福利
- Excel 格式的市场预测 (ME) 表
- 3 个月的分析师支持
目录
第 1 章执行摘要和主要发现
第二章 报告要约
第 3 章 简介
- 研究假设和市场定义
- 研究范围
- 调查方法
第四章 产业主要趋势
- 终端使用领域趋势
- 商业的
- 业/设施
- 基础设施
- 住宅
- 主要基础设施计划(目前和已宣布)
- 法律规范
- 价值链与通路分析
第 5 章。市场区隔(包括市场规模、2030 年预测、成长前景分析)
- 最终用途领域
- 商业的
- 业/设施
- 基础设施
- 住宅
- 产品
- 混合水泥
- 纤维水泥
- 普通硅酸盐水泥
- 白水泥
- 其他类型
第六章 竞争格局
- 重大策略倡议
- 市场占有率分析
- 业务状况
- 公司简介
- Adani Group
- Birla Corporation
- Dalmia Bharat Limited
- Heidelberg Materials
- India Cements Ltd.
- JK Cement Ltd.
- Nuvoco Vistas Corp Ltd.
- Ramco Cements
- Shree Cement Limited
- UltraTech Cement Ltd.
第七章:执行长的关键策略问题
第 8 章 附录
- 世界概况
- 概述
- 五力分析框架(产业吸引力分析)
- 全球价值链分析
- 市场动态(DRO)
- 资讯来源和进一步阅读
- 图片列表
- 关键见解
- 资料包
- 词彙表
简介目录
Product Code: 50002021
The India Cement Market size is estimated at 413.95 million Tons in 2024, and is expected to reach 602.68 million Tons by 2030, growing at a CAGR of 6.46% during the forecast period (2024-2030).
India's Grade A office space will reach 1.2 billion sq. f by 2030, which is likely to drive the demand for cement
- In 2022, India's cement consumption volume surged by 17.01% compared to the previous year, driven by the robust demand from the residential and infrastructure construction sectors. By 2023, India's cement market is projected to capture approximately 12.82% of the broader Asia-Pacific market.
- With a share of 60.88% in 2022, the residential sector stands as the largest consumer of cement in India. The country's increasing urbanization, coupled with government initiatives and both foreign and domestic investments, are fueling the demand for housing. This trend is expected to drive a significant uptick in residential building construction. Projections indicate that the new floor area for residential buildings will reach 2.66 billion sq. f in 2023 and is set to climb further to 3.27 billion sq. f by 2030. Consequently, the cement market for the residential sector is anticipated to witness a substantial growth of 117 million ton by 2030 compared to 2023.
- India's commercial sector is poised to emerge as the fastest-growing consumer of cement, boasting a robust CAGR of 8.60% during the forecast period. The new floor area for commercial buildings is estimated to expand by 358 million sq. f between 2023 and 2030. This surge is attributed to the escalating demand for shopping malls, office spaces, retail outlets, and other commercial establishments. For instance, India's Grade A office market in its top seven cities is projected to swell to 1 billion sq. f by 2026, further reaching 1.2 billion sq. f by 2030. Consequently, the cement market for India's commercial sector is expected to soar from 39.32 million ton in 2023 to 70.05 million ton in 2030.
India Cement Market Trends
India's Grade A office market is expected to reach 1.2 billion sq. ft by 2030 and is likely to drive the demand for the commercial construction sector
- In 2022, India's new commercial floor area saw a 6.2% volume growth compared to 2021. The retail sector, particularly in the top seven cities (Delhi NCR, Bangalore, Hyderabad, Mumbai, Pune, Chennai, and Kolkata), witnessed robust demand, adding over 2.6 million sq. ft of mall space, a 27% increase from 2021. Looking ahead to 2023, the sector's new floor area is expected to surge by 38 million sq. ft, driven by a surge in foreign direct investment (FDI) fueling the need for new offices, retail outlets, and other facilities. Notably, the FDI equity inflow for construction development in 2023 was projected to hit USD 96 million.
- In 2020, India's commercial new floor area plummeted by 68.3% in volume compared to 2019. This decline was primarily due to a nationwide lockdown imposed by the government, which disrupted ongoing projects, strained supply chains, and impacted labor availability. However, as restrictions eased in 2021, the country witnessed a significant rebound, with the new floor area surging by approximately 526 million sq. ft. Additionally, 2021 saw a notable uptick in green building initiatives, with around 55% of commercial projects embracing sustainability, further bolstering the demand for the sector.
- Looking ahead to 2030, India's commercial new floor area is projected to hit 358 million sq. ft, a significant jump from 2023. This surge drives a growing appetite for shopping malls, office spaces, and other commercial facilities. For instance, India's Grade A office market in the top seven cities is set to expand to 1 billion sq. ft by 2026 and further to 1.2 billion sq. ft by 2030. Consequently, the country's commercial new floor area is poised to witness a robust CAGR of 5.26% during the forecast period.
Rise in demand for housing units and increasing real estate sector to boost residential sector demand
- In 2022, India witnessed a 9.4% growth in residential floor area, outpacing the previous year. The demand for housing in the country surged, with the top seven cities (Delhi NCR, Bangalore, Hyderabad, Mumbai, Pune, Chennai, and Kolkata) collectively adding approximately 402,000 new units, marking a 44% increase from 2021. In Q1 2023, housing sales in these cities reached 1.14 lakh units, a staggering jump of over 99,500 units from the previous year. Consequently, it was projected that the residential new floor area in India would expand by approximately 71 million sq. ft in 2023 compared to 2022.
- In 2020, the residential sector in India faced a setback, witnessing a 6.25% decline in new floor area compared to the previous year. This decline was attributed to the nationwide lockdown, disruptions in the supply chain, labor shortages, reduced construction productivity, and a dip in foreign investments. However, in 2021, the Indian residential real estate market rebounded, adding around 163,000 new residential units across the top seven cities. This surge translated into a significant increase of about 649 million sq. ft in the residential sector's new floor area in 2021 compared to 2020.
- Looking ahead, the residential sector in India is poised to exhibit a CAGR of 2.95% in terms of volume from 2023 to 2030. This growth can be attributed to sustained housing demand, increased investments, and favorable government policies. Notably, by 2030, it is projected that over 40% of India's population will reside in urban areas, driving a demand for approximately 25 million additional affordable housing units. Furthermore, by 2030, the residential real estate market is expected to hit 1.5 million units in key cities, further fueling the demand in the sector.
India Cement Industry Overview
The India Cement Market is moderately consolidated, with the top five companies occupying 59.22%. The major players in this market are Adani Group, Dalmia Bharat Limited, Nuvoco Vistas Corp Ltd., Shree Cement Limited and UltraTech Cement Ltd. (sorted alphabetically).
Additional Benefits:
- The market estimate (ME) sheet in Excel format
- 3 months of analyst support
TABLE OF CONTENTS
1 EXECUTIVE SUMMARY & KEY FINDINGS
2 REPORT OFFERS
3 INTRODUCTION
- 3.1 Study Assumptions & Market Definition
- 3.2 Scope of the Study
- 3.3 Research Methodology
4 KEY INDUSTRY TRENDS
- 4.1 End Use Sector Trends
- 4.1.1 Commercial
- 4.1.2 Industrial and Institutional
- 4.1.3 Infrastructure
- 4.1.4 Residential
- 4.2 Major Infrastructure Projects (current And Announced)
- 4.3 Regulatory Framework
- 4.4 Value Chain & Distribution Channel Analysis
5 MARKET SEGMENTATION (includes market size, forecasts up to 2030 and analysis of growth prospects.)
- 5.1 End Use Sector
- 5.1.1 Commercial
- 5.1.2 Industrial and Institutional
- 5.1.3 Infrastructure
- 5.1.4 Residential
- 5.2 Product
- 5.2.1 Blended Cement
- 5.2.2 Fiber Cement
- 5.2.3 Ordinary Portland Cement
- 5.2.4 White Cement
- 5.2.5 Other Types
6 COMPETITIVE LANDSCAPE
- 6.1 Key Strategic Moves
- 6.2 Market Share Analysis
- 6.3 Company Landscape
- 6.4 Company Profiles
- 6.4.1 Adani Group
- 6.4.2 Birla Corporation
- 6.4.3 Dalmia Bharat Limited
- 6.4.4 Heidelberg Materials
- 6.4.5 India Cements Ltd.
- 6.4.6 JK Cement Ltd.
- 6.4.7 Nuvoco Vistas Corp Ltd.
- 6.4.8 Ramco Cements
- 6.4.9 Shree Cement Limited
- 6.4.10 UltraTech Cement Ltd.
7 KEY STRATEGIC QUESTIONS FOR CONCRETE, MORTARS AND CONSTRUCTION CHEMICALS CEOS
8 APPENDIX
- 8.1 Global Overview
- 8.1.1 Overview
- 8.1.2 Porter's Five Forces Framework (Industry Attractiveness Analysis)
- 8.1.3 Global Value Chain Analysis
- 8.1.4 Market Dynamics (DROs)
- 8.2 Sources & References
- 8.3 List of Tables & Figures
- 8.4 Primary Insights
- 8.5 Data Pack
- 8.6 Glossary of Terms
02-2729-4219
+886-2-2729-4219
 2026年全球注射式水泥市场报告2026年全球磷酸钙水泥市场报告
 水泥:市场占有率分析、产业趋势与统计、成长预测(2026-2031)
 日本水泥水泥熟料市场规模、份额、趋势及预测(按类型、通路、应用、最终用途产业及地区划分),2026-2034年水泥市场规模、份额、趋势及预测(按类型、最终用途及地区划分),2026-2034年2026年全球水泥及混凝土製品市场报告2026年全球矿渣水泥市场报告
 低碳水泥和混凝土产业的成长机会
 水泥及混凝土製品市场-全球产业规模、份额、趋势、机会及预测(按类型、产品、应用、地区及竞争格局划分,2021-2031年)
 全球水泥市场:依产品类型、应用、通路和最终用户划分,2026-2032年全球预测
▼