


 |
市场调查报告书
商品编码
1684073
印尼锚固水泥浆:市场占有率分析、产业趋势与成长预测(2025-2030 年)Indonesia Anchors and Grouts - Market Share Analysis, Industry Trends & Statistics, Growth Forecasts (2025 - 2030) |
||||||
价格
※ 本网页内容可能与最新版本有所差异。详细情况请与我们联繫。
简介目录
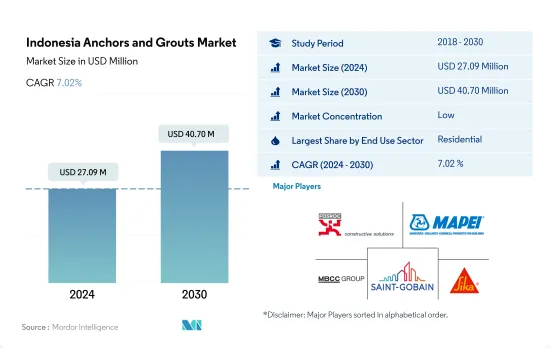
印尼锚固和水泥浆市场规模预计在 2024 年为 2,709 万美元,预计到 2030 年将达到 4,070 万美元,预测期内(2024-2030 年)的复合年增长率为 7.02%。
製造业在国民经济中的主导地位将显着促进锚固水泥浆的需求
- 2022年,市场在多个领域呈现成长,其价值将比2021年成长2.2%。 2023年,在经济扩张和外国投资的推动下,建筑业将成长。预计这种成长将推动对锚固水泥浆的需求。例如,公共工程和住宅部已设定目标,到 2023 年在努桑塔拉市建造 47 套公寓,预计需求将比 2022 年增加 6.8%。
- 锚固水泥浆的主要消费者是住宅领域,这主要是由于预製住宅的日益普及。在各种类型中,树脂固定锚栓和水泥浆是该领域的主流,2022 年的销售份额为 57%。
- 製造业在印尼经济中占据主导地位,2022 年对 GDP 的贡献率约为 18.34%,工业设施的建设活动为锚固水泥浆提供了庞大的市场。这一趋势使得工业和机构部门成为第二大消费者。由于其优异的耐化学性,环氧基锚栓和水泥浆明显优于聚氨酯基锚栓和灌浆料,到 2022 年,环氧基锚栓和灌浆料将占树脂固定类型需求的 32%。
- 受城镇人口快速成长、人均收入较低、劳动力价格低廉、中阶不断壮大以及土地成本相对较低的推动,中国製造业、教育、医疗保健和其他设施的建设显着增加。这一趋势正在吸引投资者。特别是,工业和设施部门预计在预测期内(2023-2030 年)以 8.82% 的最高复合年增长率增长。
印尼锚固和水泥浆市场趋势
预计到 2028 年,印尼商业房地产市场规模将达到 1.39 兆美元,这可能会刺激商业领域的需求
- 2022年,印尼新建商业占地面积与前一年同期比较%。这一下降是由于新冠疫情期间建筑活动下降后恢復正常所致。疫情爆发前,印尼商业建筑的年能耗强度就已呈现下降趋势,年平均下降率为2.64%。然而,2023年将出现復苏,新的商业占地面积将成长5.7%,这得益于对新的办公室、仓库和零售空间需求激增的外国直接投资(FDI)。
- 在新冠疫情期间,印尼 2020 年和 2021 年新增商业占地面积大幅增加,达到约 960 万平方英尺。政府致力于振兴经济,并采取了诸如放宽私人和公共计划建筑相关隔离措施等措施。这使得员工可以返回现场工作,企业也可以继续运作。值得注意的是,印尼2020年完工建筑量预计将达到约1.32兆印尼盾,2021年将增加至1.42兆印尼盾。
- 预计到 2030 年,印尼的新商业占地面积将比 2023 年大幅成长约 58.72%。这一增长是由于对购物中心、办公室和其他商业空间的需求不断增长。零售房地产领域已成为该国特别有吸引力的行业。例如,商业房地产市场预计到2028年将达到1.39兆美元。印尼新的商业占地面积预计将保持稳定成长,预测期内复合年增长率为6.82%。
住宅需求的增加可能会推动住宅产业的成长
- 2022 年,印尼的新住宅占地面积与 2021 年相比成长了 7.10%。这一增长是由人口增长、富裕程度提高和都市化推动的。预计到 2022 年,政府主导的住宅支持将达到 29 兆印度卢比,根据住宅融资流动性工具计划,到 2023 年将增至 32 兆印度卢比。该倡议旨在建造至少 22 万套住宅。住宅建筑业将经历显着成长。预计到 2023 年,这一数字与前一年同期比较增加至约 5,600 万平方英尺。
- 2020年,印尼新建住宅占地面积较2019年成长7.06%。这是政府的一项策略性倡议,旨在优先发展建筑业,以缓解景气衰退并支持收入减少的家庭。因此,包括隔离在内的建设活动限制已大大放宽。然而,2021年趋势逆转,住宅开工占地面积下降约12.54%。这主要是由于建筑业的外国直接投资(FDI)下降。 2021年建筑业外国直接投资与前一年同期比较减51%。
- 预测期内,印尼的新住宅占地面积预计将以 6.08% 的复合年增长率增长。这一增长归功于该国日益加快的都市化,这得益于政府倡议以及国内外投资的推动。这些因素直接或间接地加剧了该国日益增长的住宅需求,并最终促进了住宅建设。据估计,到 2030 年,每年将需要 82 万至 100 万套住宅才能满足不断增长的需求。
印尼锚固和水泥浆产业概况
印尼锚固和水泥浆市场较为分散,前五大公司占34.76%。市场的主要企业有:Fosroc, Inc.、MAPEI SpA、MBCC Group、Saint-Gobain 和 Sika AG。
其他福利
- Excel 格式的市场预测 (ME) 表
- 3个月的分析师支持
目录
第一章执行摘要和主要发现
第二章 报告要约
第三章 引言
- 研究假设和市场定义
- 研究范围
- 调查方法
第四章 产业主要趋势
- 最终用途趋势
- 商业
- 工业/设施
- 基础设施
- 住宅
- 重大基础设施计划(目前和已宣布)
- 法律规范
- 价值炼和通路分析
第五章市场区隔
- 最终用途部门
- 商业
- 工业/设施
- 基础设施
- 住宅
- 子产品
- 水泥基固定材料
- 树脂固定
- 依技术
- 环氧水泥浆
- 聚氨酯(PU)水泥浆
- 其他类型
第六章 竞争格局
- 关键策略趋势
- 市场占有率分析
- 商业状况
- 公司简介
- Arkema
- Deltacretindo
- Fosroc, Inc.
- LATICRETE International, Inc.
- MAPEI SpA
- MBCC Group
- Normet
- Saint-Gobain
- Sika AG
- Ultrachem Construction Chemicals
第 7 章 CEO 的关键策略问题CEO 的关键策略问题
第 8 章 附录
- 世界概况
- 概述
- 五力分析框架(产业吸引力分析)
- 全球价值链分析
- 市场动态(DRO)
- 资讯来源及延伸阅读
- 图片列表
- 关键见解
- 资料包
- 词彙表
简介目录
Product Code: 50002026
The Indonesia Anchors and Grouts Market size is estimated at 27.09 million USD in 2024, and is expected to reach 40.70 million USD by 2030, growing at a CAGR of 7.02% during the forecast period (2024-2030).
The manufacturing sector's domination in the national economy provides a significant boost in the demand for anchors and grouts
- In 2022, the market witnessed growth across multiple sectors, with its value surpassing that of 2021 by 2.2%. The construction sector grew in 2023, driven by economic expansion and foreign investments. This growth was expected to fuel the demand for anchors and grouts. For instance, the Ministry for Public Works and Housing set a target of constructing 47 apartment towers in Nusantara City in 2023, indicating a projected demand increase of 6.8% over 2022.
- The residential segment is the primary consumer of anchors and grouts in the country, largely due to the rising popularity of prefabricated houses, which necessitate substantial usage of anchors and grouts for installation. Among the various types, the sector predominantly favors resin fixing anchors and grouts, accounting for a significant 57% volume share in 2022.
- Given the manufacturing sector's dominant role in Indonesia's economy, contributing approximately 18.34% to the GDP in 2022, the construction activities in industrial facilities create a sizable market for anchors and grouts. This trend makes the industrial and institutional segment the second-largest consumer. The preference for epoxy-based anchors and grouts over polyurethane-based ones is evident, with epoxy variants representing 32% of the resin fixing type demand in 2022, owing to their superior chemical resistance.
- Driven by factors like a surging urban population, low per capita income, affordable labor, a burgeoning middle class, and relatively lower land costs, there is a notable uptick in the construction of facilities, including manufacturing, education, and healthcare. This trend is attracting investors. Notably, the industrial and institutional sector is projected to witness the highest CAGR of 8.82% during the forecast period (2023-2030).
Indonesia Anchors and Grouts Market Trends
Indonesian commercial real estate market volume is projected to reach USD 1.39 trillion by 2028 and is likely to augment the demand for commercial sector
- In 2022, Indonesia witnessed a 9.7% decline in the volume of new commercial floor area compared to the previous year. This drop was a result of a return to normalcy following a decline in building activities during the COVID-19 pandemic. Even before the pandemic, commercial buildings in Indonesia were already showing a downward trend in annual energy intensity, accounting for a rate of 2.64% per year. However, in 2023, the country saw a rebound, registering a 5.7% increase in the volume of new commercial floor area, driven by a surge in foreign direct investment (FDI) necessitating new offices, warehouses, and retail spaces.
- Amidst the COVID-19 pandemic, in 2020 and 2021, Indonesia witnessed a significant surge in the volume of new commercial floor area, accounting for approximately 9.6 million square feet. The government's focus on revitalizing the economy led to measures such as easing construction-related quarantines, both in private and public projects. This allowed employees to resume work on-site and companies to continue their operations. Notably, the value of completed constructions in Indonesia stood at around IDR 1.32 quadrillion in 2020 and rose to IDR 1.42 quadrillion in 2021.
- The volume of new commercial floor area in Indonesia is projected to witness a robust growth of around 58.72% by 2030 compared to 2023. This surge is driven by a rising demand for shopping malls, offices, and other commercial spaces. The retail real estate segment is emerging as a particularly captivating sector in the country. For instance, the volume of the commercial real estate market is anticipated to reach USD 1.39 trillion by 2028. The commercial new floor area in Indonesia is expected to maintain steady growth, registering a CAGR of 6.82% during the forecast period.
Increase in demand for housing units is likely to augment the residential sector's growth
- In 2022, Indonesia witnessed a 7.10% volume growth in residential new floor area compared to 2021. This surge can be attributed to increased population, wealth, and urbanization. The government-led housing aid reached IDR 29 trillion in 2022, which was projected to increase to IDR 32 trillion in 2023 under the Housing Financing Liquidity Facility scheme. This initiative aims to construct at least 220 thousand houses. The residential construction sector is poised to witness a significant growth rate. It was estimated to increase to approximately 56 million square feet in 2023 compared to the preceding year.
- In 2020, the volume of residential new floor areas in Indonesia grew by 7.06% compared to 2019. This was a strategic move by the government, prioritizing construction to mitigate the economic downturn and support households grappling with reduced incomes. Consequently, restrictions on construction activities, including quarantines, were significantly eased. However, in 2021, the trend reversed, with a decline of about 12.54% in residential new floor area, primarily attributed to a dip in foreign direct investment (FDI) in the construction sector. FDI for construction plummeted by 51% in 2021 compared to the previous year.
- The residential new floor area in Indonesia is projected to witness a CAGR of 6.08% in volume during the forecast period. This growth stems from the country's increasing urbanization, bolstered by government initiatives and foreign and domestic investments. These factors, directly and indirectly, underscore the mounting housing needs in the nation, ultimately driving residential building construction. Projections indicate that to meet the escalating demand, the country would require between 820,000 and 1 million housing units annually by 2030.
Indonesia Anchors and Grouts Industry Overview
The Indonesia Anchors and Grouts Market is fragmented, with the top five companies occupying 34.76%. The major players in this market are Fosroc, Inc., MAPEI S.p.A., MBCC Group, Saint-Gobain and Sika AG (sorted alphabetically).
Additional Benefits:
- The market estimate (ME) sheet in Excel format
- 3 months of analyst support
TABLE OF CONTENTS
1 EXECUTIVE SUMMARY & KEY FINDINGS
2 REPORT OFFERS
3 INTRODUCTION
- 3.1 Study Assumptions & Market Definition
- 3.2 Scope of the Study
- 3.3 Research Methodology
4 KEY INDUSTRY TRENDS
- 4.1 End Use Sector Trends
- 4.1.1 Commercial
- 4.1.2 Industrial and Institutional
- 4.1.3 Infrastructure
- 4.1.4 Residential
- 4.2 Major Infrastructure Projects (current And Announced)
- 4.3 Regulatory Framework
- 4.4 Value Chain & Distribution Channel Analysis
5 MARKET SEGMENTATION (includes market size, forecasts up to 2030 and analysis of growth prospects.)
- 5.1 End Use Sector
- 5.1.1 Commercial
- 5.1.2 Industrial and Institutional
- 5.1.3 Infrastructure
- 5.1.4 Residential
- 5.2 Sub Product
- 5.2.1 Cementitious Fixing
- 5.2.2 Resin Fixing
- 5.2.2.1 By Technology
- 5.2.2.1.1 Epoxy Grout
- 5.2.2.1.2 Polyurethane (PU) Grout
- 5.2.3 Other Types
6 COMPETITIVE LANDSCAPE
- 6.1 Key Strategic Moves
- 6.2 Market Share Analysis
- 6.3 Company Landscape
- 6.4 Company Profiles
- 6.4.1 Arkema
- 6.4.2 Deltacretindo
- 6.4.3 Fosroc, Inc.
- 6.4.4 LATICRETE International, Inc.
- 6.4.5 MAPEI S.p.A.
- 6.4.6 MBCC Group
- 6.4.7 Normet
- 6.4.8 Saint-Gobain
- 6.4.9 Sika AG
- 6.4.10 Ultrachem Construction Chemicals
7 KEY STRATEGIC QUESTIONS FOR CONCRETE, MORTARS AND CONSTRUCTION CHEMICALS CEOS
8 APPENDIX
- 8.1 Global Overview
- 8.1.1 Overview
- 8.1.2 Porter's Five Forces Framework (Industry Attractiveness Analysis)
- 8.1.3 Global Value Chain Analysis
- 8.1.4 Market Dynamics (DROs)
- 8.2 Sources & References
- 8.3 List of Tables & Figures
- 8.4 Primary Insights
- 8.5 Data Pack
- 8.6 Glossary of Terms
02-2729-4219
+886-2-2729-4219
 锚固水泥浆市场按产品类型、最终用途产业、分销管道和应用划分-2025-2032年全球预测
 2025年全球聚氨酯注射服务市场报告2025年环氧水泥浆全球市场报告
 全球即用型水泥浆和黏合剂市场
 水泥基灌浆料市场机会、成长动力、产业趋势分析及 2025 - 2034 年预测灌浆与锚固市场机会、成长动力、产业趋势分析及 2025 - 2034 年预测
 美国屋顶锚固市场规模、份额和趋势分析报告:按屋顶类型、最终用途和细分市场预测,2025-2033 年屋顶锚固市场规模、份额和趋势分析报告(按屋顶类型、最终用途、地区和细分市场预测,2025 年至 2033 年)
 RTU水泥浆和黏合剂市场:全球产业分析、市场规模、份额、成长、趋势和未来预测(2025-2034 年)
 水泥基水泥浆市场规模、份额、成长分析、应用、类型、最终用途、分销管道和地区 - 产业预测,2025 年至 2032 年
▼