


 |
市场调查报告书
商品编码
1683777
亚太地区锚固水泥浆:市场占有率分析、产业趋势与统计、成长预测(2025-2030 年)Asia-Pacific Anchors and Grouts - Market Share Analysis, Industry Trends & Statistics, Growth Forecasts (2025 - 2030) |
||||||
价格
※ 本网页内容可能与最新版本有所差异。详细情况请与我们联繫。
简介目录
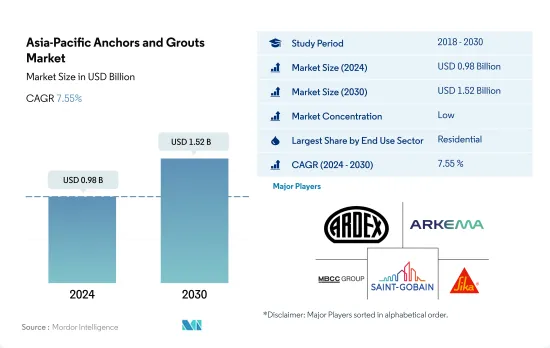
亚太地区锚固水泥浆市场规模预计在 2024 年为 9.8 亿美元,预计到 2030 年将达到 15.2 亿美元,预测期内(2024-2030 年)的复合年增长率为 7.55%。
预测期内工业和设施产业将以更快的速度成长
- 受访的 2022 年市场需求下降了 1.5%,主要是由于终端用户领域的建设活动减少。然而,预计 2023 年建筑量将恢復,导致锚固水泥浆的需求与 2022 年相比激增 5.1%。
- 由于亚太地区人口众多,住宅领域占全球锚定水泥浆市场的一半以上。尤其是到 2022 年,光是中国就将占该地区需求的 67%。需求是由这些产品的各种应用推动的,例如接缝填充、混凝土裂缝修復、结构加固等。
- 2022年,基础设施领域将成为锚定水泥浆的第二大消费领域。该地区各国政府优先发展基础设施,以促进经济发展并吸引外商投资。例如,印度2022年的基础建设支出将与前一年同期比较3.1%,符合2019年至2023年期间在基础建设计划上投资约1.4兆美元的计画。
- 预计工业和机构部门的市值将实现最高成长,预测期内(2023-2030 年)的复合年增长率为 8.82%。这一增长是由製造工厂、教育机构和医疗中心等设施建设激增所推动的。这一趋势是由城市人口的成长以及相对便宜的人事费用和土地成本的吸引力所驱动。例如,2023年,中国汽车製造商比亚迪公司宣布在越南投资电动车製造和组装。
预计日本对锚固水泥浆的需求量大。
- 锚固剂和水泥浆等建筑化学品在提高建筑物、桥樑和水坝等结构的稳定性、强度和寿命方面发挥着至关重要的作用。 2022 年亚太地区锚固水泥浆市场与 2021 年相比略有下降,下降幅度为 1.54%。中国下降幅度最大,2021 年至 2022 年锚定水泥浆市场价值暴跌 4.94%。下降的原因是政府严格的防疫政策导致建设活动关闭和停止。相比之下,澳洲则取得了令人瞩目的成长,2021 年至 2022 年的金额成长率为 18.40%。
- 2022 年,中国在该地区的锚固水泥浆市场占据主导地位,占据 65% 的显着市场占有率。基础设施投资的激增刺激了对锚固水泥浆的需求,尤其是在各个地区的建筑项目中。中国在交通基础设施方面的公共投资从 2021 年的 1,576 亿美元增加到 2022 年的 1,656 亿美元。基础建设产业成为 2021-22 年唯一实现 5.60% 正成长的终端使用产业。
- 预计预测期内日本锚固水泥浆市场将以 8.09% 的最高复合年增长率成长。这一增长将由日本的工业和机构建设部门推动,预计该部门的复合年增长率为 9.23%。 2022年至2030年间,工业和机构建筑的新占地面积预计将增加1.4亿平方英尺,随着企业将製造工厂迁至日本,需求预计会增加。预计这些因素将推动对锚固水泥浆的需求,尤其是在新生产单位的建设中。
亚太地区锚固和水泥浆市场趋势
印度及其他地区零售和办公空间不断成长,推动亚太地区商业建筑产业发展
- 2022年亚太地区新增零售占地面积与前一年同期比较3.23%。造成这项挫折的因素包括监管压力、通膨上升和抵押房屋抵押贷款利率飙升。预计到 2023 年,该地区将实现復苏,新增商业占地面积约 1.46 亿平方英尺。激增的主要原因是外国直接投资(FDI)增加,刺激了对新办公室、仓库、零售店和其他设施的需求。其中,越南建筑业预计2023年将吸引7,144万美元的外国直接投资。
- 2020 年,亚太地区新零售占地面积遭遇重大挫折,与 2019 年相比下降了 21.92%。下降的主要原因是政府大规模封锁扰乱了计划工作并严重影响了供应链、设施和劳动力。然而,随着限制措施的放鬆,该地区出现了显着的復苏,2021 年新建商业占地面积跃升 20.98%,达到约 5.26 亿占地面积。
- 预计亚太地区新建商业占地面积将大幅成长,预计 2030 年将比 2023 年增加 14.1 亿平方英尺。这一成长主要是由对购物中心、办公空间和零售店的需求不断增长所推动的。亚太地区已成为全球零售强区,贡献了全球零售成长的近四分之三。例如,印度前七大城市的甲级办公室市场到 2026 年可能会成长到 10 亿平方英尺,到 2030 年可能会成长到 12 亿平方英尺。整体而言,预测期内亚太地区新商业占地面积预计复合年增长率为 5.16%。
印度的经济适用住宅将会增加,到 2030 年可能达到 2,500 万套,该地区的住宅建设也将扩大。
- 2022年亚太地区住宅占地面积与前一年同期比较% 。在新冠疫情期间建筑活动激增之后,该行业正在逐渐恢復正常,而这一数字出现下降。人口成长、富裕程度提高和都市化快速发展推动了该地区住宅产业的发展。预计 2023 年该地区新住宅占地面积将比 2022 年增加 4.1 亿平方英尺。
- 2020年,亚太地区新建住宅占地面积较2019年减少约5.06%。这主要是由于政府封锁、供应链中断、劳动力短缺、建筑生产力放缓以及外国投资低迷。然而,随着限制措施的放鬆,该地区出现了强劲復苏,由于新建住宅增加,2021 年新住宅建筑占地面积激增约 14 亿平方英尺。例如,光是 2021 年,印度住宅房地产市场就会在前七大城市推出约 163,000 套住宅。
- 预测期内,亚太地区住宅新建占地面积预估复合年增长率为 3.98%。这一增长源于住宅需求、投资增加和政府优惠政策。重点建造更多经济适用住宅有望振兴该地区的住宅建筑业并有助于其復苏。到 2030 年,预计印度 40% 以上的人口将居住在都市区,这将需要额外 2,500 万套经济适用住宅。预计需求激增将有助于印度住宅房地产市场在 2030 年达到 150 万套。
亚太地区锚固和水泥浆产业概况
亚太地区锚固水泥浆市场较为分散,前五大公司占了21.81%的市占率。市场的主要企业是:Ardex Group、Arkema、MBCC Group、Saint-Gobain和Sika AG(按字母顺序排列)。
其他福利
- Excel 格式的市场预测 (ME) 表
- 3 个月的分析师支持
目录
第 1 章执行摘要和主要发现
第二章 报告要约
第 3 章 简介
- 研究假设和市场定义
- 研究范围
- 调查方法
第四章 产业主要趋势
- 最终用途趋势
- 商业的
- 业/设施
- 基础设施
- 住宅
- 重大基础建设计划
- 法律规范
- 价值链与通路分析
第 5 章。市场区隔(包括市场规模、2030 年预测、成长前景分析)
- 最终用途领域
- 商业的
- 业/设施
- 基础设施
- 住宅
- 子产品
- 水泥基固定材料
- 树脂固定
- 依技术分类
- 环氧水泥浆
- 聚氨酯(PU)水泥浆
- 其他类型
- 国家
- 澳洲
- 中国
- 印度
- 印尼
- 日本
- 马来西亚
- 韩国
- 泰国
- 越南
- 其他亚太地区
第六章 竞争格局
- 关键策略趋势
- 市场占有率分析
- 业务状况
- 公司简介
- Ardex Group
- Arkema
- Cemkrete Inter Co., Ltd
- Fosroc, Inc.
- LATICRETE International, Inc.
- MAPEI SpA
- MBCC Group
- RPM International Inc.
- Saint-Gobain
- Sika AG
第 7 章 CEO 需要回答的关键策略问题CEO 需要回答的关键策略问题
第 8 章 附录
- 世界概况
- 概述
- 五力分析框架(产业吸引力分析)
- 全球价值链分析
- 市场动态(DRO)
- 资讯来源和进一步阅读
- 图片列表
- 关键见解
- 资料包
- 词彙表
简介目录
Product Code: 93526
The Asia-Pacific Anchors and Grouts Market size is estimated at 0.98 billion USD in 2024, and is expected to reach 1.52 billion USD by 2030, growing at a CAGR of 7.55% during the forecast period (2024-2030).
Industrial and institutional sector to grow at a faster rate during the forecast period
- In 2022, the market studied witnessed a 1.5% decline in demand, primarily driven by a dip in construction activities across end-user sectors. However, the construction volume was projected to rebound in 2023, leading to a 5.1% surge in demand for anchors and grouts compared to 2022.
- The residential sector dominates the anchors and grouts market in Asia-Pacific, given its substantial population, accounting for over half of the global total. Notably, China alone represented 67% of the region's demand in 2022. The demand is fueled by various applications of these products, including joint filling, concrete crack repairs, and structural enhancements.
- In 2022, the infrastructure sector emerged as the second-largest consumer of anchors and grouts. Governments in the region prioritized infrastructure development to stimulate their economies and attract foreign investments. For instance, India's infrastructure spending in 2022 rose by 3.1% from the previous year, aligning with its plan to invest approximately USD 1.4 trillion in infrastructure projects between 2019 and 2023.
- During the forecast period (2023-2030), the industrial and institutional sector is projected to witness the highest growth in market value, boasting a CAGR of 8.82%. This surge can be attributed to the escalating construction of facilities like manufacturing plants, educational institutions, and healthcare centers. This trend is propelled by the expanding urban population and the appeal of relatively affordable labor and land costs. For instance, in 2023, Chinese automaker BYD Co. announced its investment in electric vehicle manufacturing and assembly in Vietnam.
High demand is forecasted for anchors and grouts in Japan as companies bring production units back home
- Construction chemicals like anchors and grouts play a crucial role in enhancing the stability, strength, and longevity of structures such as buildings, bridges, and dams. In 2022, the value of the anchors and grouts market in Asia-Pacific witnessed a slight decline of 1.54% compared to 2021. China experienced the sharpest downturn, with its anchors and grouts market value plummeting by 4.94% from 2021 to 2022. This decline can be attributed to the government's stringent zero-COVID policy, which led to lockdowns and halted construction activities. In contrast, Australia saw a remarkable upswing, registering a growth rate of 18.40% in value from 2021 to 2022.
- In 2022, China dominated the anchors and grouts market in the region, commanding a significant market share of 65% by value. The surge in infrastructure investments fueled the demand for anchors and grouts, especially in various regional construction ventures. China's public spending on transport infrastructure rose to USD 165.6 billion in 2022, up from USD 157.6 billion in 2021. The infrastructure construction segment emerged as the sole end-use sector in the country to witness a positive growth of 5.60% from 2021 to 2022.
- Japan's anchors and grouts market is projected to witness the highest CAGR of 8.09% during the forecast period. This growth can be attributed to the country's industrial and institutional construction sector, which is anticipated to witness a robust CAGR of 9.23%. There is an estimated surge of 140 million square feet in new floor area for I&I construction from 2022 to 2030, coupled with a trend of companies relocating their manufacturing facilities to Japan. These factors are expected to drive the demand for anchors and grouts, particularly in the construction of new production units.
Asia-Pacific Anchors and Grouts Market Trends
Rising retail and office spaces in countries such as India to boost the Asia-Pacific commercial construction sector
- In 2022, Asia-Pacific witnessed a 3.23% decline in its commercial new floor area compared to the previous year. This setback was attributed to factors such as regulatory pressures, higher inflation, and a surge in mortgage rates. In 2023, the region rebounded, with commercial construction new floor area increasing by approximately 146 million sq. ft. This surge was primarily driven by a rise in foreign direct investment (FDI), which spurred the demand for new offices, warehouses, retail outlets, and other facilities. Notably, the Vietnamese construction sector attracted an FDI capital of USD 71.44 million in 2023.
- In 2020, the Asia-Pacific region experienced a significant setback in commercial new floor area, with a volume decline of 21.92% compared to 2019. This decline was primarily due to widespread government lockdowns, which disrupted project work and severely impacted supply chains, equipment, and labor. However, as restrictions eased, the region witnessed a remarkable rebound, with its commercial new floor area surging by 20.98% in 2021, reaching a volume of approximately 526 million sq. ft.
- Asia-Pacific's commercial new floor area is projected to witness substantial growth, with an estimated increase of 1.41 billion sq. ft by 2030 compared to 2023. This surge is fueled by a rising demand for shopping malls, office spaces, retail outlets, and more. The Asia-Pacific region is emerging as a global retail powerhouse, contributing to nearly three-quarters of the worldwide retail growth. For instance, the Indian Grade A office market in its top seven cities may to expand to 1 billion sq. ft by 2026 and further to 1.2 billion sq. ft. by 2030. Overall, the commercial new floor area in Asia-Pacific is projected to witness a volume CAGR of 5.16% during the forecast period.
Rising affordable housing units, such as India's likely to reach 25 million by 2030, to augment the residential constructions in the region
- In 2022, the residential new floor area in the Asia-Pacific region saw a volume decline of approximately 5.39% from the previous year. This dip was a result of the sector normalizing after a surge in building activity during the COVID-19 pandemic. The region's residential sector is driven by a growing population, increasing wealth, and rapid urbanization. The residential new floor area in the region was expected to rise by 410 million sq. ft in 2023 compared to 2022.
- In 2020, the residential new floor area in Asia-Pacific declined in volume by around 5.06% compared to 2019. This was primarily due to government-imposed lockdowns, disruptions in the supply chain, labor shortages, reduced construction productivity, and low foreign investments. However, as restrictions eased, the region saw a significant rebound, with the residential new floor area surging by about 1.4 billion sq. ft in 2021, driven by the addition of new residential housing units. For instance, in 2021 alone, the Indian residential real estate market introduced approximately 163 thousand new residential units across its top seven cities.
- The residential new floor area in the Asia-Pacific region is projected to witness a CAGR of 3.98% during the forecast period. This growth can be attributed to the demand for housing, increased investments, and favorable government policies. The focus on constructing more affordable housing units is expected to rejuvenate the residential construction sector in the region, aiding its recovery. By 2030, it is estimated that over 40% of India's population will reside in urban areas, leading to a demand for an additional 25 million affordable housing units. This surge in demand is expected to push the Indian residential real estate market to reach 1.5 million units by 2030.
Asia-Pacific Anchors and Grouts Industry Overview
The Asia-Pacific Anchors and Grouts Market is fragmented, with the top five companies occupying 21.81%. The major players in this market are Ardex Group, Arkema, MBCC Group, Saint-Gobain and Sika AG (sorted alphabetically).
Additional Benefits:
- The market estimate (ME) sheet in Excel format
- 3 months of analyst support
TABLE OF CONTENTS
1 EXECUTIVE SUMMARY & KEY FINDINGS
2 REPORT OFFERS
3 INTRODUCTION
- 3.1 Study Assumptions & Market Definition
- 3.2 Scope of the Study
- 3.3 Research Methodology
4 KEY INDUSTRY TRENDS
- 4.1 End Use Sector Trends
- 4.1.1 Commercial
- 4.1.2 Industrial and Institutional
- 4.1.3 Infrastructure
- 4.1.4 Residential
- 4.2 Major Infrastructure Projects (current And Announced)
- 4.3 Regulatory Framework
- 4.4 Value Chain & Distribution Channel Analysis
5 MARKET SEGMENTATION (includes market size, forecasts up to 2030 and analysis of growth prospects.)
- 5.1 End Use Sector
- 5.1.1 Commercial
- 5.1.2 Industrial and Institutional
- 5.1.3 Infrastructure
- 5.1.4 Residential
- 5.2 Sub Product
- 5.2.1 Cementitious Fixing
- 5.2.2 Resin Fixing
- 5.2.2.1 By Technology
- 5.2.2.1.1 Epoxy Grout
- 5.2.2.1.2 Polyurethane (PU) Grout
- 5.2.3 Other Types
- 5.3 Country
- 5.3.1 Australia
- 5.3.2 China
- 5.3.3 India
- 5.3.4 Indonesia
- 5.3.5 Japan
- 5.3.6 Malaysia
- 5.3.7 South Korea
- 5.3.8 Thailand
- 5.3.9 Vietnam
- 5.3.10 Rest of Asia-Pacific
6 COMPETITIVE LANDSCAPE
- 6.1 Key Strategic Moves
- 6.2 Market Share Analysis
- 6.3 Company Landscape
- 6.4 Company Profiles
- 6.4.1 Ardex Group
- 6.4.2 Arkema
- 6.4.3 Cemkrete Inter Co., Ltd
- 6.4.4 Fosroc, Inc.
- 6.4.5 LATICRETE International, Inc.
- 6.4.6 MAPEI S.p.A.
- 6.4.7 MBCC Group
- 6.4.8 RPM International Inc.
- 6.4.9 Saint-Gobain
- 6.4.10 Sika AG
7 KEY STRATEGIC QUESTIONS FOR CONCRETE, MORTARS AND CONSTRUCTION CHEMICALS CEOS
8 APPENDIX
- 8.1 Global Overview
- 8.1.1 Overview
- 8.1.2 Porter's Five Forces Framework (Industry Attractiveness Analysis)
- 8.1.3 Global Value Chain Analysis
- 8.1.4 Market Dynamics (DROs)
- 8.2 Sources & References
- 8.3 List of Tables & Figures
- 8.4 Primary Insights
- 8.5 Data Pack
- 8.6 Glossary of Terms
02-2729-4219
+886-2-2729-4219
 锚固水泥浆市场按产品类型、最终用途产业、分销管道和应用划分-2025-2032年全球预测
 2025年全球聚氨酯注射服务市场报告2025年环氧水泥浆全球市场报告
 全球即用型水泥浆和黏合剂市场
 水泥基灌浆料市场机会、成长动力、产业趋势分析及 2025 - 2034 年预测灌浆与锚固市场机会、成长动力、产业趋势分析及 2025 - 2034 年预测
 美国屋顶锚固市场规模、份额和趋势分析报告:按屋顶类型、最终用途和细分市场预测,2025-2033 年屋顶锚固市场规模、份额和趋势分析报告(按屋顶类型、最终用途、地区和细分市场预测,2025 年至 2033 年)
 RTU水泥浆和黏合剂市场:全球产业分析、市场规模、份额、成长、趋势和未来预测(2025-2034 年)
 水泥基水泥浆市场规模、份额、成长分析、应用、类型、最终用途、分销管道和地区 - 产业预测,2025 年至 2032 年
▼