


 |
市场调查报告书
商品编码
1685737
生物农药:市场占有率分析、产业趋势与统计、成长预测(2025-2030 年)Biopesticides - Market Share Analysis, Industry Trends & Statistics, Growth Forecasts (2025 - 2030) |
||||||
※ 本网页内容可能与最新版本有所差异。详细情况请与我们联繫。
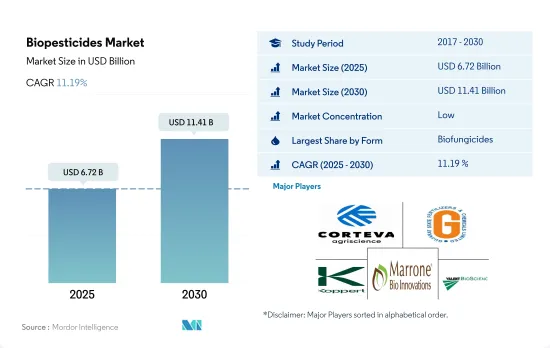
预计 2025 年生物农药市场规模为 67.2 亿美元,到 2030 年将达到 114.1 亿美元,预测期内(2025-2030 年)的复合年增长率为 11.19%。
- 生物农药由动物、植物、细菌和某些矿物质等天然来源製成。它利用自然控制机制,以环保的方式控制害虫。生物农药通常具有选择性,针对特定的害虫,从而减少对非目标物种和环境的影响。此外,生物农药一般对人类和动物毒性低,且在环境中分解迅速。
- 生物杀菌剂是最常用的生物农药。 2022年的市场占有率为47.6%。芽孢桿菌、木霉菌、链霉菌和假单胞菌是农业中商业性使用的微生物种。这些生物杀菌剂可有效对抗腐霉菌、立枯丝核菌、镰刀菌、核盘菌、串珠霉、灰霉病和白粉病等病原体。
- 2022 年,生物农药占全球生物农药市场的 27.9%。每个季节都有几种害虫会对某些作物造成毁灭性的损失,但可以使用有针对性的生物杀虫剂有效控制它们。例如,棉花是世界各地种植的重要经济作物。棉花介壳虫是一种无论在哪个地区都会影响棉花产量的害虫。苏力菌是一种具有重要商业性价值的生物杀虫剂,可以有效控制这种毁灭性的害虫,这种害虫可造成 30-90% 的产量损失。
- 生物农药在控制特定目标害虫和疾病方面具有有效性,并且不会损害环境和动物,并有望推动全球生物农药市场的发展。预计 2023 年至 2029 年期间生物农药市场的复合年增长率为 11.0%。
- 生物农药利用自然防治机制,以环保的方式控制害虫。生物农药通常具有选择性,针对特定的害虫,减少对非目标物种和环境的影响。 2022年生物农药消费最多的地区是亚太地区和北美。
- 有机农业在亚太地区正经历强劲成长,该地区拥有中国和印度等农业强国。这种成长的动力来自于对永续和健康食品的需求不断增长,以及对传统农药有害影响的认识不断提高。该地区作物种植面积从 2017 年的 310 万公顷增加到 2021 年的 360 万公顷,增加了 15.5%。
- 北美是生物农药的第二大消费地区,2021 年的份额为 38.5%。该地区对有机食品的需求正在迅速增长。 2021年北美地区有机食品人均支出为109.7美元,该地区农民正加速适应新的生物技术。永续农业的趋势预计将促进该地区生物农药的使用。
- 政府措施和当地对有机农业的推广进一步加强了这种永续发展的趋势。例如,欧盟委员会宣布了一项行动计划,到2030年将成员国有机种植面积提高到该地区农业用地面积的25.0%。秘鲁、阿根廷等南美国家政府当局已禁止使用化学农药,这推动了南美洲生物农药市场的发展。
生物农药市场的全球趋势
在北美和欧洲,由于人们认识的不断提高和政府的倡议,有机产量达到了历史最高水准。
- 有机农业已成为永续粮食系统的主要贡献者,并已在全球 187 个国家实践。截至2021年,全球有机农地面积为7,230万公顷,2018年至2021年间各地区平均成长2.9%。有机种植面积为1,440万公顷,占有机农地总面积的19.9%。
- 有机农业最强大的市场是北美和欧洲,这两个地区占世界有机种植面积的 41.0%。至2022年,欧洲有机耕地面积将为650万公顷,相当于全球有机耕地总面积的44.1%。北美和欧洲最重要的有机种植作物是苹果、草莓、谷物和橄榄。
- 亚太地区的新兴国家也正在加入有机农业运动,并在生产和供应新鲜有机农产品方面实现自给自足,以满足国内需求。有机农业趋势在亚太地区日益兴起,2017 年至 2022 年间,该地区的有机土地面积将增加 18.8%。该地区政府的主要措施也在有机农业扩张趋势中发挥了关键作用。例如,日本的食品、农业和农村基本计画旨在2030年将有机农场和有机农地的数量增加两倍。
- 有机农业在世界各地越来越受欢迎,越来越多的国家采用有机农业来实现永续的粮食体系。有机农业的成长源于人们对其益处的认识不断提高,例如促进土壤健康、减少负面环境影响和生产更健康的食品。
人均有机食品支出的成长主要出现在美国和德国,这得益于消费者对更健康、更永续食品的需求。
- 过去几年,有机食品市场经历了显着成长,全球销售额预计将从 2012 年的 708 亿美元成长到 2020 年的 1,206 亿美元。有机食品的趋势受到多种因素的推动,包括消费者对更健康、更永续的食品选择的需求不断增长,以及对传统农业对环境影响的认识不断提高。预计未来几年全球有机食品市场将持续维持成长趋势。
- 根据有机贸易协会 2021 年的一项调查,当年有机水果和蔬菜的销售额成长了约 4.5%,占有机产品总销售额的 15%。北美在有机产品平均支出方面占据市场主导地位,2021年美国的人均支出达到186.7美元,是北美国家中最高的。欧洲有机食品市场预计也将强劲成长,其中德国 2021 年的人均有机食品支出最高,达到 75.6 美元。
- 有机食品市场仍由消费者可支配收入较高的已开发国家主导,但有机食品市场在新兴国家预计也会成长。例如,亚太地区的工人阶级不断壮大,这使得有机食品更容易取得且价格更便宜,有助于扩大市场。
生物农药产业概况
生物农药市场较为分散,前五大公司占6.03%的市占率。市场的主要企业是:Corteva Agriscience、Gujarat State Fertilizers & Chemicals Ltd、Koppert Biological Systems Inc.、Marrone Bio Innovations Inc. 和 Valent Biosciences LLC(按字母顺序排列)。
其他福利
- Excel 格式的市场预测 (ME) 表
- 3 个月的分析师支持
目录
第 1 章执行摘要和主要发现
第二章 报告要约
第 3 章 简介
- 研究假设和市场定义
- 研究范围
- 调查方法
第四章 产业主要趋势
- 有机栽培面积
- 有机产品人均支出
- 法律规范
- 阿根廷
- 澳洲
- 巴西
- 加拿大
- 中国
- 埃及
- 法国
- 德国
- 印度
- 印尼
- 伊朗
- 义大利
- 日本
- 墨西哥
- 荷兰
- 奈及利亚
- 菲律宾
- 俄罗斯
- 南非
- 西班牙
- 泰国
- 土耳其
- 英国
- 美国
- 越南
- 价值链与通路分析
第五章 市场区隔
- 形式
- 生物真菌剂
- 生物除草剂
- 生物杀虫剂
- 其他生物农药
- 作物类型
- 经济作物
- 园艺作物
- 耕作作物
- 地区
- 非洲
- 按国家
- 埃及
- 奈及利亚
- 南非
- 非洲其他地区
- 亚太地区
- 按国家
- 澳洲
- 中国
- 印度
- 印尼
- 日本
- 菲律宾
- 泰国
- 越南
- 其他亚太地区
- 欧洲
- 按国家
- 法国
- 德国
- 义大利
- 荷兰
- 俄罗斯
- 西班牙
- 土耳其
- 英国
- 其他欧洲国家
- 中东
- 按国家
- 伊朗
- 沙乌地阿拉伯
- 其他中东地区
- 北美洲
- 按国家
- 加拿大
- 墨西哥
- 美国
- 北美其他地区
- 南美洲
- 按国家
- 阿根廷
- 巴西
- 南美洲其他地区
- 非洲
第六章 竞争格局
- 主要策略趋势
- 市场占有率分析
- 业务状况
- 公司简介.
- Andermatt Group AG
- Atlantica Agricola
- Biolchim SPA
- Bioworks Inc.
- Certis USA LLC
- Corteva Agriscience
- Gujarat State Fertilizers & Chemicals Ltd
- Henan Jiyuan Baiyun Industry Co. Ltd
- IPL Biologicals Limited
- Koppert Biological Systems Inc.
- Lallemand Inc.
- Marrone Bio Innovations Inc.
- Seipasa SA
- T Stanes and Company Limited
- Valent Biosciences LLC
第七章:执行长的关键策略问题
第 8 章 附录
- 世界概况
- 概述
- 五力分析框架
- 全球价值链分析
- 市场动态(DRO)
- 资讯来源和进一步阅读
- 图片列表
- 关键见解
- 资料包
- 词彙表
The Biopesticides Market size is estimated at 6.72 billion USD in 2025, and is expected to reach 11.41 billion USD by 2030, growing at a CAGR of 11.19% during the forecast period (2025-2030).
- Biopesticides are made from natural materials such as animals, plants, bacteria, and certain minerals. They are used to control pests in an environmentally friendly way by harnessing natural mechanisms of control. Biopesticides are often selective, and they target specific pests, thereby reducing the impact on non-target species and the environment. Biopesticides are also typically less toxic to humans and animals, and they break down more quickly in the environment.
- Biofungicides are the most popularly used biopesticides. They held a market share of 47.6% in 2022. Bacillus, Trichoderma, Streptomyces, and Pseudomonas are the most commercially used species of microorganisms in agriculture. These biofungicides effectively act against pathogens, such as Pythium, Rhizoctonia, Fusarium, Sclerotinia, Thielaviopsis, Botrytis, and powdery mildew.
- Bioinsecticides accounted for 27.9% of the global biopesticides market in 2022. There are several pests that cause devastating losses to specific crops in each season, which can be effectively controlled by using target-specific bioinsecticides. For instance, cotton is an important cash crop grown globally. The cotton bollworm pest affects the yield of cotton plants, irrespective of the region. Bacillus thuringiensis , a commercially important bioinsecticide, is known to effectively control this devastating pest that can cause potential yield losses of 30-90%.
- The effectiveness of biopesticides in controlling target-specific pests and diseases with no harm to the environment and animals is expected to drive the global market for biopesticides. The biopesticides market is estimated to register a CAGR of 11.0% between 2023 and 2029.
- Biopesticides are used to control pests in an eco-friendly way by harnessing natural control mechanisms. Biopesticides are often selective and target specific pests, reducing the impact on non-target species and the environment. Asia-Pacific and North America were the most biopesticides-consuming regions in 2022.
- The Asia-Pacific region, which is home to large agricultural countries like China and India, has seen significant growth in organic farming. This growth has been driven by rising demand for sustainable and healthier food options and increased awareness about the harmful effects of conventional pesticides. The organic crop area in the region increased from 3.1 million hectares in 2017 to 3.6 million hectares in 2021, representing a growth of 15.5% during the period.
- North America is the second most biopesticides-consuming region, and it had a share of 38.5% in 2021. The demand for organic food in the region is growing rapidly. The average per capita spending on organic food products in North America was recorded as USD 109.7 in 2021. Farmers of the region are adapting to new biological technologies at a faster pace. The trend toward sustainable agriculture is expected to drive the usage of biopesticides in the region.
- Government initiatives and promotion of organic farming in different regions further intensify this trend of sustainable approaches. For instance, the European Commission has unveiled an action plan to increase the organic area in the member countries to occupy 25.0% of the region's agricultural land area by 2030. Government authorities in South American countries like Peru and Argentina have banned the usage of chemical pesticides, thus driving the South American biopesticides market.
Global Biopesticides Market Trends
Organic production is at an all-time high in North America and Europe, due to the increasing awareness and Government initiatives.
- Organic agriculture has emerged as a significant contributor to sustainable food systems, with 187 countries practicing it globally. As of 2021, there was 72.3 million ha of organic agricultural land worldwide, with an average increase of 2.9% across all regions from 2018 to 2021. Organic arable land accounted for 14.4 million ha, representing 19.9% of the total organic agricultural land.
- The strongest markets for organic farming are North America and Europe, accounting for 41.0% of the global organic arable land. In 2022, Europe had 6.5 million ha of organic arable land, equivalent to 44.1% of the overall organic arable agricultural area. The most significant crops grown organically in North America and Europe are apples, strawberries, cereals, and olives.
- Developing countries in Asia-Pacific are also joining the organic agriculture movement and becoming self-sufficient in producing and providing fresh organic produce to meet their domestic demand. The trend of organic farming is gaining momentum in Asia-Pacific, with the region recording an 18.8% increase in organic arable land from 2017 to 2022. The major initiatives by governments in the region also play a vital role in the growing trend of organic farming. For example, Japan's Basic Plan for Food, Agriculture, and Rural Areas aims to triple the number of organic farmers and lands by 2030.
- Organic agriculture is becoming increasingly popular worldwide, with more countries adopting it to achieve sustainable food systems. The growth in organic agriculture is driven by the increasing awareness of the benefits of organic farming, such as promoting soil health, reducing negative environmental impacts, and producing healthier food.
Per capita spending of organic food majorly observed in United States and Germany, attributed to the consumer demand for healthier and sustainable food
- The organic food market experienced significant growth in the past few years, with global sales reaching USD 120.6 billion in 2020, up from USD 70.8 billion in 2012. The trend toward organic food is being driven by several factors, such as increasing consumer demand for healthier, more sustainable food options and a growing awareness of the environmental impact of conventional agriculture. The global organic food market is expected to continue its growth trend over the coming years.
- According to a survey conducted by the Organic Trade Association in 2021, sales of organic fruits and vegetables increased by around 4.5% in the same year, accounting for 15% of the overall organic sales. North America dominates the market in terms of average spending on organic products, with per capita spending in the United States reaching USD 186.7 in 2021, the highest among all North American countries. Europe is also expected to experience significant growth in the organic food market, with Germany accounting for the highest per capita spending of USD 75.6 in 2021.
- While the organic food market is still dominated by developed countries with high consumer disposable incomes, it is also expected to grow in developing nations. For example, the increasing number of working-class people in the Asia-Pacific region may contribute to the market's expansion due to the growing availability and affordability of organic food products.
Biopesticides Industry Overview
The Biopesticides Market is fragmented, with the top five companies occupying 6.03%. The major players in this market are Corteva Agriscience, Gujarat State Fertilizers & Chemicals Ltd, Koppert Biological Systems Inc., Marrone Bio Innovations Inc. and Valent Biosciences LLC (sorted alphabetically).
Additional Benefits:
- The market estimate (ME) sheet in Excel format
- 3 months of analyst support
TABLE OF CONTENTS
1 EXECUTIVE SUMMARY & KEY FINDINGS
2 REPORT OFFERS
3 INTRODUCTION
- 3.1 Study Assumptions & Market Definition
- 3.2 Scope of the Study
- 3.3 Research Methodology
4 KEY INDUSTRY TRENDS
- 4.1 Area Under Organic Cultivation
- 4.2 Per Capita Spending On Organic Products
- 4.3 Regulatory Framework
- 4.3.1 Argentina
- 4.3.2 Australia
- 4.3.3 Brazil
- 4.3.4 Canada
- 4.3.5 China
- 4.3.6 Egypt
- 4.3.7 France
- 4.3.8 Germany
- 4.3.9 India
- 4.3.10 Indonesia
- 4.3.11 Iran
- 4.3.12 Italy
- 4.3.13 Japan
- 4.3.14 Mexico
- 4.3.15 Netherlands
- 4.3.16 Nigeria
- 4.3.17 Philippines
- 4.3.18 Russia
- 4.3.19 South Africa
- 4.3.20 Spain
- 4.3.21 Thailand
- 4.3.22 Turkey
- 4.3.23 United Kingdom
- 4.3.24 United States
- 4.3.25 Vietnam
- 4.4 Value Chain & Distribution Channel Analysis
5 MARKET SEGMENTATION (includes market size in Value in USD and Volume, Forecasts up to 2030 and analysis of growth prospects)
- 5.1 Form
- 5.1.1 Biofungicides
- 5.1.2 Bioherbicides
- 5.1.3 Bioinsecticides
- 5.1.4 Other Biopesticides
- 5.2 Crop Type
- 5.2.1 Cash Crops
- 5.2.2 Horticultural Crops
- 5.2.3 Row Crops
- 5.3 Region
- 5.3.1 Africa
- 5.3.1.1 By Country
- 5.3.1.1.1 Egypt
- 5.3.1.1.2 Nigeria
- 5.3.1.1.3 South Africa
- 5.3.1.1.4 Rest of Africa
- 5.3.2 Asia-Pacific
- 5.3.2.1 By Country
- 5.3.2.1.1 Australia
- 5.3.2.1.2 China
- 5.3.2.1.3 India
- 5.3.2.1.4 Indonesia
- 5.3.2.1.5 Japan
- 5.3.2.1.6 Philippines
- 5.3.2.1.7 Thailand
- 5.3.2.1.8 Vietnam
- 5.3.2.1.9 Rest of Asia-Pacific
- 5.3.3 Europe
- 5.3.3.1 By Country
- 5.3.3.1.1 France
- 5.3.3.1.2 Germany
- 5.3.3.1.3 Italy
- 5.3.3.1.4 Netherlands
- 5.3.3.1.5 Russia
- 5.3.3.1.6 Spain
- 5.3.3.1.7 Turkey
- 5.3.3.1.8 United Kingdom
- 5.3.3.1.9 Rest of Europe
- 5.3.4 Middle East
- 5.3.4.1 By Country
- 5.3.4.1.1 Iran
- 5.3.4.1.2 Saudi Arabia
- 5.3.4.1.3 Rest of Middle East
- 5.3.5 North America
- 5.3.5.1 By Country
- 5.3.5.1.1 Canada
- 5.3.5.1.2 Mexico
- 5.3.5.1.3 United States
- 5.3.5.1.4 Rest of North America
- 5.3.6 South America
- 5.3.6.1 By Country
- 5.3.6.1.1 Argentina
- 5.3.6.1.2 Brazil
- 5.3.6.1.3 Rest of South America
- 5.3.1 Africa
6 COMPETITIVE LANDSCAPE
- 6.1 Key Strategic Moves
- 6.2 Market Share Analysis
- 6.3 Company Landscape
- 6.4 Company Profiles (includes Global Level Overview, Market Level Overview, Core Business Segments, Financials, Headcount, Key Information, Market Rank, Market Share, Products and Services, and Analysis of Recent Developments).
- 6.4.1 Andermatt Group AG
- 6.4.2 Atlantica Agricola
- 6.4.3 Biolchim SPA
- 6.4.4 Bioworks Inc.
- 6.4.5 Certis USA LLC
- 6.4.6 Corteva Agriscience
- 6.4.7 Gujarat State Fertilizers & Chemicals Ltd
- 6.4.8 Henan Jiyuan Baiyun Industry Co. Ltd
- 6.4.9 IPL Biologicals Limited
- 6.4.10 Koppert Biological Systems Inc.
- 6.4.11 Lallemand Inc.
- 6.4.12 Marrone Bio Innovations Inc.
- 6.4.13 Seipasa SA
- 6.4.14 T Stanes and Company Limited
- 6.4.15 Valent Biosciences LLC
7 KEY STRATEGIC QUESTIONS FOR AGRICULTURAL BIOLOGICALS CEOS
8 APPENDIX
- 8.1 Global Overview
- 8.1.1 Overview
- 8.1.2 Porter's Five Forces Framework
- 8.1.3 Global Value Chain Analysis
- 8.1.4 Market Dynamics (DROs)
- 8.2 Sources & References
- 8.3 List of Tables & Figures
- 8.4 Primary Insights
- 8.5 Data Pack
- 8.6 Glossary of Terms
 生物杀线虫剂市场规模、份额和成长分析(按类型、剂型、应用方式、作物类型、虫害类型和地区划分)-产业预测,2025-2032年
 全球生物肥料和生物农药市场:预测至2032年-按产品类型、形态、应用方法、作物类型和地区分類的分析
 生物农药市场(按类型、作物、剂型、应用和销售管道)——2025-2030 年全球预测
 2025-2033年生物农药市场报告(依产品、剂型、来源、应用方式、作物种类及地区)
 2025年全球生物农药市场报告
 生物农药市场:2025 年至 2030 年预测
 细菌生物防治剂:市场占有率分析、产业趋势、统计数据、成长预测(2025-2030 年)2032年生物农药市场预测:按产品类型、作物类型、剂型、应用、最终用户和地区进行的全球分析日本生物农药市场报告(依产品类型(生物除草剂、生物杀虫剂、生物杀菌剂等)、应用领域(作物型、非作物型)及地区划分)2025-2033
 生物农药市场规模、份额及成长分析(按类型、来源、剂型、应用类型、作物类型和地区)-2025-2032 年产业预测