


 |
市场调查报告书
商品编码
1687403
智慧电网资料分析-市场占有率分析、产业趋势与统计、成长预测(2025-2030)Smart Grid Data Analytics - Market Share Analysis, Industry Trends & Statistics, Growth Forecasts (2025 - 2030) |
||||||
※ 本网页内容可能与最新版本有所差异。详细情况请与我们联繫。
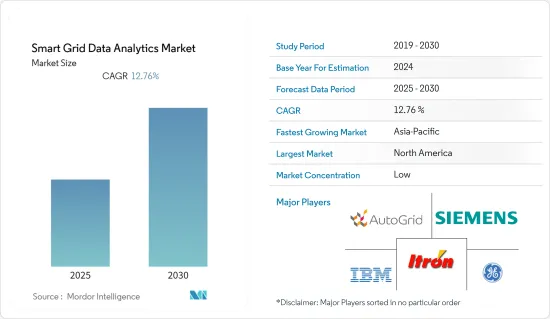
预测期内,智慧电网资料分析市场预计将以 12.76% 的复合年增长率成长
主要亮点
- 预计智慧电网资料分析市场的巨大需求将源于电力需求的不断增长。根据国际能源总署 (IEA) 的数据,到 2030 年,全球电力需求在既定政策情境 (STEPS) 下将增加 5,900兆瓦时 (TWh),在宣布的承诺情境 (APS) 下将增加 7,000 多兆瓦。这相当于美国和欧盟目前的需求总和。
- 此外,该组织还计划投资扩大、现代化和分散其电力基础设施,以提高弹性。随着时代的变化,电网基础设施变得数位化和互联化,确保关键数位通讯可靠且安全地流动。印度半岛也启动了许多计划来解决电力问题。
- 海量资料的涌入正在推动市场成长。据 IEEE 称,为了变得更加智能,电网组件和管理它们的企业系统之间正在交换大量资料。基于该应用,交换的资讯有助于经济地优化公用事业公司与其客户之间的双向电力流。
- 此外,智慧电网收集的资料比手动能源计量系统多得多。由于考虑到了更多的变量,这使我们能够使用资料分析技术来创建非常现实的消费预测。因此,可用于开发分析模型的资料量呈指数级增长,扩大了智慧电网分析的机会。
- 然而,智慧电网系统的高成本以及对更多熟练专业人员的需求正在抑制市场成长。智慧电錶最显着的限制是确保资本资金。智慧型系统比大多数服务供应商和使用者采用的标准计量设备相对昂贵。此外,不同的智慧电錶根据操作和消费者要求设计有不同的参数,从而避免使用需要技术纯熟劳工进行操作和安装的复杂设备。
- 新冠肺炎疫情对全球经济带来沉重打击,尤其对电力产业的许多企业造成了重创,并导致其他许多产业的生产停摆。自从新冠疫情爆发以来,电价下跌,给许多能源电力产业的公司带来了衝击。此外,根据美国国防安全保障部(DHS)的数据,电力产业是受新冠疫情严重影响的16个关键基础设施产业之一。
智慧电网资料分析市场趋势
加大智慧电网计划投资
- 随着对智慧电网的资金投入以及再生能源来源被添加到现有电网,全球智慧电錶分析市场预计将成长。此外,由于新兴经济体研发更新不断增加,预计市场将会成长。
- 例如,根据国际能源总署的数据,2021年输配电网路中智慧电錶的投资将达到约214亿美元,比前一年(2020年)成长13.8%。投资的大幅增加表明对数位基础设施的需求日益增长,这反过来又为在市场上运营的供应商带来了巨大的利益。
- 住宅、商业和工业领域安装率的上升是由于政府框架和政策的不断变化。包括中国和美国在内的几个新兴国家正在大规模推广智慧电錶,这主要得益于各自政府的持续支持。预计上述因素将推动对分析解决方案的需求,以处理智慧电錶产生的大量资料。
- 在美国,ConEd 和 Duke 等私人公司越来越多地使用智慧电錶。事实证明,到 2021 年,美国公用事业公司将安装约 1.11 亿个先进(智慧)计量基础设施 (AMI),占所有电錶安装量的 69% 以上。
此外,印度政府的智慧电錶国家计画(SMNP)计画在2022年6月前用新电錶取代2.5亿个旧电錶。这将改善能源消耗和监控效率,并增加Discum的年收入。这可能导致每年产生更多的资料。 2022年,中国已宣布扩大投资计划,国家电网公司将投入超过5,000亿元人民币,专注于建造特高压计划,升级配电网,提高电网数位化水准。由于这些因素,预计市场在预测期内将会成长。
亚太地区成长强劲
- 中国、日本和印度等地的人口成长正在增加对住宅基础设施和电力使用的需求。因此,支持使用智慧电网的国家对电力的需求正在增加,这可能会为智慧电网资料分析创造市场。
- 智慧城市的发展有望提高该地区的市场竞争力。韩国宣布计划向约 300 家公司投资 3.5 亿美元,以协助发展该国的物联网生态系统。三星电子和 SK 电讯合作启动一项试点项目,在首尔东南部的一个城镇建立基于物联网的可再生能源基础设施。
- 中国、印度和日本等国家的电力消耗不断增加,推动了製定高效生产、分配和消费电力的新政策的需求。根据国际能源总署的报告,过去二十年东南亚能源消费量平均每年增长约3%。根据国际能源总署的报告,过去20年东南亚能源消费量平均每年增长约3%。在现行的 STEPS 政策设定下,这一趋势预计将持续到 2030 年。
- 随着更多创新能源储存技术的使用,亚太地区的智慧电网市场可能会成长。亚太地区的能源公司现在越来越依赖智慧电网技术和基础设施发展。例如,2022年2月,光宝科技与新加坡南洋理工大学合作,打造更节能的智慧电网和智慧家庭技术。光宝新加坡是台湾家电企业光宝科技的子公司,专注于半导体研发以及智慧汽车和电力设备的开发。
- 因此,所有上述因素结合起来可能会推动智慧电网资料分析市场的发展,进而可能在预测期内推动亚太地区的智慧电网资料分析市场的发展。
智慧电网资料分析产业概况
智慧电网资料分析市场分散且竞争激烈。新兴企业不断涌现,提供各种创新解决方案以满足不同产业的需求,导致市场竞争加剧。此外,规模较大的公司被视为卓越绩效的代名词,因此有望享有竞争优势。主要企业包括西门子股份公司、Itron 公司和 IBM 公司。
2022年12月,西门子宣布计画在尼罗河Delta的达米埃塔地区提供175,000台智慧电錶和先进的配电管理系统。该订单价值超过 4000 万欧元(4,200 万美元),授予北Delta电力配送公司 (NDEDC),作为其电网现代化和改进倡议的一部分。
2022 年 9 月,Itron 将把其工业物联网 (IIoT) 网路解决方案与三星的 SmartThings 服务相结合,为公用事业公司提供改善分散式能源资源管理 (DERMS)、减少碳排放和吸引客户的系统。该伙伴关係将使用 SmartThings Energy 服务,透过 Itron 的分散式智慧 (DI) 网路提供即时能源测量和使用趋势。
其他福利:
- Excel 格式的市场预测 (ME) 表
- 3个月的分析师支持
目录
第一章 引言
- 研究假设和市场定义
- 研究范围
第二章调查方法
第三章执行摘要
第四章 市场洞察
- 市场概览
- 产业价值链分析
- 产业吸引力-波特五力分析
- 供应商的议价能力
- 消费者议价能力
- 新进入者的威胁
- 替代品的威胁
- 竞争对手之间的竞争强度
- COVID-19 市场影响评估
第五章市场动态
- 市场驱动因素
- 扩大智慧电网计划投资
- 大量资料涌入
- 市场挑战
- 智慧电网系统高成本,专业技术人员缺乏
- 监管问题、资料安全风险和技术要求可能会限制市场
第六章市场区隔
- 按部署
- 云端基础
- 本地
- 按解决方案
- 输配电 (T&D) 网络
- 计量
- 客户分析
- 按应用
- 进阶测量基础设施分析
- 需量反应分析
- 电网优化分析
- 按最终用户产业
- 私营部门(中小企业和大型企业)
- 公共部门
- 按地区
- 北美洲
- 欧洲
- 亚太地区
- 拉丁美洲
- 中东和非洲
第七章竞争格局
- 公司简介
- Siemens AG
- Itron Inc.
- AutoGrid Systems Inc.
- General Electric Company
- IBM Corporation
- SAP SE
- Tantalus System Corporation
- SAS Institute Inc.
- Hitachi Ltd
- Uplight Inc.
- Landis & Gyr Group AG
- Uptake Technologies Inc.
- Schneider Electric SE
- Oracle Corporation
- Amdocs Corporation
- Sensus USA Inc.(Xylem Inc.)
第八章投资分析
第九章 市场机会与未来趋势
The Smart Grid Data Analytics Market is expected to register a CAGR of 12.76% during the forecast period.
Key Highlights
- A big need for a smart grid data analytics market is likely to come from the growing need for electricity. According to the International Energy Agency (IEA), the world's electricity demand will rise by 5,900 terawatt-hours (TWh) in the Stated Policies Scenario (STEPS) and by over 7,000 TWh in the Announced Pledges Scenario (APS) by 2030. This is the same as adding the current demand in the United States and the European Union.
- Moreover, organizations plan to invest in the expansion, modernization, and decentralization of the electricity infrastructure for improved resiliency. The infrastructure of the power grid has been getting more digitalized and connected over time, making it possible for important digital communications to flow reliably and safely. Across the Indian subcontinent, there have also been the beginnings of a number of projects that will help people with their electricity problems.
- An enormous influx of data has been driving market growth. According to the IEEE, to enable being smart, a massive amount of data has been exchanged between grid components and the enterprise systems that manage these components. Based on the application, the information exchanged helps economically optimize the bidirectional power flow between a utility and its customers.
- Furthermore, smart grids collect much more data than the manual energy meter reading system. This permits the use of data analysis techniques and the preparation of highly realistic consumption forecasts, as many more variables are taken into account. Therefore, the opportunities for smart grid analytics have been expanding because there has been an exponential increase in the amount of data available in order to develop analytical models.
- However, the high costs of smart grid systems and the need for more skilled professionals have been restraining the market's growth. The most prominent limitation of smart metering is the availability of capital funding. Smart systems are comparatively more expensive than the standard metering equipment that most service providers and users employ. Furthermore, different smart meters have been designed with various parameters based on operational and consumer requirements, inhibiting the use of complicated equipment that needs skilled labor for handling and installation.
- The COVID-19 epidemic hurt the world economy because it hurt a lot of businesses, especially in the electricity sector, and stopped work in a lot of other sectors. After COVID-19 broke out, the price of electricity went down, which hurt a lot of companies in the energy and power industries. Additionally, according to the US Department of Homeland Security (DHS), the utility sector was one of the 16 essential infrastructure sectors that the COVID-19 epidemic severely impacted.
Smart Grid Data Analytics Market Trends
Growing Investments in Smart Grid Projects
- The global smart metering analytics market is expected to grow because more money is being spent on smart grids and more renewable energy sources are being added to existing grids. Also, R&D is being updated more in developed economies, which should help the market grow.
- For instance, according to the IEA, in 2021, investments in smart meters in transmission and distribution electricity grids were valued at around USD 21.4 billion, a 13.8% rise in investments compared to the previous year, 2020. Such a significant rise in investments may indicate the growing need for digital infrastructure, thereby providing substantial profits to the vendors operating in the market.
- The rate of installations in the residential, commercial, and industrial sectors has been going up because of how the government framework and policies are always changing.Several emerging nations, including China and the United States, have witnessed a high-scale deployment of smart meters, mainly due to the continuous support of their respective governments. The factors above are expected to drive the demand for analytic solutions to handle the vast data from these smart meters.
- Smart meters are being used more and more by private utility companies in the United States, like ConEd and Duke.This is evident by the fact that, with smart meters deployed by utilities in the United States, about 111 million advanced (smart) metering infrastructure (AMI) installations were made in 2021, accounting for over 69% of all electric meter installations.
Additionally, the government of India's national initiative for smart meters (SMNP) intends to replace 250 million outdated meters with new ones in June 2022. It would improve the effectiveness of energy consumption and monitoring and enhance discoms' yearly income. This may result in the generation of more data per year. In 2022, China announced plans to increase investment, with the State Grid Corporation of China budgeting for more than CNY 500 billion and concentrating on ultra-high-voltage projects, upgrading the distribution network, and increasing levels of digitalization of its grids. Owing to these factors, the market studied is expected to witness growth during the forecast period.
Asia-Pacific to Witness the Significant Growth Rates
- Two highly populated nations, namely India and China, significantly dominate the Asia-Pacific region.Rising populations in places like China, Japan, and India have increased the demand for residential infrastructure and electricity use. This has increased the demand for electricity in countries that support the use of smart grids, which may create a market for smart grid data analytics.
- The growth of smart cities is anticipated to increase the region's market competencies. South Korea announced plans to invest USD 350 million in around 300 companies to help develop an IoT ecosystem within the country. A pilot is being launched in a town southeast of Seoul, in partnership with Samsung Electronics and SK Telecom, to set up IoT-based infrastructure for renewable energy.
- Power consumption has increased in nations like China, India, and Japan, which has increased the demand for new policies to create, distribute, or consume electricity effectively. Smart grid technology is used a lot in China, India, Japan, Australia, South Korea, and other countries in the area.According to IEA reports, Southeast Asia's energy consumption has grown by around 3% annually over the last twenty years on average. This trend is expected to continue until 2030 with STEPS' current policy settings.
- Because more innovative energy storage technologies are being used, the market for smart grids in APAC will grow.Energy companies in APAC nowadays are increasingly dependent on smart grid technologies and infrastructure development. For instance, in February 2022, LITE-ON and NTU Singapore collaborated to create a more energy-efficient smart grid and smart home technologies. LITE-ON Singapore is a subsidiary of the Taiwanese consumer electronics business LITEON, which focuses on semiconductor R&D as well as smart vehicle and power device development.
- Therefore, all the above factors combined may fuel the smart grid data analytics market, which, in turn, may boost the smart grid data analytics market in the Asia-Pacific region during the forecast period.
Smart Grid Data Analytics Industry Overview
The smart grid data analytics market is fragmented and highly competitive in nature. Owing to the emergence of new startups offering a broad range of innovative solutions catering to diverse industry requirements, the market has been witnessing intensifying competitive rivalry. Also, as the major players have been considered synonymous with good performance, they are expected to have a competitive edge. Key players include Siemens AG, Itron Inc., and IBM Corporation, among others.
In December 2022, Siemens announced plans to provide 175,000 smart meters and an advanced distribution management system in the Damietta area of the Nile Delta. The order, valued at over EUR 40 million (USD 42 million), was given to the North Delta Electricity Distribution Company (NDEDC) as part of the grid modernization and improvement initiative.
In September 2022, Itron combined its Industrial Internet of Things (IIoT) network solution with Samsung's SmartThings services to give utilities access to a system that improves distributed energy resource management (DERMS), cuts carbon emissions, and engages customers. The partnership will use the SmartThings Energy service to give real-time energy readings and usage trends using Itron's distributed intelligence (DI) network, which the business claims has millions of linked endpoints.
Additional Benefits:
- The market estimate (ME) sheet in Excel format
- 3 months of analyst support
TABLE OF CONTENTS
1 INTRODUCTION
- 1.1 Study Assumptions and Market Definition
- 1.2 Scope of the Study
2 RESEARCH METHODOLOGY
3 EXECUTIVE SUMMARY
4 MARKET INSIGHTS
- 4.1 Market Overview
- 4.2 Industry Value Chain Analysis
- 4.3 Industry Attractiveness - Porter's Five Forces Analysis
- 4.3.1 Bargaining Power of Suppliers
- 4.3.2 Bargaining Power of Consumers
- 4.3.3 Threat of New Entrants
- 4.3.4 Threat of Substitute Products
- 4.3.5 Intensity of Competitive Rivalry
- 4.4 Assessment of the Impact of COVID-19 on the Market
5 MARKET DYNAMICS
- 5.1 Market Drivers
- 5.1.1 Growing Investments in Smart Grid Projects
- 5.1.2 Enormous Influx of Data
- 5.2 Market Challenges
- 5.2.1 High Costs of Smart Grid Systems and Lack of Skilled Professionals
- 5.2.2 Regulatory Issues, Data Security Risks, and Technical Requirements may Restrain the Market
6 MARKET SEGMENTATION
- 6.1 By Deployment
- 6.1.1 Cloud-based
- 6.1.2 On-premise
- 6.2 By Solution
- 6.2.1 Transmission and Distribution (T&D) Network
- 6.2.2 Metering
- 6.2.3 Customer Analytics
- 6.3 By Application
- 6.3.1 Advanced Metering Infrastructure Analysis
- 6.3.2 Demand Response Analysis
- 6.3.3 Grid Optimization Analysis
- 6.4 By End-user Vertical
- 6.4.1 Private Sector (SMEs and Large Enterprises)
- 6.4.2 Public Sector
- 6.5 Geography
- 6.5.1 North America
- 6.5.2 Europe
- 6.5.3 Asia-Pacific
- 6.5.4 Latin America
- 6.5.5 Middle East & Africa
7 COMPETITIVE LANDSCAPE
- 7.1 Company Profiles
- 7.1.1 Siemens AG
- 7.1.2 Itron Inc.
- 7.1.3 AutoGrid Systems Inc.
- 7.1.4 General Electric Company
- 7.1.5 IBM Corporation
- 7.1.6 SAP SE
- 7.1.7 Tantalus System Corporation
- 7.1.8 SAS Institute Inc.
- 7.1.9 Hitachi Ltd
- 7.1.10 Uplight Inc.
- 7.1.11 Landis & Gyr Group AG
- 7.1.12 Uptake Technologies Inc.
- 7.1.13 Schneider Electric SE
- 7.1.14 Oracle Corporation
- 7.1.15 Amdocs Corporation
- 7.1.16 Sensus USA Inc. (Xylem Inc.)
8 INVESTMENT ANALYSIS
9 MARKET OPPORTUNITIES AND FUTURE TRENDS
 智慧电网资料分析市场规模、份额及成长分析(按应用、部署模式、组件、解决方案和地区)- 产业预测,2025 年至 2032 年
 2025年全球电网优化解决方案市场报告
 智慧电网分析市场机会、成长动力、产业趋势分析及 2025 - 2034 年预测2025年全球智慧电网数据分析市场报告2025年全球营运优化解决方案市场报告
 智慧电网数据分析市场报告,按解决方案(输配电网路、计量、客户分析)、部署、应用、最终用途垂直领域(私营部门、公共部门)和地区,2025 年至 2033 年电网优化解决方案市场报告,按类型(软体、硬体)、应用(政府和公共部门、教育机构等)和地区,2025 年至 2033 年
 智慧电网分析市场:按服务产品、应用、部署、公共事业类型、组织规模划分 - 2025-2030 年全球预测
 全球智慧电网分析市场 2024-2031
 全球智慧电网分析市场评估:依部署类型、服务、应用、地区、机会、预测,2017-2031年