


 |
市场调查报告书
商品编码
1687725
固氮菌:市场占有率分析、产业趋势与统计、成长预测(2025-2030 年)Azotobacter - Market Share Analysis, Industry Trends & Statistics, Growth Forecasts (2025 - 2030) |
||||||
※ 本网页内容可能与最新版本有所差异。详细情况请与我们联繫。
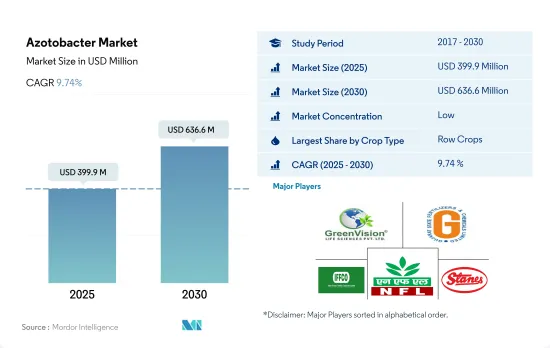
固氮菌市场规模预计在 2025 年为 3.999 亿美元,预计到 2030 年将达到 6.366 亿美元,预测期内(2025-2030 年)的复合年增长率为 9.74%。
- 固氮菌是指不依赖宿主植物,在需氧或厌氧条件下进行生物固氮的独立生存的细菌。 2022年,固氮菌生物肥料占全球生物肥料市场的11.3%。
- 过去一段时间,全球作物作物种植面积增加了 29.1%,从 2017 年的 1,110 万公顷增加到 2022 年的 1,440 万公顷。 2022 年,连续作物占有机种植面积的最大份额,为 67.5%,其次是园艺作物,占 17.5%,经济作物占 15.1%。
- 水稻、大麦、玉米、小麦、油菜籽、向日葵、大豆等主要田间作物在世界各地种植。全球固氮菌市场以作物为主,到 2022 年将占 76.9% 的市占率。固氮菌生物肥料适用于水稻、小麦、小米、棉花、番茄、高丽菜、芥菜和向日葵等非常规作物。
- 固氮菌在园艺作物中的使用正在增加,因为使用固氮菌生物肥料代替或与各种无机固氮菌结合使用可以提高各种园艺作物的果实产量。产量和果实的增加不仅是由于固氮能力,而且还由于固氮菌能够增加其他营养物质透过植物叶片从根部到花朵的转运。
- 过量施用氮肥与水体优养化、温室效应、酸雨等环境问题有关。固氮菌生物肥料可以为植物提供所需的氮,且不会过量。受这些因素的推动,全球固氮菌生物肥料市场预计在 2023-2029 年期间的复合年增长率为 9.5%。
- 氮(N)对于提高作物产量至关重要,并且可以改变作物抵御食草动物的能力。为了最大限度地提高植物产量和盈利,氮肥的施用频率要高于必要水准。固氮菌是减少氮肥施用的可行选择。
- 亚太地区是固氮菌生物肥料最大的区域市场,2022 年的市场规模为 1.382 亿美元。中国和印度是亚太地区的主要各国市场,分别占固氮菌市场份额的 99.2% 和 0.2%。中国是世界上氮肥消费量最高的国家。氮肥的使用极大地促进了中国的粮食生产,但也带来了前所未有的生物地球化学循环变化,使陆地和水生生态系统面临风险。中国的化肥政策改革将有助于减少氮肥的使用及其造成的氮污染。固氮菌生物肥料还有可能减少合成氮肥的使用。
- 在印度,根据国家油籽和油棕计画 (NMOOP),政府正在提供财政援助,包括为各种成分(如生物肥料、餵养根瘤菌培养物/磷酸盐溶解细菌/锌溶解细菌/固氮菌/菌根真菌、蚯蚓堆肥等)提供每公顷 300 印度卢比的 50% 补贴。这些因素预计将在 2023 年至 2029 年期间推动固氮菌生物肥料市场的发展。
- 北美是全球固氮菌市场第二大区域。美国和加拿大凭藉对有机农业的重视,主导了北美市场。
全球固氮菌市场趋势
在北美和欧洲,由于人们对有机农业的认识不断提高以及政府的倡议,有机农业产量达到了历史最高水准。
- 有机农业已成为永续粮食系统的主要贡献者,并在全球 187 个国家实践。截至2021年,全球有机农地面积为7,230万公顷,2018年至2021年间各地区平均成长2.9%。有机种植面积为1,440万公顷,占有机农地总面积的19.9%。
- 有机农业最强大的市场是北美和欧洲,这两个地区占世界有机种植面积的 41.0%。 2022年,欧洲将拥有650万公顷有机耕地,占总有机耕地面积的44.1%。北美和欧洲最重要的有机种植作物是苹果、草莓、谷物和橄榄。
- 亚太地区的新兴国家也正在加入有机农业运动,并在生产和供应新鲜有机农产品方面实现自给自足,以满足国内需求。有机农业趋势在亚太地区日益兴起,2017 年至 2022 年间,该地区的有机土地面积将增加 18.8%。该地区政府的主要措施也在有机农业扩张趋势中发挥了关键作用。例如,日本的食品、农业和农村基本计画旨在2030年将有机农场和有机农地的数量增加两倍。
- 有机农业的成长源于人们对其益处的认识不断提高,例如促进土壤健康、减少环境影响和生产更健康的食品。
人均有机食品支出的成长主要出现在美国和德国,这是由消费者对更健康、更永续食品的需求所推动的。
- 过去几年,有机食品市场经历了显着成长,全球销售额预计将从 2012 年的 708 亿美元成长到 2020 年的 1,206 亿美元。有机食品的趋势受到多种因素的推动,包括消费者对更健康、更永续的食品选择的需求不断增长,以及对传统农业对环境影响的认识不断提高。预计未来几年全球有机食品市场将持续维持成长趋势。
- 根据有机贸易协会 2021 年的一项调查,当年有机水果和蔬菜的销售量成长了约 4.5%,占有机产品总销量的 15%。北美在有机产品平均支出方面占据市场主导地位,2021年美国的人均支出达到186.7美元,是北美国家中最高的。欧洲有机食品市场预计也将强劲成长,其中德国 2021 年的人均有机食品支出最高,达到 75.6 美元。
- 有机食品市场仍由消费者可支配收入较高的已开发国家主导,但有机食品市场在新兴国家预计也会成长。例如,亚太地区的工人阶级不断壮大,这使得有机食品更容易取得且价格更便宜,有助于扩大市场。
固氮菌产业概况
固氮菌市场较为分散,前五大企业占14.24%。市场的主要企业是:Green Vision Life Sciences、Gujarat State Fertilizers & Chemicals Ltd、Indian Farmers Fertiliser Cooperative Limited、National Fertilizers Limited 和 T.Stanes and Company Limited(按字母顺序排列)。
其他福利
- Excel 格式的市场预测 (ME) 表
- 3 个月的分析师支持
目录
第 1 章执行摘要和主要发现
第二章 报告要约
第 3 章 简介
- 研究假设和市场定义
- 研究范围
- 调查方法
第四章 产业主要趋势
- 有机栽培面积
- 有机产品人均支出
- 法律规范
- 阿根廷
- 澳洲
- 巴西
- 加拿大
- 中国
- 埃及
- 法国
- 德国
- 印度
- 印尼
- 义大利
- 日本
- 墨西哥
- 荷兰
- 奈及利亚
- 菲律宾
- 俄罗斯
- 南非
- 西班牙
- 泰国
- 土耳其
- 英国
- 美国
- 越南
- 价值链与通路分析
第五章 市场区隔
- 作物类型
- 经济作物
- 园艺作物
- 耕作作物
- 地区
- 非洲
- 按国家
- 埃及
- 奈及利亚
- 南非
- 非洲其他地区
- 亚太地区
- 按国家
- 澳洲
- 中国
- 印度
- 印尼
- 日本
- 菲律宾
- 泰国
- 越南
- 其他亚太地区
- 欧洲
- 按国家
- 法国
- 德国
- 义大利
- 荷兰
- 俄罗斯
- 西班牙
- 土耳其
- 英国
- 其他欧洲国家
- 中东
- 按国家
- 伊朗
- 沙乌地阿拉伯
- 其他中东地区
- 北美洲
- 按国家
- 加拿大
- 墨西哥
- 美国
- 北美其他地区
- 南美洲
- 按国家
- 阿根廷
- 巴西
- 南美洲其他地区
- 非洲
第六章 竞争格局
- 主要策略趋势
- 市场占有率分析
- 业务状况
- 公司简介.
- Ezzy Bioscience Pvt. Ltd
- Green Vision Life Sciences
- Gujarat State Fertilizers & Chemicals Ltd
- Indian Farmers Fertiliser Cooperative Limited
- Indogulf BioAg LLC(Biotech Division of Indogulf Company)
- IPL Biologicals Limited
- Jaipur Bio Fertilizers
- National Fertilizers Limited
- Samriddhi Crops India Pvt. Ltd
- T.Stanes and Company Limited
第七章:执行长的关键策略问题
第 8 章 附录
- 世界概况
- 概述
- 五力分析框架
- 全球价值链分析
- 市场动态(DRO)
- 资讯来源和进一步阅读
- 图片列表
- 关键见解
- 资料包
- 词彙表
The Azotobacter Market size is estimated at 399.9 million USD in 2025, and is expected to reach 636.6 million USD by 2030, growing at a CAGR of 9.74% during the forecast period (2025-2030).
- Azotobacter refers to free-living bacteria that perform biological nitrogen fixation aerobically or anaerobically without depending on the host plants. Azotobacter biofertilizers accounted for an 11.3% share of the global biofertilizers market in 2022.
- The global area under organic crop cultivation increased by 29.1% during the historical period, rising from 11.1 million hectares in 2017 to 14.4 million hectares in 2022. In 2022, row crops accounted for the largest area under organic cultivation, with a 67.5% share, followed by horticulture crops and cash crops, with shares of 17.5% and 15.1%, respectively.
- Rice, barley, corn, wheat, rapeseed, sunflower, soybean, and other major field crops are grown worldwide. Row crops dominate the global Azotobacter market, accounting for 76.9% of the market in 2022. Azotobacter biofertilizers are useful for non-leguminous crops like paddy, wheat, millet, cotton, tomato, cabbage, mustard, and sunflower.
- The usage of Azotobacter in horticulture crops is increasing as the application of Azotobacter biofertilizer by replacing or in conjunction with various inorganic fertilizers is capable of increasing the fruit yield in various horticultural crops. The increase in yield and fruit set is not only attributed to its nitrogen-fixing ability but also due to Azotobacter's ability to increase the translocation of other nutrients from root to flower via plant foliage.
- Excessive nitrogen fertilizer application has been linked to environmental issues such as eutrophication, the greenhouse effect, and acid rain. Azotobacter biofertilizers can provide plants with the necessary nitrogen without overdosing them. These factors are anticipated to drive the global Azotobacter biofertilizers market to record a CAGR of 9.5% between 2023 and 2029.
- Nitrogen (N) is essential for increasing crop yields and can alter crops' ability to defend against herbivores. N-fertilizer is applied more frequently than required to maximize plant yield and economic profitability. Azotobacter is a viable option for reducing N fertilizer application.
- Asia-Pacific is the largest regional market for Azotobacter biofertilizers, accounting for a value of USD 138.2 million in 2022. China and India are the major country-wise markets in Asia-Pacific, accounting for shares of 99.2% and 0.2%, respectively, in the Azotobacter market. China has the highest nitrogen (N) fertilizer consumption rate in the world. While N fertilizer use has greatly aided China's food production, it has also resulted in unprecedented changes in biogeochemical cycles and endangered terrestrial and aquatic ecosystems. Fertilizer policy reforms in China can help reduce N fertilizer use and the resultant N pollution. Azotobacter biofertilizers also have the potential to reduce the use of synthetic N-based fertilizers.
- In India, under the National Mission on Oilseeds and Oil Palm (NMOOP), financial assistance, including a 50% subsidy to the tune of INR 300/ha, is being given for different components like biofertilizers, supply Rhizobium culture/Phosphate solubilizing bacteria/Zinc solubilizing bacteria/Azatobacter/Mycorrhiza, and vermicompost. These factors are expected to boost the market for Azotobacter biofertilizers between 2023 and 2029.
- North America is the second-largest regional segment of the global Azotobacter market. The United States and Canada dominate the North American market due to their efforts to achieve organic farming.
Global Azotobacter Market Trends
Organic production is at an all-time high in North America and Europe, due to the increasing awareness and Government initiatives.
- Organic agriculture has emerged as a significant contributor to sustainable food systems, with 187 countries practicing it globally. As of 2021, there was 72.3 million ha of organic agricultural land worldwide, with an average increase of 2.9% across all regions from 2018 to 2021. Organic arable land accounted for 14.4 million ha, representing 19.9% of the total organic agricultural land.
- The strongest markets for organic farming are North America and Europe, accounting for 41.0% of the global organic arable land. In 2022, Europe had 6.5 million ha of organic arable land, equivalent to 44.1% of the overall organic arable agricultural area. The most significant crops grown organically in North America and Europe are apples, strawberries, cereals, and olives.
- Developing countries in Asia-Pacific are also joining the organic agriculture movement and becoming self-sufficient in producing and providing fresh organic produce to meet their domestic demand. The trend of organic farming is gaining momentum in Asia-Pacific, with the region recording an 18.8% increase in organic arable land from 2017 to 2022. The major initiatives by governments in the region also play a vital role in the growing trend of organic farming. For example, Japan's Basic Plan for Food, Agriculture, and Rural Areas aims to triple the number of organic farmers and lands by 2030.
- The growth of organic agriculture is driven by the rising awareness of the benefits of organic farming, such as promoting soil health, reducing environmental impacts, and producing healthier food.
Per capita spending of organic food majorly observed in United States and Germany, attributed to the consumer demand for healthier and sustainable food
- The organic food market experienced significant growth in the past few years, with global sales reaching USD 120.6 billion in 2020, up from USD 70.8 billion in 2012. The trend toward organic food is being driven by several factors, such as increasing consumer demand for healthier, more sustainable food options and a growing awareness of the environmental impact of conventional agriculture. The global organic food market is expected to continue its growth trend over the coming years.
- According to a survey conducted by the Organic Trade Association in 2021, sales of organic fruits and vegetables increased by around 4.5% in the same year, accounting for 15% of the overall organic sales. North America dominates the market in terms of average spending on organic products, with per capita spending in the United States reaching USD 186.7 in 2021, the highest among all North American countries. Europe is also expected to experience significant growth in the organic food market, with Germany accounting for the highest per capita spending of USD 75.6 in 2021.
- While the organic food market is still dominated by developed countries with high consumer disposable incomes, it is also expected to grow in developing nations. For example, the increasing number of working-class people in the Asia-Pacific region may contribute to the market's expansion due to the growing availability and affordability of organic food products.
Azotobacter Industry Overview
The Azotobacter Market is fragmented, with the top five companies occupying 14.24%. The major players in this market are Green Vision Life Sciences, Gujarat State Fertilizers & Chemicals Ltd, Indian Farmers Fertiliser Cooperative Limited, National Fertilizers Limited and T.Stanes and Company Limited (sorted alphabetically).
Additional Benefits:
- The market estimate (ME) sheet in Excel format
- 3 months of analyst support
TABLE OF CONTENTS
1 EXECUTIVE SUMMARY & KEY FINDINGS
2 REPORT OFFERS
3 INTRODUCTION
- 3.1 Study Assumptions & Market Definition
- 3.2 Scope of the Study
- 3.3 Research Methodology
4 KEY INDUSTRY TRENDS
- 4.1 Area Under Organic Cultivation
- 4.2 Per Capita Spending On Organic Products
- 4.3 Regulatory Framework
- 4.3.1 Argentina
- 4.3.2 Australia
- 4.3.3 Brazil
- 4.3.4 Canada
- 4.3.5 China
- 4.3.6 Egypt
- 4.3.7 France
- 4.3.8 Germany
- 4.3.9 India
- 4.3.10 Indonesia
- 4.3.11 Italy
- 4.3.12 Japan
- 4.3.13 Mexico
- 4.3.14 Netherlands
- 4.3.15 Nigeria
- 4.3.16 Philippines
- 4.3.17 Russia
- 4.3.18 South Africa
- 4.3.19 Spain
- 4.3.20 Thailand
- 4.3.21 Turkey
- 4.3.22 United Kingdom
- 4.3.23 United States
- 4.3.24 Vietnam
- 4.4 Value Chain & Distribution Channel Analysis
5 MARKET SEGMENTATION (includes market size in Value in USD and Volume, Forecasts up to 2030 and analysis of growth prospects)
- 5.1 Crop Type
- 5.1.1 Cash Crops
- 5.1.2 Horticultural Crops
- 5.1.3 Row Crops
- 5.2 Region
- 5.2.1 Africa
- 5.2.1.1 By Country
- 5.2.1.1.1 Egypt
- 5.2.1.1.2 Nigeria
- 5.2.1.1.3 South Africa
- 5.2.1.1.4 Rest of Africa
- 5.2.2 Asia-Pacific
- 5.2.2.1 By Country
- 5.2.2.1.1 Australia
- 5.2.2.1.2 China
- 5.2.2.1.3 India
- 5.2.2.1.4 Indonesia
- 5.2.2.1.5 Japan
- 5.2.2.1.6 Philippines
- 5.2.2.1.7 Thailand
- 5.2.2.1.8 Vietnam
- 5.2.2.1.9 Rest of Asia-Pacific
- 5.2.3 Europe
- 5.2.3.1 By Country
- 5.2.3.1.1 France
- 5.2.3.1.2 Germany
- 5.2.3.1.3 Italy
- 5.2.3.1.4 Netherlands
- 5.2.3.1.5 Russia
- 5.2.3.1.6 Spain
- 5.2.3.1.7 Turkey
- 5.2.3.1.8 United Kingdom
- 5.2.3.1.9 Rest of Europe
- 5.2.4 Middle East
- 5.2.4.1 By Country
- 5.2.4.1.1 Iran
- 5.2.4.1.2 Saudi Arabia
- 5.2.4.1.3 Rest of Middle East
- 5.2.5 North America
- 5.2.5.1 By Country
- 5.2.5.1.1 Canada
- 5.2.5.1.2 Mexico
- 5.2.5.1.3 United States
- 5.2.5.1.4 Rest of North America
- 5.2.6 South America
- 5.2.6.1 By Country
- 5.2.6.1.1 Argentina
- 5.2.6.1.2 Brazil
- 5.2.6.1.3 Rest of South America
- 5.2.1 Africa
6 COMPETITIVE LANDSCAPE
- 6.1 Key Strategic Moves
- 6.2 Market Share Analysis
- 6.3 Company Landscape
- 6.4 Company Profiles (includes Global Level Overview, Market Level Overview, Core Business Segments, Financials, Headcount, Key Information, Market Rank, Market Share, Products and Services, and Analysis of Recent Developments).
- 6.4.1 Ezzy Bioscience Pvt. Ltd
- 6.4.2 Green Vision Life Sciences
- 6.4.3 Gujarat State Fertilizers & Chemicals Ltd
- 6.4.4 Indian Farmers Fertiliser Cooperative Limited
- 6.4.5 Indogulf BioAg LLC (Biotech Division of Indogulf Company)
- 6.4.6 IPL Biologicals Limited
- 6.4.7 Jaipur Bio Fertilizers
- 6.4.8 National Fertilizers Limited
- 6.4.9 Samriddhi Crops India Pvt. Ltd
- 6.4.10 T.Stanes and Company Limited
7 KEY STRATEGIC QUESTIONS FOR AGRICULTURAL BIOLOGICALS CEOS
8 APPENDIX
- 8.1 Global Overview
- 8.1.1 Overview
- 8.1.2 Porter's Five Forces Framework
- 8.1.3 Global Value Chain Analysis
- 8.1.4 Market Dynamics (DROs)
- 8.2 Sources & References
- 8.3 List of Tables & Figures
- 8.4 Primary Insights
- 8.5 Data Pack
- 8.6 Glossary of Terms
 自动化微生物检测系统市场:按产品类型、最终用户、技术和应用分類的全球市场预测 - 2026-2032 年微生物解决方案市场:按产品类型、製剂形式、微生物类型、应用、最终用户和分销管道划分-2026-2032年全球预测微生物材料市场:按应用、材料类型和微生物来源划分,全球预测(2026-2032年)
 快速微生物检测市场分析及预测(至2035年):类型、产品类型、服务、技术、应用、最终用户、流程、部署类型、功能与设备
 微生物控制化学品市场规模、份额和成长分析(按应用、类型、配方、最终用途和地区划分)—产业预测(2026-2033 年)
 2025年微生物鑑定方法全球市场报告鸢尾花收集器市场:按组件、按最终用户 - 2025-2030 年全球预测
 全球微生物产品市场,2024-2028
 微生物控制化学品市场规模、占有率、预测和趋势分析:按方法、按类型、按最终用途行业 - 2031年世界预计到今年
 全球微生物产品市场