


 |
市场调查报告书
商品编码
1687903
印度建筑化学品-市场占有率分析、产业趋势与统计、2025-2030 年成长预测India Construction Chemicals - Market Share Analysis, Industry Trends & Statistics, Growth Forecasts (2025 - 2030) |
||||||
价格
※ 本网页内容可能与最新版本有所差异。详细情况请与我们联繫。
简介目录
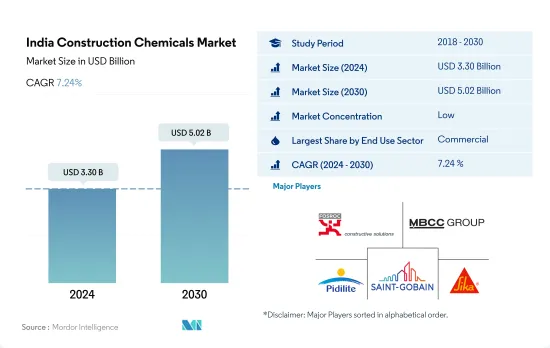
印度建筑化学品市场规模预计在 2024 年为 33 亿美元,预计到 2030 年将达到 50.2 亿美元,预测期内(2024-2030 年)的复合年增长率为 7.24%。
商业和住宅领域推动印度建筑化学品市场的成长
- 印度的建筑化学品市场是全球盈利第三大、成长率最高的市场。 2022 年,由于建设活动和多个行业支出的增加,市场规模飙升 6.97%。预计到 2023 年,得益于房地产和基础设施的强劲发展,市场将保持上升趋势,成长 6.9%。
- 作为资金来源的商业部门(无论是政府机构还是私人组织)主导着建筑化学品的需求。与住宅和其他类型的建筑相比,这种资金支持使得商业计划更容易获得建筑化学品的投资。此外,商业建筑以其高密度和复杂设计而闻名,需要更多种类的建筑化学品。
- 住宅产业紧随其后,成为建筑化学品第二大利润丰厚的产业。印度作为世界上人口最多的国家,建造了大量住宅,增加了需求和市场规模。此外,对防水解决方案的持续需求进一步增加了这一领域的重要性。
- 预计住宅和商业部门的成长速度与其他部门相同且更快,在市场估计和预测期内(2023-2030 年),复合年增长率分别为 7.9% 和 7.4%。这一增长率被认为是由政府推动住宅建设等倡议以及吸引国内外投资的友好商业环境所推动的。
印度建筑化学品市场趋势
预计到 2030 年,印度甲级办公室市场规模将达到 12 亿平方英尺,进而推动商业建筑领域的需求。
- 2022 年,印度新的商业占地面积比 2021 年增加了 6.2%。零售业需求强劲,尤其是在前七大城市(德里国家首都辖区、班加罗尔、海得拉巴、孟买、普纳、清奈和加尔各答),购物中心面积超过 260 万平方英尺,比 2021 年增长 27%。展望 2023 年,由于外国直接投资 (FDI) 的激增刺激了对新办公、零售和其他设施的需求,该行业的新占地面积预计将激增 3,800 万平方英尺。尤其是,预计2023年流入建筑业的外国直接投资将达到9,600万美元。
- 2020 年,印度新建商业占地面积较 2019 年下降了 68.3%。下降的主要原因是政府在全国范围内实施封锁,导致正在进行的计划暂停,供应链紧张,劳动力供应受到影响。然而,随着 2021 年限制措施的放宽,出现了强劲復苏,新建占地面积激增约 5.26 亿平方英尺。此外,2021 年绿建筑倡议显着增加,约 55% 的商业计划采用了永续性,进一步刺激了该领域的需求。
- 展望2030年,印度新增商业占地面积预计将达到3.58亿平方英尺,较2023年大幅成长。这一增长带来了对购物中心、办公空间和其他商业设施的需求。例如,印度七大城市的甲级办公大楼市场到 2026 年将扩大到 10 亿平方英尺,到 2030 年将进一步扩大到 12 亿平方英尺。因此,预计该国新的商业占地面积在预测期内将实现 5.26% 的强劲成长率。
住宅需求的增加和房地产行业的扩张将刺激住宅行业的需求
- 2022年,印度住宅占地面积成长9.4%,高于前一年。印度住宅需求激增,七大城市(德里国家首都辖区、班加罗尔、海得拉巴、孟买、普纳那、清奈和加尔各答)总合建造约 402,000 套新房,较 2021 年增长 44%。 2023 年第一季,这些城市的住宅销售量达到 114,000 套,比上年大幅增加 99,500 多套。因此,预计 2023 年印度新住宅占地面积将比 2022 年增加约 7,100 万平方英尺。
- 2020年,印度住宅产业遭遇挫折,新屋占地面积与前一年同期比较%。下降的原因是全国范围内的封锁、供应链中断、劳动力短缺、建筑生产率放缓以及外国投资下降。不过,印度住宅房地产市场在2021年有所復苏,前七大城新增住宅约16.3万套。这一激增导致 2021 年住宅领域新增占地面积与 2020 年相比大幅增加,达到约 6.49 亿平方英尺。
- 展望未来,预计 2023 年至 2030 年间印度住宅产业的复合年增长率将达到 2.95%。这一增长得益于持续的住宅需求、不断增加的投资以及有利的政府政策。特别是到2030年,预计印度40%以上的人口将居住在都市区,这将带来约2500万套额外经济适用住宅的需求。此外,到2030年,主要城市的住宅房地产市场预计将达到150万套,这将进一步推动该领域的需求。
印度建筑化学品产业概况
印度建筑化学品市场较为分散,前五大公司占18.71%的市占率。该市场的主要企业有:Fosroc, Inc.、MBCC Group、Pidilite Industries Ltd.、Saint-Gobain 和 Sika AG
其他福利
- Excel 格式的市场预测 (ME) 表
- 3个月的分析师支持
目录
第一章执行摘要和主要发现
第二章 报告要约
第三章 引言
- 研究假设和市场定义
- 研究范围
- 调查方法
第四章 产业主要趋势
- 最终用途细分趋势
- 商业的
- 工业/设施
- 基础设施
- 住宅
- 重大基础设施计划(目前和已宣布)
- 法律规范
- 价值炼和通路分析
第五章市场区隔
- 最终用途部分
- 商业的
- 工业/设施
- 基础设施
- 住宅
- 产品
- 胶水
- 按子产品
- 热熔胶
- 反应性
- 溶剂型
- 水性
- 锚栓和水泥浆
- 按子产品
- 水泥基固定材料
- 树脂固定
- 其他的
- 混凝土外加剂
- 按子产品
- 加速器
- 引气剂
- 高效减水剂(塑化剂)
- 阻燃剂
- 减缩剂
- 黏度调节剂
- 减水剂(塑化剂)
- 其他的
- 混凝土保护漆
- 按子产品
- 丙烯酸纤维
- 醇酸
- 环氧树脂
- 聚氨酯
- 其他的
- 地板树脂
- 按子产品
- 丙烯酸纤维
- 环氧树脂
- 聚天冬酰胺
- 聚氨酯
- 其他的
- 修復和再生化学品
- 按子产品
- 光纤缠绕系统
- 水泥浆料
- 微混凝土砂浆
- 改质砂浆
- 钢筋保护材料
- 密封材料
- 按子产品
- 丙烯酸纤维
- 环氧树脂
- 聚氨酯
- 硅胶
- 其他的
- 表面处理化学品
- 按子产品
- 硬化剂
- 脱模剂
- 其他的
- 防水解决方案
- 按子产品
- 化学产品
- 膜
- 胶水
第六章竞争格局
- 关键策略趋势
- 市场占有率分析
- 商业状况
- 公司简介
- Ardex Group
- Don Construction Products Ltd.
- ECMAS Group
- Fosroc, Inc.
- MAPEI SpA
- MBCC Group
- Pidilite Industries Ltd.
- Saint-Gobain
- Sika AG
- Thermax Limited
第七章:CEO面临的关键策略问题
第 8 章 附录
- 世界概况
- 概述
- 五力分析框架(产业吸引力分析)
- 全球价值链分析
- 市场动态(DRO)
- 资讯来源及延伸阅读
- 图片列表
- 关键见解
- 资料包
- 词彙表
简介目录
Product Code: 66762
The India Construction Chemicals Market size is estimated at 3.30 billion USD in 2024, and is expected to reach 5.02 billion USD by 2030, growing at a CAGR of 7.24% during the forecast period (2024-2030).
The commercial and residential sectors are leading the growth of the construction chemicals market in India
- India's construction chemicals market ranks third globally in profitability and is the leader in terms of growth. In 2022, the market surged by 6.97% in value, driven by increased construction activity and spending across several sectors. The market was projected to maintain its upward trajectory in 2023, with a 6.9% increase owing to robust real estate and infrastructure developments.
- The commercial sector dominates the demand for construction chemicals, given its funding sources, be it government or private entities. This financial backing makes investing in construction chemicals more accessible in commercial projects compared to residential or other building types. Moreover, commercial buildings, known for their higher densities and intricate designs, necessitate a wider range of construction chemicals.
- The residential sector follows closely as the second most lucrative sector for construction chemicals. India's status as the world's most populous nation translates into a significant number of residential buildings, driving up demand and market value. Additionally, the sector's consistent demand for waterproofing solutions further bolsters its significance.
- The market's value in the residential and commercial sectors is estimated to rise at similar and faster rates than the rest, recording CAGRs of 7.9% and 7.4% during the forecast period (2023-2030). These growth rates are estimated to be propelled by government initiatives, such as housing unit construction drives, and a business-friendly environment attracting both domestic and foreign investments.
India Construction Chemicals Market Trends
India's Grade A office market is expected to reach 1.2 billion sq. ft by 2030 and is likely to drive the demand for the commercial construction sector
- In 2022, India's new commercial floor area saw a 6.2% volume growth compared to 2021. The retail sector, particularly in the top seven cities (Delhi NCR, Bangalore, Hyderabad, Mumbai, Pune, Chennai, and Kolkata), witnessed robust demand, adding over 2.6 million sq. ft of mall space, a 27% increase from 2021. Looking ahead to 2023, the sector's new floor area is expected to surge by 38 million sq. ft, driven by a surge in foreign direct investment (FDI) fueling the need for new offices, retail outlets, and other facilities. Notably, the FDI equity inflow for construction development in 2023 was projected to hit USD 96 million.
- In 2020, India's commercial new floor area plummeted by 68.3% in volume compared to 2019. This decline was primarily due to a nationwide lockdown imposed by the government, which disrupted ongoing projects, strained supply chains, and impacted labor availability. However, as restrictions eased in 2021, the country witnessed a significant rebound, with the new floor area surging by approximately 526 million sq. ft. Additionally, 2021 saw a notable uptick in green building initiatives, with around 55% of commercial projects embracing sustainability, further bolstering the demand for the sector.
- Looking ahead to 2030, India's commercial new floor area is projected to hit 358 million sq. ft, a significant jump from 2023. This surge drives a growing appetite for shopping malls, office spaces, and other commercial facilities. For instance, India's Grade A office market in the top seven cities is set to expand to 1 billion sq. ft by 2026 and further to 1.2 billion sq. ft by 2030. Consequently, the country's commercial new floor area is poised to witness a robust CAGR of 5.26% during the forecast period.
Rise in demand for housing units and increasing real estate sector to boost residential sector demand
- In 2022, India witnessed a 9.4% growth in residential floor area, outpacing the previous year. The demand for housing in the country surged, with the top seven cities (Delhi NCR, Bangalore, Hyderabad, Mumbai, Pune, Chennai, and Kolkata) collectively adding approximately 402,000 new units, marking a 44% increase from 2021. In Q1 2023, housing sales in these cities reached 1.14 lakh units, a staggering jump of over 99,500 units from the previous year. Consequently, it was projected that the residential new floor area in India would expand by approximately 71 million sq. ft in 2023 compared to 2022.
- In 2020, the residential sector in India faced a setback, witnessing a 6.25% decline in new floor area compared to the previous year. This decline was attributed to the nationwide lockdown, disruptions in the supply chain, labor shortages, reduced construction productivity, and a dip in foreign investments. However, in 2021, the Indian residential real estate market rebounded, adding around 163,000 new residential units across the top seven cities. This surge translated into a significant increase of about 649 million sq. ft in the residential sector's new floor area in 2021 compared to 2020.
- Looking ahead, the residential sector in India is poised to exhibit a CAGR of 2.95% in terms of volume from 2023 to 2030. This growth can be attributed to sustained housing demand, increased investments, and favorable government policies. Notably, by 2030, it is projected that over 40% of India's population will reside in urban areas, driving a demand for approximately 25 million additional affordable housing units. Furthermore, by 2030, the residential real estate market is expected to hit 1.5 million units in key cities, further fueling the demand in the sector.
India Construction Chemicals Industry Overview
The India Construction Chemicals Market is fragmented, with the top five companies occupying 18.71%. The major players in this market are Fosroc, Inc., MBCC Group, Pidilite Industries Ltd., Saint-Gobain and Sika AG (sorted alphabetically).
Additional Benefits:
- The market estimate (ME) sheet in Excel format
- 3 months of analyst support
TABLE OF CONTENTS
1 EXECUTIVE SUMMARY & KEY FINDINGS
2 REPORT OFFERS
3 INTRODUCTION
- 3.1 Study Assumptions & Market Definition
- 3.2 Scope of the Study
- 3.3 Research Methodology
4 KEY INDUSTRY TRENDS
- 4.1 End Use Sector Trends
- 4.1.1 Commercial
- 4.1.2 Industrial and Institutional
- 4.1.3 Infrastructure
- 4.1.4 Residential
- 4.2 Major Infrastructure Projects (current And Announced)
- 4.3 Regulatory Framework
- 4.4 Value Chain & Distribution Channel Analysis
5 MARKET SEGMENTATION (includes market size, forecasts up to 2030 and analysis of growth prospects.)
- 5.1 End Use Sector
- 5.1.1 Commercial
- 5.1.2 Industrial and Institutional
- 5.1.3 Infrastructure
- 5.1.4 Residential
- 5.2 Product
- 5.2.1 Adhesives
- 5.2.1.1 By Sub Product
- 5.2.1.1.1 Hot Melt
- 5.2.1.1.2 Reactive
- 5.2.1.1.3 Solvent-borne
- 5.2.1.1.4 Water-borne
- 5.2.2 Anchors and Grouts
- 5.2.2.1 By Sub Product
- 5.2.2.1.1 Cementitious Fixing
- 5.2.2.1.2 Resin Fixing
- 5.2.2.1.3 Other Types
- 5.2.3 Concrete Admixtures
- 5.2.3.1 By Sub Product
- 5.2.3.1.1 Accelerator
- 5.2.3.1.2 Air Entraining Admixture
- 5.2.3.1.3 High Range Water Reducer (Super Plasticizer)
- 5.2.3.1.4 Retarder
- 5.2.3.1.5 Shrinkage Reducing Admixture
- 5.2.3.1.6 Viscosity Modifier
- 5.2.3.1.7 Water Reducer (Plasticizer)
- 5.2.3.1.8 Other Types
- 5.2.4 Concrete Protective Coatings
- 5.2.4.1 By Sub Product
- 5.2.4.1.1 Acrylic
- 5.2.4.1.2 Alkyd
- 5.2.4.1.3 Epoxy
- 5.2.4.1.4 Polyurethane
- 5.2.4.1.5 Other Resin Types
- 5.2.5 Flooring Resins
- 5.2.5.1 By Sub Product
- 5.2.5.1.1 Acrylic
- 5.2.5.1.2 Epoxy
- 5.2.5.1.3 Polyaspartic
- 5.2.5.1.4 Polyurethane
- 5.2.5.1.5 Other Resin Types
- 5.2.6 Repair and Rehabilitation Chemicals
- 5.2.6.1 By Sub Product
- 5.2.6.1.1 Fiber Wrapping Systems
- 5.2.6.1.2 Injection Grouting Materials
- 5.2.6.1.3 Micro-concrete Mortars
- 5.2.6.1.4 Modified Mortars
- 5.2.6.1.5 Rebar Protectors
- 5.2.7 Sealants
- 5.2.7.1 By Sub Product
- 5.2.7.1.1 Acrylic
- 5.2.7.1.2 Epoxy
- 5.2.7.1.3 Polyurethane
- 5.2.7.1.4 Silicone
- 5.2.7.1.5 Other Resin Types
- 5.2.8 Surface Treatment Chemicals
- 5.2.8.1 By Sub Product
- 5.2.8.1.1 Curing Compounds
- 5.2.8.1.2 Mold Release Agents
- 5.2.8.1.3 Other Product Types
- 5.2.9 Waterproofing Solutions
- 5.2.9.1 By Sub Product
- 5.2.9.1.1 Chemicals
- 5.2.9.1.2 Membranes
- 5.2.1 Adhesives
6 COMPETITIVE LANDSCAPE
- 6.1 Key Strategic Moves
- 6.2 Market Share Analysis
- 6.3 Company Landscape
- 6.4 Company Profiles
- 6.4.1 Ardex Group
- 6.4.2 Don Construction Products Ltd.
- 6.4.3 ECMAS Group
- 6.4.4 Fosroc, Inc.
- 6.4.5 MAPEI S.p.A.
- 6.4.6 MBCC Group
- 6.4.7 Pidilite Industries Ltd.
- 6.4.8 Saint-Gobain
- 6.4.9 Sika AG
- 6.4.10 Thermax Limited
7 KEY STRATEGIC QUESTIONS FOR CONCRETE, MORTARS AND CONSTRUCTION CHEMICALS CEOS
8 APPENDIX
- 8.1 Global Overview
- 8.1.1 Overview
- 8.1.2 Porter's Five Forces Framework (Industry Attractiveness Analysis)
- 8.1.3 Global Value Chain Analysis
- 8.1.4 Market Dynamics (DROs)
- 8.2 Sources & References
- 8.3 List of Tables & Figures
- 8.4 Primary Insights
- 8.5 Data Pack
- 8.6 Glossary of Terms
02-2729-4219
+886-2-2729-4219
 中东建筑化学品市场:市场占有率分析、产业趋势与统计、成长预测(2026-2031年)北美建筑化学品市场-份额分析、产业趋势与统计、成长预测(2026-2031)马来西亚建筑化学品市场-份额分析、产业趋势与统计、成长预测(2026-2031)
 混凝土裂缝填充剂市场规模、份额及成长分析(按产品类型、应用、通路和地区划分)-2026-2033年产业预测
 混凝土脱模剂市场规模、份额和趋势分析报告:按产品、应用、地区和细分市场预测(2025-2033 年)
 建筑化学品市场按产品类型、技术、形式、建筑类型、应用、最终用户和分销管道划分 - 2025-2030 年全球预测
 全球混凝土裂缝填充材市场
 2025年建筑化学品全球市场报告
 建筑化学品市场:全球产业分析、市场规模、份额、成长、趋势和未来预测(2025-2032 年)
 建筑化学品市场 - 2025-2030 年预测
▼