


 |
市场调查报告书
商品编码
1692576
亚太地区 EVA 黏合剂:市场占有率分析、产业趋势和成长预测(2025-2030 年)Asia-Pacific EVA Adhesives - Market Share Analysis, Industry Trends & Statistics, Growth Forecasts (2025 - 2030) |
||||||
价格
※ 本网页内容可能与最新版本有所差异。详细情况请与我们联繫。
简介目录
亚太地区 EVA 黏合剂市场规模预计在 2024 年为 41.2 亿美元,预计到 2028 年将达到 53.1 亿美元,预测期内(2024-2028 年)的复合年增长率为 6.52%。
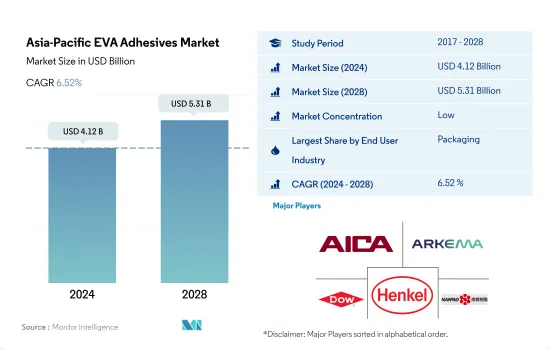
包装仍然是成长最快的最终用户,并保持其领先地位。
- EVA 黏合剂应用于各种终端用户行业,包括包装、汽车、木工和细木工以及建筑和施工。这些黏合剂能够黏合纸张、木材、塑胶、橡胶、金属和皮革等基材。 EVA 黏合剂的主要应用包括纸/纸板盒、包装和标籤、纸箱密封、组装、汽车内装和纸张加工。
- 2017年至2019年,EVA胶黏剂的需求大幅成长。韩国鞋革产业在亚太地区EVA胶合剂市场中成长率最高(27.62%)。
- 2020 年,由于营运和贸易限制、供应链限制以及 COVID-19 疫情造成的劳动力短缺等各种因素,所有终端用户行业对 EVA 黏合剂的需求均下降。鞋类皮革产业需求受创最为严重,较去年同期下降14.22%。由于2020年全球鞋类消费量与前一年同期比较下降22%,集中在亚太地区的鞋类製造商被迫减少产量。这对该行业对EVA胶粘剂的需求产生了负面影响。
- 预计该行业成长趋势将在预测期内持续下去。就数量而言,预计 2022-2028 年预测期间所有终端用户产业对 EVA 黏合剂的需求复合年增长率将达到 5.09%。包装行业由于其快速固化特性而更青睐 EVA 黏合剂,占据了需求的最大份额,预计在 2022-2028 年预测期内仍将是最大的终端用户产业。
亚太地区强大的生产能力有助于确保 EVA 黏合剂的最高需求
- 2017年至2021年,亚太地区EVA胶黏剂市场需求量在所有地区中最高。由于所有终端用户行业的生产能力都很高,该地区的黏合剂需求份额一直占全球需求的 46-47%。采用热熔技术的 EVA 树脂基黏合剂满足了该地区大部分的需求。
- 2017年至2019年期间,该地区对黏合剂的需求复合年增长率不到1%。 EVA树脂黏合剂成长放缓是由于该地区建设活动和汽车产量下降。 2018 年和 2019 年,这些终端用户产业的需求分别以 -2.4% 和 -2.25% 的复合年增长率下降。
- 2020年,营运、劳动力、原料、供应链等方面的限制导致该地区所有终端用户产业的需求减少。在该地区的所有行业中,澳洲製鞋业受到的打击最为严重,2020与前一年同期比较49.53%。国内需求下降是由于经济衰退导致的购买力下降,疫情期间该行业受到了严重影响。
- 2021 年,随着限制措施的放鬆,EVA 树脂基黏合剂的需求迅速恢復到疫情前的水平。印度市场销量增幅最高,与前一年同期比较去年同期成长8.55%。预计亚太地区的需求将会成长,预测期内复合年增长率为 4.46%。预计预测期内,该地区的建筑、包装和汽车行业将推动需求成长。
亚太地区EVA胶黏剂市场趋势
开发中国家电子商务产业快速成长带动产业扩张
- 包装主要用于保护、容纳、资讯、实用和促销。这使得包装成为大多数行业的重要组成部分。 2017年,包括纸、纸板和塑胶包装在内的包装使用量达25亿吨。 2020年,受新冠疫情影响,供应链中断、包装材料短缺、货物进出口限制、工厂开工率低等因素影响,市场出现7.4%的负成长率。
- 中国和印尼分别是第一和第二大海洋塑胶废弃物排放,亚洲各国政府正采取措施减少塑胶的使用。中国公布了有关过度包装的新规定,要求所有食品和化妆品製造商遵守具体的指导方针,根据产品比例确定允许的包装量。印尼政府的生产者延伸责任(EPR)法规要求生产者和零售商重新设计产品包装,以增加可回收材料的比例。
- 2021年,市场实现了8%的正成长,各类包装材料的使用量达到27亿吨。由于中等收入阶层的不断壮大、供应链的改善以及电子商务活动的活性化,包装行业预计将继续增长,这些因素需要专门的包装来运输货物,这在过去几年中为包装行业提供了巨大的推动力。预计不断增长的亚洲市场将推动包装的使用,使其在预测期内(2022-2028 年)的复合年增长率达到 5.7%。
电动车的普及正在推动该产业
- 由于汽车销售强劲成长,亚太地区的汽车产业是市场领先产业之一。在所有国家中,中国是最大的汽车生产国,占该地区汽车产量的57%左右,其次是日本(17%)、印度(10%)和韩国(8%)。
- 该地区的汽车销售和产量均大幅下降,影响了黏合剂的使用。 2017- 与前一年同期比较变动为-1.8%,而2018-19年度则进一步下降-6.4%。 2019-20年度,受新冠疫情影响,该地区产量再次受到负面影响,较去年同期与前一年同期比较10.2%。由于製造工厂停工和供应链中断,汽车零件短缺,生产水准受到限制。然而,预计汽车需求将在 2021 年再次增加并持续增长,从而导致预测期内全部区域的黏合剂使用量增加。
- 亚太电动车市场为黏合剂市场带来了另一个成长机会。电动和混合动力汽车的产量和采用率的不断提高,推动了汽车电子组装中黏合剂的使用量。中国是世界上最大的电动车生产国,也是全部区域最大的电动车生产国。 2016年至2021年间,商用电动车数量从562,603辆增加到1,116,382辆,成长率约98%。预计这些因素将增加对黏合剂的需求,从而在预测期内提高市场成长率。
亚太地区EVA胶黏剂产业概况
亚太地区EVA胶黏剂市场较为分散,前五大公司占9.91%的市占率。该市场的主要企业包括爱克工业、阿科玛集团、陶氏化学、汉高股份公司、南宝树脂化学集团等。
其他福利
- Excel 格式的市场预测 (ME) 表
- 3个月的分析师支持
目录
第一章执行摘要和主要发现
第二章 报告要约
第三章 引言
- 研究假设和市场定义
- 研究范围
- 调查方法
第四章 产业主要趋势
- 最终用户趋势
- 航太
- 车
- 建筑与施工
- 鞋类皮革
- 包装
- 木製品和配件
- 法律规范
- 澳洲
- 中国
- 印度
- 印尼
- 日本
- 马来西亚
- 新加坡
- 韩国
- 泰国
- 价值炼和通路分析
第五章市场区隔
- 最终用户产业
- 航太
- 车
- 建筑与施工
- 鞋类和皮革
- 医疗保健
- 包装
- 木製品和配件
- 其他的
- 科技
- 热熔胶
- 溶剂型
- 水性
- 国家
- 澳洲
- 中国
- 印度
- 印尼
- 日本
- 马来西亚
- 新加坡
- 韩国
- 泰国
- 其他亚太地区
第六章竞争格局
- 关键策略趋势
- 市场占有率分析
- 商业状况
- 公司简介
- Aica Kogyo Co..Ltd.
- Arkema Group
- CEMEDINE Co.,Ltd.
- Dow
- HB Fuller Company
- Henkel AG & Co. KGaA
- NANPAO RESINS CHEMICAL GROUP
- OKONG Corp.
- Paramelt BV
- Selic Corp Public Company Limited.
第七章:CEO面临的关键策略问题
第 8 章 附录
- 全球黏合剂和密封剂产业概况
- 概述
- 五力分析框架(产业吸引力分析)
- 全球价值链分析
- 驱动因素、限制因素和机会
- 资讯来源及延伸阅读
- 图片列表
- 关键见解
- 数据包
- 词彙表
简介目录
Product Code: 92413
The Asia-Pacific EVA Adhesives Market size is estimated at 4.12 billion USD in 2024, and is expected to reach 5.31 billion USD by 2028, growing at a CAGR of 6.52% during the forecast period (2024-2028).
Packaging is the fastest-growing end-user and remains as pole position
- EVA adhesives find applications in various end-user industries, including packaging, automotive, woodworking and joinery, and building and construction. These adhesives can bond substrates like paper, wood, plastics, rubbers, metals, and leather. Some major applications of these adhesives are paper/card stock boxes, package labeling, carton sealing, assembly, vehicle interiors, and paper conversion, among others.
- The demand for EVA adhesives has grown significantly from 2017 to 2019. The footwear and leather industry in South Korea witnessed the highest growth (of 27.62%) in the Asia-Pacific EVA adhesives market.
- In 2020, the demand for EVA adhesives declined from all end-user industries because of various factors such as operational and trade restrictions, supply chain constraints, and labor shortages due to the COVID-19 pandemic. The demand from the footwear and leather industry suffered the most, declining by 14.22% y-o-y. As global footwear consumption decreased by 22% y-o-y in 2020, footwear manufacturers concentrated in the Asia-Pacific region had to reduce their production. This negatively affected the demand for EVA adhesives in this industry.
- The industry's growth trend is expected to continue during the forecast period. In volume terms, the demand for EVA adhesives from all end-user industries combined is expected to record a CAGR of 5.09% during the forecast period 2022-2028. The packaging industry favors EVA adhesives over others because of their fast-curing properties and, thus, accounts for the largest share of the demand and is expected to remain the largest end-user industry during the forecast period 2022-2028.
The large manufacturing capacities of the Asia-Pacific region helped to secure the highest demand for EVA adhesives
- From 2017 to 2021, the demand for the EVA adhesives market generated from Asia-Pacific was the highest among all regions. This region's share of adhesive demand has consistently accounted for 46-47% of the global demand because of the region's high manufacturing capacity in all end-user industries. EVA resin-based adhesives with hot-melt technologies generate most of the demand in the area.
- From 2017 to 2019, the demand for adhesives from this region recorded a CAGR of less than 1%. The slow growth in EVA resin-based adhesives was due to a decrease in construction activities and automotive production in the region. The demand from these end-user industries declined at CAGRs of -2.4% and -2.25% in 2018 and 2019, respectively.
- In 2020, the demand from all end-user industries across the region declined due to constraints in operations, labor, raw material, supply chain, and other aspects. Among all industries in the region, the Australian footwear industry took the worst hit, declining by 49.53% Y-o-Y in volume terms in 2020. The decrease in domestic demand was due to the low purchasing power resulting from a weak economy, severely affecting this industry during the pandemic.
- In 2021, the demand for EVA resin-based adhesives quickly rebounded to the pre-pandemic volumes as restrictions eased. The Indian market witnessed the highest Y-o-Y growth of 8.55% in volume terms. The overall demand from the Asia-Pacific region is expected to grow, recording a CAGR of 4.46%, during the forecast period. This demand growth is expected to be driven by the region's construction, packaging, and automotive industries during the forecast period.
Asia-Pacific EVA Adhesives Market Trends
Fast paced growth of e-commerce industry in developing nations to augment the industry
- Packaging is mainly used for protection, containment, information, utility, and promotion. This makes packaging an integral part of most industries. In 2017, packaging usage accounted for 2.5 billion ton of packaging, including paper and paperboard and plastic packaging. In 2020, due to the COVID-19 pandemic, the market registered a negative growth rate of 7.4% due to disruptions in the supply chain, shortage of packaging material, restrictions on the import and export of goods, and factories operating at low capacity.
- Governments of different Asian countries have taken steps to reduce the use of plastic, as China and Indonesia are the first and second-largest contributors to plastic waste in the ocean. China has announced new restrictions on excessive packaging, requiring all food and cosmetics producers to adhere to specific guidelines determining the volume of packaging allowed in proportion to a product. The extended producer responsibility (EPR) regulation imposed by the Indonesian government will oblige producers and retailers to redesign their product packaging to include a higher proportion of recyclable material.
- In 2021, the market registered a positive growth of 8%, with 2.7 billion ton of packaging material used for various purposes. The packaging industry is expected to keep growing due to the rising middle-income population, improvement of supply chains, and rising e-commerce activities, which have significantly boosted the packaging industry in the past few years as special packaging is required for shipping goods. The growing Asian market is expected to boost packaging usage, enabling it to register a CAGR of 5.7% during the forecast period (2022-2028).
Increasing adoption of electric vehicles to drive the industry
- The Asia-Pacific automotive industry is one of the leading industries in the market, as the sales of automotive vehicles are largely increasing. Among all the countries, China is the largest automotive producer, accounting for about 57% of the regional production, followed by Japan with 17%, India with 10%, and South Korea with 8%.
- Vehicle sales in the region have majorly declined along with production, owing to which the utilization of adhesives has been impacted. While the Y-o-Y variation in 2017-18 was -1.8%, it fell further by -6.4% in 2018-19. In 2019-20, regional production was again impacted negatively and recorded a -10.2% decline from the previous year due to the COVID-19 pandemic. The shutdown of manufacturing facilities and the shortage of vehicle components due to disruptions in the supply chain constrained the production level. However, in 2021, the demand for automobiles rose again and is expected to continue, thereby increasing the utilization of adhesives across the region over the forecast period.
- The EV market in Asia-Pacific offers another opportunity for the adhesives market to grow. The rising production and adoption of EVs and hybrid vehicles are boosting the usage of adhesives for electronic component assembly in vehicles. China is the largest producer of EVs globally as well as across the region. From 2016 to 2021, the volume of commercial electric vehicles increased from 562,603 to 1,116,382 units, recording a growth rate of about 98%. These factors are expected to increase the demand for adhesives and result in the higher market growth over the forecast period.
Asia-Pacific EVA Adhesives Industry Overview
The Asia-Pacific EVA Adhesives Market is fragmented, with the top five companies occupying 9.91%. The major players in this market are Aica Kogyo Co..Ltd., Arkema Group, Dow, Henkel AG & Co. KGaA and NANPAO RESINS CHEMICAL GROUP (sorted alphabetically).
Additional Benefits:
- The market estimate (ME) sheet in Excel format
- 3 months of analyst support
TABLE OF CONTENTS
1 EXECUTIVE SUMMARY & KEY FINDINGS
2 REPORT OFFERS
3 INTRODUCTION
- 3.1 Study Assumptions & Market Definition
- 3.2 Scope of the Study
- 3.3 Research Methodology
4 KEY INDUSTRY TRENDS
- 4.1 End User Trends
- 4.1.1 Aerospace
- 4.1.2 Automotive
- 4.1.3 Building and Construction
- 4.1.4 Footwear and Leather
- 4.1.5 Packaging
- 4.1.6 Woodworking and Joinery
- 4.2 Regulatory Framework
- 4.2.1 Australia
- 4.2.2 China
- 4.2.3 India
- 4.2.4 Indonesia
- 4.2.5 Japan
- 4.2.6 Malaysia
- 4.2.7 Singapore
- 4.2.8 South Korea
- 4.2.9 Thailand
- 4.3 Value Chain & Distribution Channel Analysis
5 MARKET SEGMENTATION (includes market size in Value in USD and Volume, Forecasts up to 2028 and analysis of growth prospects)
- 5.1 End User Industry
- 5.1.1 Aerospace
- 5.1.2 Automotive
- 5.1.3 Building and Construction
- 5.1.4 Footwear and Leather
- 5.1.5 Healthcare
- 5.1.6 Packaging
- 5.1.7 Woodworking and Joinery
- 5.1.8 Other End-user Industries
- 5.2 Technology
- 5.2.1 Hot Melt
- 5.2.2 Solvent-borne
- 5.2.3 Water-borne
- 5.3 Country
- 5.3.1 Australia
- 5.3.2 China
- 5.3.3 India
- 5.3.4 Indonesia
- 5.3.5 Japan
- 5.3.6 Malaysia
- 5.3.7 Singapore
- 5.3.8 South Korea
- 5.3.9 Thailand
- 5.3.10 Rest of Asia-Pacific
6 COMPETITIVE LANDSCAPE
- 6.1 Key Strategic Moves
- 6.2 Market Share Analysis
- 6.3 Company Landscape
- 6.4 Company Profiles (includes Global Level Overview, Market Level Overview, Core Business Segments, Financials, Headcount, Key Information, Market Rank, Market Share, Products and Services, and Analysis of Recent Developments).
- 6.4.1 Aica Kogyo Co..Ltd.
- 6.4.2 Arkema Group
- 6.4.3 CEMEDINE Co.,Ltd.
- 6.4.4 Dow
- 6.4.5 H.B. Fuller Company
- 6.4.6 Henkel AG & Co. KGaA
- 6.4.7 NANPAO RESINS CHEMICAL GROUP
- 6.4.8 OKONG Corp.
- 6.4.9 Paramelt B.V.
- 6.4.10 Selic Corp Public Company Limited.
7 KEY STRATEGIC QUESTIONS FOR ADHESIVES AND SEALANTS CEOS
8 APPENDIX
- 8.1 Global Adhesives and Sealants Industry Overview
- 8.1.1 Overview
- 8.1.2 Porter's Five Forces Framework (Industry Attractiveness Analysis)
- 8.1.3 Global Value Chain Analysis
- 8.1.4 Drivers, Restraints, and Opportunities
- 8.2 Sources & References
- 8.3 List of Tables & Figures
- 8.4 Primary Insights
- 8.5 Data Pack
- 8.6 Glossary of Terms
02-2729-4219
+886-2-2729-4219
 混凝土黏合剂市场:按产品类型、形式、应用和最终用途产业划分-2026-2032年全球市场预测黏合剂市场:2026-2032年全球市场预测(黏合剂产品形态、化学性质、黏合技术和最终用途产业划分)纺织黏合剂市场:黏合剂类型、形态、功能、织物类型、最终用户和分销管道划分-全球预测,2026-2032年黏合剂机器类型、聚合物类型、速度、黏度、应用、最终用途产业和销售管道,全球预测,2026-2032年有机热连接件市场:依产品类型、应用、终端用户产业及通路划分,全球预测(2026-2032年)橡皮筋黏合剂市场按类型、形式、分销管道、应用和最终用户划分,全球预测(2026-2032年)橡胶基材黏合剂市场按配方技术、树脂类型、基材类型、最终用途产业和应用划分-全球预测,2026-2032年
 2025-2032年全球涂料、黏合剂和密封剂添加剂(CAS)市场
 全球黏合剂市场:机会与策略展望(至2034年)
 卫生黏合剂市场分析及预测(至2035年):类型、产品类型、应用、技术、材料类型、最终用户、形态、组成、功能、工艺
▼