


 |
市场调查报告书
商品编码
1693518
氮肥:市场占有率分析、产业趋势与统计、成长预测(2025-2030)Nitrogenous Fertilizer - Market Share Analysis, Industry Trends & Statistics, Growth Forecasts (2025 - 2030) |
||||||
价格
※ 本网页内容可能与最新版本有所差异。详细情况请与我们联繫。
简介目录
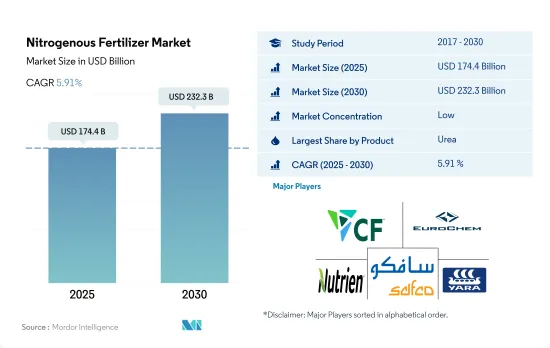
预计 2025 年氮肥市场规模为 1,744 亿美元,到 2030 年将达到 2,323 亿美元,预测期内(2025-2030 年)的复合年增长率为 5.91%。
预计增加产量的需求将推动市场成长。
- 尿素是世界上最重要、使用最广泛的氮肥。 2022年,尿素占全球氮肥消费量的48.6%。预计2022年全球尿素市场规模为750亿美元,同年消费量为1.402亿吨。
- 无水氨是所有氮肥中氮含量最高的(82%),氮以 NH3 的形式容易被利用。 2022年全球无水氨市场价值为2,450万美元,同年消费量为43亿吨。然而,无水氨作为肥料的使用仅限于北美国家,在那里它通常用于该地区的玉米带,因为它是一种高氮消费量作物。
- 预计到 2022 年,硝酸铵市场将占氮肥市场总量的 6.3%(按以金额为准计算),占氮肥市场总量的 8.5%(按数量计算),预计在 2023-2030 年预测期内,硝酸铵市场以金额为准的复合年增长率为 4.9%。硝酸铵受到种植者的欢迎,因为它比许多其他氮肥便宜,并且适合在所有季节使用。
- 此外,2022 年的氮肥市场在亚太地区最大。市场价值份额为34.6%。在亚太地区,中国和印度由于人口不断成长且耕地面积广阔,是两个最大的消费国。
- 由于氮肥是最需要的营养物质,预计预测期内全球氮肥市场价值将以 5.6% 的复合年增长率成长。
主要作物缺氮和氮利用效率下降可能推动氮肥市场
- 2022年,全球氮肥市场规模预估为1,847亿美元,消费量将达2.888亿吨。氮肥使用量的激增主要是因为作物利用土壤中氮的效率下降。
- 亚太地区将主导氮肥市场,2022年将占据39.0%的份额。特别是农业大国中国和印度受益于充足的耕地、人口成长带来的粮食需求成长以及政府的大力支持。这些因素可能会进一步推动该地区的氮肥消费。
- 北美市占率为23.2%。在北美,美国凭藉其广阔的耕地面积占据了大部分市场,田间作物占耕地面积的69%,因此需要更高的氮投入。
- 欧洲是仅次于北美的第三大市场,2022 年的销售份额为 16.7%。该地区正面临干旱和热浪等挑战,这些挑战阻碍了土壤中氮的利用,导致作物减产。因此,欧洲农民越来越依赖氮肥,带来了潜在的市场扩张。
- 氮肥在农业生产中至关重要。儘管种植面积不断缩小,但由于耕作方式的改善和为提高农业产量和生产率而增加的施肥量,全球氮肥市场预计仍将成长。
全球氮肥市场趋势
农业部门生产更多粮食的压力越来越大,预计将导致田间作物种植面积增加。
- 当前全球农业领域面临许多挑战。根据联合国预测,到2050年,世界人口可能会超过90亿。人口成长可能会给农业部门带来过度压力,而由于劳动力短缺和都市化进程加快导致的耕地减少,农业部门的产量已经下降。根据联合国粮食及农业组织预测,2050年,全球70%的人口预计将居住在城市。随着全球可耕地面积的减少,农民需要更多的肥料来提高作物产量。
- 亚太地区是世界上最大的农产品生产地区。农业对该地区的经济至关重要,约占总劳动力的 20%。该地区以农田作物为主,占该地区作物总面积的95%以上。水稻、小麦和玉米是该地区的主要田间作物,占2022年总耕地面积的42.5%左右。
- 就农业用地总面积而言,北美洲是世界上第二大可耕地地区。北美的农场种植多种作物,以田间作物为主。根据美国农业部的数据,玉米、棉花、稻米、大豆和小麦是该地区的主要田间作物。美国占据市场主导地位,研究期间美国作物面积达1.5509亿公顷,其中田间作物占据市场的大部分,到2022年将占65.7%的份额。 2017年至2019年间,美国作物种植面积大幅下降,主要原因是不利的环境条件导致德克萨斯州和休士顿等地区发生严重洪灾。
氮肥是田间作物使用最广泛的主要肥料,占总消费量的45.57%。
- 2023年田间作物平均基肥施用量为每公顷164.3公斤。特别是玉米、水稻、小麦、高粱、大豆、油菜籽和棉花等主要田间作物,需要较高的营养水平来支持其生长。集约化耕作方式和持续种植小麦等主要作物导致营养缺乏,因此需要增加营养施用。在这些条件下,需要更多的营养投入来维持土壤肥力。
- 在所有主要营养物质中,氮是田间作物消耗的主要营养物质。氮肥平均施用量达每公顷224.6公斤。由于pH值高、土壤成分沙质以及反覆干旱和热浪造成的持续干燥条件,土壤缺氮。这些因素共同增加了农业实践中对氮营养的需求。
- 油菜籽成为氮营养的重要消耗作物,平均施肥量为347.4公斤/公顷。油菜种植对氮的需求量大,这主要与这些作物的氮利用效率(NUE)降低有关。中国、加拿大、印度、澳洲和欧洲国家是油菜籽的主要生产国。近期干旱、洪涝等气候条件的变化导致土壤氮流失,影响油菜籽的生长和产量形成。必须将氮的施用量保持在一定范围内。充足的氮含量可提高光合作用能力、代谢量、形态发生,并提高产量。
氮肥业概况
氮肥市场分散,前五大企业占19.67%的市占率。该市场的主要企业有:CF Industries Holdings, Inc.、EuroChem Group、Nutrien Ltd.、SABIC Agri-Nutrients Co. 和 Yara International ASA(按字母顺序排列)
其他福利
- Excel 格式的市场预测 (ME) 表
- 3个月的分析师支持
目录
第一章执行摘要和主要发现
第二章 报告要约
第三章 引言
- 研究假设和市场定义
- 研究范围
- 调查方法
第四章 产业主要趋势
- 主要作物种植面积
- 田间作物
- 园艺作物
- 平均养分施用量
- 主要营养素
- 田间作物
- 园艺作物
- 主要营养素
- 灌溉农田
- 法律规范
- 价值炼和通路分析
第五章市场区隔
- 产品
- 硝酸铵
- 无水氨
- 尿素
- 其他的
- 形式
- 传统的
- 特别的
- CRF
- 液体肥料
- SRF
- 水溶性
- 施肥方式
- 受精
- 叶面喷布
- 土壤
- 作物类型
- 田间作物
- 园艺作物
- 草坪和观赏植物
- 地区
- 亚太地区
- 澳洲
- 孟加拉
- 中国
- 印度
- 印尼
- 日本
- 巴基斯坦
- 菲律宾
- 泰国
- 越南
- 其他亚太地区
- 欧洲
- 法国
- 德国
- 义大利
- 荷兰
- 俄罗斯
- 西班牙
- 乌克兰
- 英国
- 其他欧洲国家
- 中东和非洲
- 奈及利亚
- 沙乌地阿拉伯
- 南非
- 土耳其
- 其他中东和非洲地区
- 北美洲
- 加拿大
- 墨西哥
- 美国
- 北美其他地区
- 南美洲
- 阿根廷
- 巴西
- 南美洲其他地区
- 亚太地区
第六章竞争格局
- 关键策略趋势
- 市场占有率分析
- 商业状况
- 公司简介
- CF Industries Holdings, Inc.
- Coromandel International Ltd.
- EuroChem Group
- Grupa Azoty SA(Compo Expert)
- Indian Farmers Fertiliser Cooperative Limited
- Koch Industries Inc.
- Nutrien Ltd.
- SABIC Agri-Nutrients Co.
- Yara International ASA
第七章:CEO面临的关键策略问题
第 8 章 附录
- 世界概况
- 概述
- 五力分析框架
- 全球价值链分析
- 市场动态(DRO)
- 资讯来源及延伸阅读
- 图片列表
- 关键见解
- 资料包
- 词彙表
简介目录
Product Code: 92582
The Nitrogenous Fertilizer Market size is estimated at 174.4 billion USD in 2025, and is expected to reach 232.3 billion USD by 2030, growing at a CAGR of 5.91% during the forecast period (2025-2030).
The growing need to increase the production is expected to bolster the growth of the market.
- Urea is the most important and most used nitrogenous fertilizer globally. In 2022, it accounted for a 48.6% share of the total consumption of nitrogenous fertilizers globally. The global urea market was valued at USD 75.0 billion in 2022, with a volume consumption of 140.2 million metric ton in the same year.
- Anhydrous ammonia has the highest nitrogen content (82%) among all nitrogenous fertilizers, where nitrogen is readily available in the form of NH3. The global market for anhydrous ammonia was valued at USD 24.5 million in 2022, with a volume consumption of 4.3 billion metric tons in the same year. However, the usage of anhydrous ammonia as a fertilizer is restricted to the countries in North America and is commonly used in the region's corn belts since it is a highly nitrogen-consuming crop.
- The ammonium nitrate market accounted for 6.3% and 8.5%, by value and volume, respectively, of the total nitrogenous fertilizers in 2022 and it is anticipated to grow over the forecasted period 2023-2030 at 4.9% CAGR in terms of value. Ammonium Nitrate is more inexpensive than many other nitrogen fertilizers and suitable for all seasons, making it a preferred choice for growers.
- Moreover, Asia-Pacific was the largest market for nitrogenous fertilizers in 2022. It accounted for a market value share of 34.6%. In the Asia-Pacific region, China and India are the two largest consumers owing to their increasing population and large areas under cultivation.
- The global nitrogenous fertilizer market value is anticipated to grow during the forecast period at 5.6% CAGR as it is the most demanded nutrient.
Nitrogen deficiency in major crops and reducing nitrogen use efficiency may drive the nitrogenous fertilizers market
- In 2022, the global nitrogenous fertilizer market reached a value of USD 184.7 billion, with a consumption volume of 288.8 million metric tons. This surge in nitrogen fertilizer adoption is primarily driven by the reduced efficiency of crops in utilizing nitrogen from the soil.
- Asia-Pacific dominates the nitrogenous fertilizer market, commanding a 39.0% share in 2022. Notably, China and India, both agricultural powerhouses, benefit from ample arable land, a rising food demand due to increasing population, and significant government support. These factors are poised to propel nitrogenous fertilizer consumption in the region further.
- North America accounted for market volume shares of 23.2%. In North America, the United States dominates the market, boasting the majority share due to its extensive arable land, with field crops occupying 69% of the cropland, necessitating higher nitrogen inputs.
- Followed by North America, Europe, the third-largest market, held a 16.7% volume share in 2022. The region grapples with challenges like droughts and heatwaves, which hamper nitrogen availability in the soil, leading to crop losses. Consequently, farmers in Europe increasingly turn to nitrogenous fertilizers, indicating a potential market upswing.
- Nitrogenous fertilizers hold paramount importance in agricultural production. Despite shrinking cultivated areas, the global market for these fertilizers is projected to witness growth, driven by intensified cultivation practices and increased fertilizer application, all aimed at bolstering yields and productivity in the agricultural sector.
Global Nitrogenous Fertilizer Market Trends
The rising pressure on the agricultural sector to increase food production is expected to drive area under field crop cultivation
- The global agricultural sector is currently facing many challenges. According to the UN, the world population will likely exceed nine billion by 2050. This population growth may overburden the agricultural sector, which is already experiencing an output loss due to a lack of laborers and the shrinkage of agricultural fields caused by rising urbanization. According to the Food and Agriculture Organization, 70% of the global population is expected to live in cities by 2050. Due to the global loss of arable land, farmers need more fertilizers to increase crop yields.
- Asia-Pacific is the world's largest producer of agricultural products. Agriculture is critical to the region's economy, as it employs about 20% of the total available workforce. Field crop cultivation dominates the region, accounting for more than 95% of the total crop area in the region. Rice, wheat, and corn are the major field crops produced in the region, together accounting for about 42.5% of the total crop area in 2022.
- North America is the second-largest arable region in terms of total agricultural land area in the world. Diverse varieties of crops are grown on North American farms, primarily field crops. According to the USDA, corn, cotton, rice, soybean, and wheat are among the region's dominant field crops. The United States dominated the market by accounting for 155.09 million hectares of the total area under crop cultivation in the region during the study period, with field crops covering the majority of the area, accounting for a share of 65.7% in 2022. Crop acreage in the country fell significantly between 2017 and 2019, primarily due to unfavorable environmental conditions that resulted in heavy floods in areas such as Texas and Houston.
Nitrogen is the most widely used primary nutrient fertilizer in field crops, accounting for 45.57% of the total consumption
- In 2023, the average primary nutrient application rate for field crops stood at 164.3 kg per hectare. Notably, corn, rice, wheat, sorghum, soybean, rapeseed, and cotton represented the primary field crops cultivated, and these crops need higher nutrient levels to support their growth. The nutrient deficiency arising from intensive agricultural practices and the continuous cultivation of major crops, such as wheat, necessitates an increased application of nutrients. This situation calls for higher nutrient input to maintain soil fertility.
- Nitrogen stands out as the predominant nutrient consumed by field crops among all the primary nutrients. The average nutrient application rate of nitrogen reached a substantial 224.6 kg per hectare. The soils experience nitrogen deficiency due to their high pH levels, sandy soil composition, and persistent dry conditions resulting from recurrent droughts and heat waves. These factors collectively drive an increased demand for nitrogen nutrients in agricultural practices.
- Rapeseed emerged as a significant consumer of nitrogen nutrients, with an average nutrient application rate of 347.4 kg per hectare. This substantial nitrogen demand in rapeseed cultivation is primarily linked to the reduced nitrogen use efficiency (NUE) by these crops. China, Canada, India, Australia, and European countries are major producers of rapeseed crops. Changing climatic conditions like recent droughts and heavy flooding conditions lead to N loss from soils, which affects crop growth and yield formation of rapeseed. It is necessary to control the nitrogen application rate to keep it within the limits. Appropriate levels of nitrogen can boost the photosynthetic capacity, metabolic levels, and morphogenesis and increase yield.
Nitrogenous Fertilizer Industry Overview
The Nitrogenous Fertilizer Market is fragmented, with the top five companies occupying 19.67%. The major players in this market are CF Industries Holdings, Inc., EuroChem Group, Nutrien Ltd., SABIC Agri-Nutrients Co. and Yara International ASA (sorted alphabetically).
Additional Benefits:
- The market estimate (ME) sheet in Excel format
- 3 months of analyst support
TABLE OF CONTENTS
1 EXECUTIVE SUMMARY & KEY FINDINGS
2 REPORT OFFERS
3 INTRODUCTION
- 3.1 Study Assumptions & Market Definition
- 3.2 Scope of the Study
- 3.3 Research Methodology
4 KEY INDUSTRY TRENDS
- 4.1 Acreage Of Major Crop Types
- 4.1.1 Field Crops
- 4.1.2 Horticultural Crops
- 4.2 Average Nutrient Application Rates
- 4.2.1 Primary Nutrients
- 4.2.1.1 Field Crops
- 4.2.1.2 Horticultural Crops
- 4.2.1 Primary Nutrients
- 4.3 Agricultural Land Equipped For Irrigation
- 4.4 Regulatory Framework
- 4.5 Value Chain & Distribution Channel Analysis
5 MARKET SEGMENTATION (includes market size in Value in USD and Volume, Forecasts up to 2030 and analysis of growth prospects)
- 5.1 Product
- 5.1.1 Ammonium Nitrate
- 5.1.2 Anhydrous Ammonia
- 5.1.3 Urea
- 5.1.4 Others
- 5.2 Form
- 5.2.1 Conventional
- 5.2.2 Speciality
- 5.2.2.1 CRF
- 5.2.2.2 Liquid Fertilizer
- 5.2.2.3 SRF
- 5.2.2.4 Water Soluble
- 5.3 Application Mode
- 5.3.1 Fertigation
- 5.3.2 Foliar
- 5.3.3 Soil
- 5.4 Crop Type
- 5.4.1 Field Crops
- 5.4.2 Horticultural Crops
- 5.4.3 Turf & Ornamental
- 5.5 Region
- 5.5.1 Asia-Pacific
- 5.5.1.1 Australia
- 5.5.1.2 Bangladesh
- 5.5.1.3 China
- 5.5.1.4 India
- 5.5.1.5 Indonesia
- 5.5.1.6 Japan
- 5.5.1.7 Pakistan
- 5.5.1.8 Philippines
- 5.5.1.9 Thailand
- 5.5.1.10 Vietnam
- 5.5.1.11 Rest of Asia-Pacific
- 5.5.2 Europe
- 5.5.2.1 France
- 5.5.2.2 Germany
- 5.5.2.3 Italy
- 5.5.2.4 Netherlands
- 5.5.2.5 Russia
- 5.5.2.6 Spain
- 5.5.2.7 Ukraine
- 5.5.2.8 United Kingdom
- 5.5.2.9 Rest of Europe
- 5.5.3 Middle East & Africa
- 5.5.3.1 Nigeria
- 5.5.3.2 Saudi Arabia
- 5.5.3.3 South Africa
- 5.5.3.4 Turkey
- 5.5.3.5 Rest of Middle East & Africa
- 5.5.4 North America
- 5.5.4.1 Canada
- 5.5.4.2 Mexico
- 5.5.4.3 United States
- 5.5.4.4 Rest of North America
- 5.5.5 South America
- 5.5.5.1 Argentina
- 5.5.5.2 Brazil
- 5.5.5.3 Rest of South America
- 5.5.1 Asia-Pacific
6 COMPETITIVE LANDSCAPE
- 6.1 Key Strategic Moves
- 6.2 Market Share Analysis
- 6.3 Company Landscape
- 6.4 Company Profiles
- 6.4.1 CF Industries Holdings, Inc.
- 6.4.2 Coromandel International Ltd.
- 6.4.3 EuroChem Group
- 6.4.4 Grupa Azoty S.A. (Compo Expert)
- 6.4.5 Indian Farmers Fertiliser Cooperative Limited
- 6.4.6 Koch Industries Inc.
- 6.4.7 Nutrien Ltd.
- 6.4.8 SABIC Agri-Nutrients Co.
- 6.4.9 Yara International ASA
7 KEY STRATEGIC QUESTIONS FOR FERTILIZER CEOS
8 APPENDIX
- 8.1 Global Overview
- 8.1.1 Overview
- 8.1.2 Porter's Five Forces Framework
- 8.1.3 Global Value Chain Analysis
- 8.1.4 Market Dynamics (DROs)
- 8.2 Sources & References
- 8.3 List of Tables & Figures
- 8.4 Primary Insights
- 8.5 Data Pack
- 8.6 Glossary of Terms
02-2729-4219
+886-2-2729-4219
 全球氮肥市场(按类型、形态、作物类型和分销管道划分)预测 2025-2032
 2025年氮肥全球市场报告
 日本氮肥市场报告(按类型(尿素、硝酸铵、硫酸铵、硝酸铵钙等)、作物类型、形式、施用方式和地区)2025-20332025 年至 2033 年氮肥市场报告(按类型划分,包括尿素、硝酸铵、硫酸铵、硝酸铵钙等)、作物类型、形式、施用方式和地区
 全球氮肥市场研究报告-产业分析、规模、份额、成长、趋势与预测 2025 年至 2033 年
 氮肥市场 - 全球产业规模、份额、趋势、机会和预测,按产品、应用、地区和竞争细分,2020-2030 年
 氮肥市场评估:按产品类型、形式、作物类型、应用模式和地区划分的机会和预测(2018-2032 年)
 氮肥市场规模、份额、成长分析、按类型、按作物类型、按应用、按形式、按地区 - 行业预测,2024-2031 年
 2030 年氮肥市场预测:按产品、形式、应用和地区分類的全球分析