


 |
市场调查报告书
商品编码
1693525
液体肥料:市场占有率分析、产业趋势与统计、成长预测(2025-2030)Liquid Fertilizer - Market Share Analysis, Industry Trends & Statistics, Growth Forecasts (2025 - 2030) |
||||||
※ 本网页内容可能与最新版本有所差异。详细情况请与我们联繫。
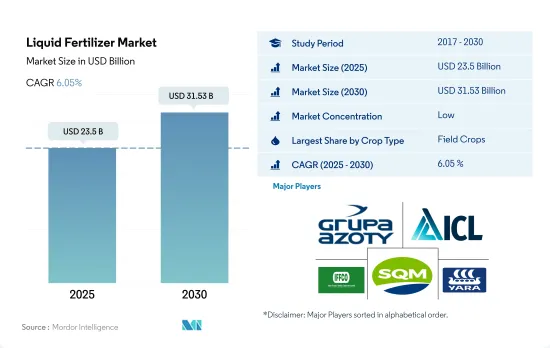
液体肥料市场规模预计在 2025 年达到 235 亿美元,预计到 2030 年将达到 315.3 亿美元,预测期内(2025-2030 年)的复合年增长率为 6.05%。
增加田间作物液体肥料的消耗
- 田间作物在全球液体肥料市场中占据主导地位,约占液体肥料总消费量的77.4%。 2022年田间作物液体肥料消费量将达2,060万吨,相当于206亿美元。由于田间作物的种植面积较大,因此田间作物对液体肥料的消费量较高。世界上超过85.0%的农业用地用于种植田间作物。
- 园艺作物是液体肥料的第二大作物,2022 年约占全球液体肥料消费量的 19.2%。
- 在新冠疫情爆发后,人们对健康和营养的关注度不断提高,导致全球对水果和蔬菜等高价值作物的需求增加。番茄、马铃薯、洋葱、捲心菜和花椰菜等高需求蔬菜作物消耗大量肥料,并且全年生长。叶面液体肥料在水果作物中发挥重要作用,因为众所周知,叶面喷布可以提高水果的品质。
- 草坪和观赏作物约占全球液体肥料市场总量的 3.4%,2022 年价值 8.639 亿美元,消费量为 907,200 吨。
- 由于污染问题、园林美学景观日益重要以及全球生态旅游的发展,草坪和观赏作物的种植面积正在增加。因此,预计 2023-2030 年期间全球各类作物液体肥料消费量的复合年增长率将达到 5.1%。
美国在该地区液体肥料消费中占有最大的市场占有率
- 2022年,亚太液体肥料市场约占全球液体肥料市场总份额的49.9%。该地区的种植者越来越意识到液体肥料的好处,它更容易渗透土壤,使植物更快吸收养分。此外,液体肥料可消除肥料浪费,并可施用于地面或叶子。
- 2022 年,液体肥料占北美特殊肥料市场的 21.8% 。美国是北美最大的液体肥料消费国,2022 年的份额为 74.4%。 2022 年,美国液体肥料市场价值为 31 亿美元,消费量为 330 万吨。
- 欧洲是全球第三大液体肥料市场,约占液体肥料市场总量的15.6%。这是因为该地区拥有优良的灌溉系统。例如,德国、俄罗斯、英国和法国等国家超过55%的灌溉土地被喷灌和微灌系统所覆盖,这推动了该地区的市场发展。
- 该地区各国政府继续透过价格补贴鼓励采用微灌溉系统。因此,随着更先进的灌溉方法的采用,预计未来该地区液体肥料的采用量将会增加。
- 因此,由于施用方便、分布均匀且施用成本降低,因此采用液体肥料的趋势日益增长。这些因素可能会推动 2023 年至 2030 年期间液体肥料市场的发展。
全球液体肥料市场趋势
为了满足日益增长的粮食需求,农业面临越来越大的压力,预计田间作物的种植面积将会增加。
- 当前全球农业领域面临许多挑战。根据联合国预测,到2050年,世界人口可能会超过90亿。人口成长可能会对农业造成过多的压力,而由于劳动力短缺和都市化导致的耕地减少,农业产量已经下降。根据联合国粮食及农业组织预测,2050年,全球70%的人口预计将居住在城市。随着全球可耕地面积减少,农民需要使用更多的肥料来提高作物产量。
- 亚太地区是世界上最大的农产品生产地区。农业对该地区的经济至关重要,约占总劳动力的 20%。该地区以农田作物为主,占该地区作物总面积的95%以上。水稻、小麦和玉米是该地区的主要田间作物,约占2022年总种植面积的24.3%。
- 北美洲是世界上第二大可耕地。北美的农场种植多种作物,以田间作物为主。根据美国农业部的数据,玉米、棉花、稻米、大豆和小麦是该地区的主要田间作物。在研究期间,美国占作物种植面积的 46.2%,占市场主导地位。 2017年至2019年间,该国作物种植面积大幅下降,主因是不利的环境条件导致德克萨斯州和休士顿等地区发生严重洪灾。
全球田间作物主要养分氮、钾、磷的平均施用量为164.31公斤/公顷。
- 玉米、油菜籽、棉花、高粱、稻米、小麦和大豆是世界作物的初级营养消费者。这些田间作物的主要养分施用量分别为 230.57 公斤/公顷、255.75 公斤/公顷、172.70 公斤/公顷、158.46 公斤/公顷、154.49 公斤/公顷、135.35 公斤/公顷和 120.97 公斤/公顷。主要营养素对作物至关重要,因为它们在植物代谢过程中发挥着至关重要的作用,并有助于细胞、细胞膜和叶绿素等组织的形成。磷对于种植优质作物至关重要,而钾可以激活植物生长发育所必需的酵素。
- 全球田间作物氮、钾、磷的平均施用量为164.31公斤/公顷。氮肥是田间作物使用最广泛的大量营养肥料,施用率为 224.6 公斤/公顷,其次是钾肥,施用率为 150.3 公斤/公顷,磷肥是第三大消费量肥料,2022 年施用率为 117.9 公斤/公顷。
- 2022年,氮肥施用量最高的是油菜,为347.4公斤/公顷。同样,玉米的磷施用量最高,为156.3公斤/公顷,油菜的钾施用量最高,为248.6公斤/公顷。全球田间作物种植面积正在增加,尤其是在南美洲和亚太地区。这些都是肥料的潜在成长市场。由于其高效性,专用肥料在欧洲和北美等已开发地区以及营养缺乏现象普遍的地区已广泛应用。预计这些因素将在 2023 年至 2030 年期间推动主要营养肥料市场的发展。
液体肥料产业概况
液体肥料市场较为分散,前五大企业占15.48%的市占率。该市场的主要企业包括 Grupa Azoty SA(Compo Expert)、ICL Group Ltd、Indian Farmers Fertilizer Cooperative Limited、Sociedad Quimica y Minera de Chile SA、Yara International ASA 等。
其他福利
- Excel 格式的市场预测 (ME) 表
- 3个月的分析师支持
目录
第一章执行摘要和主要发现
第二章 报告要约
第三章 引言
- 研究假设和市场定义
- 研究范围
- 调查方法
第四章 产业主要趋势
- 主要作物种植面积
- 田间作物
- 园艺作物
- 平均养分施用量
- 微量营养素
- 田间作物
- 园艺作物
- 主要营养素
- 田间作物
- 园艺作物
- 次要宏量营养素
- 田间作物
- 园艺作物
- 微量营养素
- 灌溉农田
- 法律规范
- 价值炼和通路分析
第五章市场区隔
- 类型
- 复合型
- 直的
- 按营养成分
- 微量营养素
- 氮
- 磷酸
- 钾
- 次要宏量营养素
- 应用模式
- 受精
- 叶面喷布
- 作物类型
- 田间作物
- 园艺作物
- 草坪和观赏植物
- 地区
- 亚太地区
- 澳洲
- 孟加拉
- 中国
- 印度
- 印尼
- 日本
- 巴基斯坦
- 菲律宾
- 泰国
- 越南
- 其他亚太地区
- 欧洲
- 法国
- 德国
- 义大利
- 荷兰
- 俄罗斯
- 西班牙
- 乌克兰
- 英国
- 其他欧洲国家
- 中东和非洲
- 奈及利亚
- 沙乌地阿拉伯
- 南非
- 土耳其
- 其他中东和非洲地区
- 北美洲
- 加拿大
- 墨西哥
- 美国
- 北美其他地区
- 南美洲
- 阿根廷
- 巴西
- 南美洲其他地区
- 亚太地区
第六章 竞争格局
- 关键策略趋势
- 市场占有率分析
- 商业状况
- 公司简介
- BMS Micro-Nutrients NV
- Grupa Azoty SA(Compo Expert)
- ICL Group Ltd
- Indian Farmers Fertiliser Cooperative Limited
- Nortox
- Safsulphur
- Sociedad Quimica y Minera de Chile SA
- Yara International ASA
第七章:CEO面临的关键策略问题
第 8 章 附录
- 世界概况
- 概述
- 五力分析框架
- 全球价值链分析
- 市场动态(DRO)
- 资讯来源及延伸阅读
- 图片列表
- 关键见解
- 数据包
- 词彙表
The Liquid Fertilizer Market size is estimated at 23.5 billion USD in 2025, and is expected to reach 31.53 billion USD by 2030, growing at a CAGR of 6.05% during the forecast period (2025-2030).
Field crop consumption of liquid fertilizers is increasing
- Field crops dominated the global liquid fertilizer market, accounting for about 77.4% of the total liquid fertilizer consumption. Their volume consumption of liquid fertilizers was 20.6 million metric tons, worth USD 20.6 billion in 2022. The large consumption of liquid fertilizers by field crops is due to the large area under cultivation of these crops. More than 85.0% of the global agricultural land is dedicated to the cultivation of field crops.
- Horticultural crops are the second-largest crop type that consumes liquid fertilizers, accounting for about 19.2% of the global liquid fertilizer consumption in 2022.
- With increasing concerns for health and nutrition after the COVID-19 pandemic, the demand for high-value crops like fruits and vegetables is increasing worldwide. Vegetable crops with major demand, such as tomatoes, potatoes, onions, cabbage, and cauliflower, consume high amounts of fertilizer and are grown throughout the year. Foliar liquid fertilizers play an important role in fruit crops, as foliar spraying is known to improve the quality of fruits.
- Turf and ornamental crops accounted for a share of about 3.4% of the total global liquid fertilizer market and were valued at USD 863.9 million in 2022, with a volume consumption of 907.2 thousand metric tons.
- The area under cultivation of turf and ornamental crops is increasing with concerns over pollution, the growing importance of aesthetic landscaping in gardens, and ecotourism worldwide. Therefore, the global consumption of liquid fertilizers in respective crop types is anticipated to register a CAGR of 5.1% between 2023 and 2030.
The United States occupied the higher market share in liquid fertilizers consumption in the region
- In 2022, the Asia-Pacific liquid fertilizers market accounted for approximately 49.9% of the global liquid fertilizers market's total value share. Growers in the region are increasingly aware of the advantages of liquid fertilizers, such as their ability to penetrate the soil easily and enable plants to absorb nutrients more quickly. Additionally, liquid fertilizers help reduce fertilizer wastage and can be applied either to the ground or to the leaves.
- Liquid fertilizer represented 21.8% of the North American specialty market in 2022. The United States was the top consumer of liquid fertilizers in North America, with a share of 74.4% in 2022. The liquid fertilizer market in the country was valued at USD 3.1 billion in 2022, with a volume consumption of 3.3 million metric tons.
- Europe is the third-largest market for liquid fertilizers in the world, accounting for about 15.6% of the total liquid fertilizer market. This is due to the dominance of better irrigation systems in the region. For instance, countries like Germany, Russia, the United Kingdom, and France have more than 55% of their irrigated land covered by sprinklers or micro-irrigation systems, thus driving the market in the region.
- Governments across the region are continuously promoting the adoption of micro-irrigation systems through price subsidies. Therefore, the adoption of liquid fertilizers in the region is expected to increase in the future, with the increased adoption of advanced irrigation methods.
- Hence, there is an increasing trend toward the adoption of liquid fertilizers due to the ease of application, uniform distribution, and reduction in the cost of application. These factors may drive the liquid fertilizer market between 2023 and 2030.
Global Liquid Fertilizer Market Trends
The rising pressure on the agriculture industry to meet the increasing demand for food is expected to increase the area under field crop cultivation
- The global agricultural sector is currently facing many challenges. According to the UN, the world population is likely to exceed nine billion by 2050. This population growth may overburden the agricultural industry, which is already experiencing an output loss due to a lack of laborers and the shrinkage of agricultural fields caused by rising urbanization. According to the Food and Agriculture Organization, 70% of the global population is expected to live in cities by 2050. Due to the global loss of arable land, farmers now need to utilize more fertilizers to increase crop yields.
- Asia-Pacific is the world's largest producer of agricultural products. Agriculture is critical to the region's economy, as it employs about 20% of the total available workforce. Field crop cultivation dominates the region, accounting for more than 95% of the total crop area in the region. Rice, wheat, and corn are the major field crops produced in the region, which accounted for about 24.3% of the total crop area in 2022.
- North America is the second-largest arable region of the total agricultural land area in the world. Diverse varieties of crops are grown in North American farms, primarily field crops. As per the USDA, corn, cotton, rice, soybean, and wheat are among the region's dominant field crops. The United States dominated the market by accounting for 46.2% of the total area under crop cultivation during the study period, with field crops covering the majority of the area compared to other crop types. Crop acreage in the country fell significantly between 2017 and 2019, primarily due to unfavorable environmental conditions that resulted in heavy floods in areas such as Texas and Houston.
The global average application rate of primary nutrient nitrogen, potassium, and phosphorus in field crops is 164.31 kg/ha
- Corn, rapeseed, cotton, sorghum, rice, wheat, and soybean are some of the major primary nutrient-consuming crops worldwide. The primary nutrient application rates for these field crops are 230.57 kg/ha, 255.75 kg/ha, 172.70 kg/ha, 158.46 kg/ha, 154.49 kg/ha, 135.35 kg/ha, and 120.97 kg/ha, respectively. Primary nutrient fertilizers are crucial for crops because they play an essential role in plant metabolic processes and assist in forming tissues such as cells, cell membranes, and chlorophyll. Phosphorus is essential for growing high-quality crops; potassium activates the enzymes needed for plant growth and development.
- The global average application rate of nitrogen, potassium, and phosphorus in field crops is 164.31 kg/ha. Nitrogen is the most widely used primary nutrient fertilizer in field crops, accounting for an application rate of 224.6 kg/hectare, followed by potassic fertilizers with 150.3 kg/hectare, and phosphorus was the third most consumed fertilizer with an application rate of 117.9 kg/hectare in 2022.
- In 2022, the nitrogen application rate was highest in rapeseed at 347.4 kg/hectare. Similarly, the phosphorus application rate was highest in corn at 156.3 kg/hectare, and the potassium application rate was highest in canola at 248.6 kg/hectare. The global field crop cultivation area is increasing, particularly in South America and Asia-Pacific. These are the potential growing markets for fertilizers. Due to their efficiency, specialty fertilizers are widely used in developed regions such as Europe, North America, and other regions with widespread nutrient deficiencies. These factors are anticipated to drive the primary nutrient fertilizers market between 2023 and 2030.
Liquid Fertilizer Industry Overview
The Liquid Fertilizer Market is fragmented, with the top five companies occupying 15.48%. The major players in this market are Grupa Azoty S.A. (Compo Expert), ICL Group Ltd, Indian Farmers Fertiliser Cooperative Limited, Sociedad Quimica y Minera de Chile SA and Yara International ASA (sorted alphabetically).
Additional Benefits:
- The market estimate (ME) sheet in Excel format
- 3 months of analyst support
TABLE OF CONTENTS
1 EXECUTIVE SUMMARY & KEY FINDINGS
2 REPORT OFFERS
3 INTRODUCTION
- 3.1 Study Assumptions & Market Definition
- 3.2 Scope of the Study
- 3.3 Research Methodology
4 KEY INDUSTRY TRENDS
- 4.1 Acreage Of Major Crop Types
- 4.1.1 Field Crops
- 4.1.2 Horticultural Crops
- 4.2 Average Nutrient Application Rates
- 4.2.1 Micronutrients
- 4.2.1.1 Field Crops
- 4.2.1.2 Horticultural Crops
- 4.2.2 Primary Nutrients
- 4.2.2.1 Field Crops
- 4.2.2.2 Horticultural Crops
- 4.2.3 Secondary Macronutrients
- 4.2.3.1 Field Crops
- 4.2.3.2 Horticultural Crops
- 4.2.1 Micronutrients
- 4.3 Agricultural Land Equipped For Irrigation
- 4.4 Regulatory Framework
- 4.5 Value Chain & Distribution Channel Analysis
5 MARKET SEGMENTATION (includes market size in Value in USD and Volume, Forecasts up to 2030 and analysis of growth prospects)
- 5.1 Type
- 5.1.1 Complex
- 5.1.2 Straight
- 5.1.2.1 By Nutrient
- 5.1.2.1.1 Micronutrients
- 5.1.2.1.2 Nitrogenous
- 5.1.2.1.3 Phosphatic
- 5.1.2.1.4 Potassic
- 5.1.2.1.5 Secondary Macronutrients
- 5.2 Application Mode
- 5.2.1 Fertigation
- 5.2.2 Foliar
- 5.3 Crop Type
- 5.3.1 Field Crops
- 5.3.2 Horticultural Crops
- 5.3.3 Turf & Ornamental
- 5.4 Region
- 5.4.1 Asia-Pacific
- 5.4.1.1 Australia
- 5.4.1.2 Bangladesh
- 5.4.1.3 China
- 5.4.1.4 India
- 5.4.1.5 Indonesia
- 5.4.1.6 Japan
- 5.4.1.7 Pakistan
- 5.4.1.8 Philippines
- 5.4.1.9 Thailand
- 5.4.1.10 Vietnam
- 5.4.1.11 Rest of Asia-Pacific
- 5.4.2 Europe
- 5.4.2.1 France
- 5.4.2.2 Germany
- 5.4.2.3 Italy
- 5.4.2.4 Netherlands
- 5.4.2.5 Russia
- 5.4.2.6 Spain
- 5.4.2.7 Ukraine
- 5.4.2.8 United Kingdom
- 5.4.2.9 Rest of Europe
- 5.4.3 Middle East & Africa
- 5.4.3.1 Nigeria
- 5.4.3.2 Saudi Arabia
- 5.4.3.3 South Africa
- 5.4.3.4 Turkey
- 5.4.3.5 Rest of Middle East & Africa
- 5.4.4 North America
- 5.4.4.1 Canada
- 5.4.4.2 Mexico
- 5.4.4.3 United States
- 5.4.4.4 Rest of North America
- 5.4.5 South America
- 5.4.5.1 Argentina
- 5.4.5.2 Brazil
- 5.4.5.3 Rest of South America
- 5.4.1 Asia-Pacific
6 COMPETITIVE LANDSCAPE
- 6.1 Key Strategic Moves
- 6.2 Market Share Analysis
- 6.3 Company Landscape
- 6.4 Company Profiles
- 6.4.1 BMS Micro-Nutrients NV
- 6.4.2 Grupa Azoty S.A. (Compo Expert)
- 6.4.3 ICL Group Ltd
- 6.4.4 Indian Farmers Fertiliser Cooperative Limited
- 6.4.5 Nortox
- 6.4.6 Safsulphur
- 6.4.7 Sociedad Quimica y Minera de Chile SA
- 6.4.8 Yara International ASA
7 KEY STRATEGIC QUESTIONS FOR FERTILIZER CEOS
8 APPENDIX
- 8.1 Global Overview
- 8.1.1 Overview
- 8.1.2 Porter's Five Forces Framework
- 8.1.3 Global Value Chain Analysis
- 8.1.4 Market Dynamics (DROs)
- 8.2 Sources & References
- 8.3 List of Tables & Figures
- 8.4 Primary Insights
- 8.5 Data Pack
- 8.6 Glossary of Terms
 全球液体肥料市场报告(2026 年)
 按作物类型、包装规格、应用、最终用途和销售管道的多元素水溶性液体肥料市场—2026-2032年全球预测
 液态肥料市场规模、份额及成长分析(依作物类型、化合物、应用、类型及地区划分)-2026-2033年产业预测
 液体肥料市场-2025-2030年预测液体肥料市场按类型、作物、生产流程、应用和分销管道划分-2025-2032 年全球预测
 液体肥料市场-全球产业规模、份额、趋势、机会和预测,按类型、应用方式、成分类型、作物类型、地区和竞争情况划分,2020-2030 年
 液体肥料市场机会、成长动力、产业趋势分析及2025-2034年预测
 2025-2033年液体肥料市场报告(按类型、生产流程、作物、施用方式和地区)
 北美液体肥料:市场占有率分析、行业趋势和统计、成长预测(2025-2030 年)欧洲液体肥料:市场占有率分析、行业趋势和成长预测(2025-2030 年)