


 |
市场调查报告书
商品编码
1693542
亚太化肥:市场占有率分析、产业趋势与成长预测(2025-2030 年)Asia-Pacific Fertilizers - Market Share Analysis, Industry Trends & Statistics, Growth Forecasts (2025 - 2030) |
||||||
价格
※ 本网页内容可能与最新版本有所差异。详细情况请与我们联繫。
简介目录
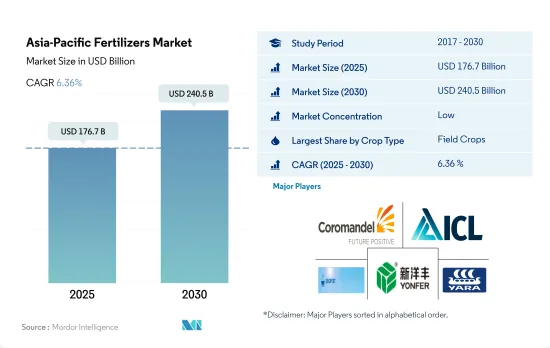
预计 2025 年亚太肥料市场规模为 1,767 亿美元,到 2030 年将达到 2,405 亿美元,预测期内(2025-2030 年)的复合年增长率为 6.36%。
集约化耕作和土壤养分消耗增加化肥消耗
- 亚太地区肥料市场以田间作物为主,约占整个肥料市场的81.5%。田间作物产量占该地区农业用地总面积的90.0%以上。该地区主要种植的田间作物、小麦、大豆、油菜籽和棉花。田间作物通常消耗最多的氮肥。谷物和谷类的种植密度很高,这会耗尽土壤养分,需要使用大量肥料来补充。
- 2022年,园艺作物占该地区肥料市值的17.9%。中国和印度占该地区园艺作物生产面积的70.0%以上。对新鲜水果和蔬菜的需求不断增加,加上满足这种需求的努力,将推动园艺作物市场的发展。
- 中国和印度拥有丰富的耕地和众多的人口,是亚太地区农业的主要参与企业。政府对农业机械化和生产力提高的大量资金支持进一步支撑了这一成长轨迹。
- 该地区的耕地面积正在大幅增加,预计2017年至2022年将增加1,050万公顷。农业是亚太地区经济的重要贡献者,为该地区五分之一的人口提供就业,涵盖该地区一半以上的土地面积。粮食安全的提高,加上气候条件的变化和土壤养分的挑战,将刺激该地区的化肥市场。
人口成长导致的粮食产量和生产力的提高可能会推动市场
- 根据美国农业部的数据,中国是全球最大的化肥生产国和出口国,占全球化肥产量的25%。 2022年中国化肥市场规模为703亿美元,消费量为9,420万吨。
- 印度是世界第二大化肥消费国,2022 年化肥消费量将达 8,140 万吨。儘管印度是世界第三大生产国,但每年仍有 25% 的尿素、55% 的磷和 100% 的钾需要进口。
- 印尼农业领域正在大幅扩张,耕地面积不断增加。该国的农业产量因此增加,并成为该地区农业的重要组成部分。因此,印尼是该地区市场价值和消费量的第三大消费国,占该地区市场价值的 5.6% 和消费量的 6.7%。
- 2022年,巴基斯坦在亚太化肥市场占有4.2%的份额。田间作物占肥料消费量的86.3%,其次是园艺作物,占13.5%,草皮和观赏作物仅占0.1%。这种趋势是由于田间作物种植面积扩大所致。
- 人口成长对粮食产量和生产力的要求更高,尤其是可供耕种的面积不断减少等因素预计将推动市场的发展。此外,采用先进的耕作方法将增加常规肥料和专用肥料的使用。
亚太地区肥料市场趋势
种植面积的增加是由于国内和出口需求的增加。
- 亚洲和太平洋地区种植田间作物,占总耕地面积的 95% 以上。水稻、小麦和玉米是该地区的主要田间作物,到2022年,这三种作物的种植面积总合该地区总种植面积的38%。预计种植面积的增加将增加该国对化肥的需求。
- 亚太地区包括中国、印度、巴基斯坦和澳大利亚,是世界上最大的小麦生产区之一。中国和印度分别是世界上最大的小麦生产国和消费国。小麦是该地区的主要主食之一,推动了需求和消费的成长。值得注意的是,2018年至2022年间,小麦种植面积增加了63.86万公顷。 2022年,中国小麦产量为1.38亿吨,成为全球最大的小麦生产国,而印度的小麦产量为1.03亿吨。
- 水稻是该地区最大的田间作物。到2022年,光是耕地面积就将占到农业用地总面积的约16.44%。水稻是亚洲和太平洋大部分地区的主食。预计2022年中国米产量为1.47亿吨,印度米产量为1.24亿吨。印度的消费量预计将达到 1.09 亿吨,出口量将达到 1,950 万吨,位居世界第一。
- 国内外对田间作物的需求迅速增长,促进了田间作物面积的扩大。预计耕地面积的大幅增加将在2023年至2030年期间对亚太地区化肥市场产生直接正面的影响。
全球农地氧化亚氮排放有28%来自中国农地。
- 2022年中国田间作物主要养分(氮、钾、磷)平均施用量为129.1公斤/公顷,其中氮占58.5%,钾占25.3%,磷占16.1%。主要营养物质主要透过土壤方法施用。 2022 年,传统土壤基主要营养素肥料占据主要营养素肥料市场的主导份额,为 69.2%。
- 由于亚洲土壤普遍缺乏基本养分,尤其是氮肥和钾肥,因此该地区对基本养分的需求很高。值得注意的是,亚太地区幅员辽阔,人口众多,农药生产和消费量居世界之冠。光是中国农地就占到全球农地氧化亚氮排放的约28%。
- 在田间作物中,小麦在 2022 年的平均主要养分施用量最高,为 214.9 公斤/公顷。在主要养分中,氮肥施用量最高,平均施用量为448.5公斤/公顷。对氮的需求如此之高是因为氮在植物代谢中的重要作用以及它存在于叶绿素和氨基酸中。
- 地表水和地下水受到氮和磷的污染,与施肥量指导不当以及作物产量过高有关。然而,人们已经明显转向采用高效肥料。
亚太化肥产业概况
亚太化肥市场细分化,前五大公司占5.83%。该市场的主要企业包括 Coromandel International Ltd.、ICL Group Ltd、中化化肥控股有限公司、新阳丰农业科技有限公司、Yara International ASA 等。
其他福利
- Excel 格式的市场预测 (ME) 表
- 3个月的分析师支持
目录
第一章执行摘要和主要发现
第二章 报告要约
第三章 引言
- 研究假设和市场定义
- 研究范围
- 调查方法
第四章 产业主要趋势
- 主要作物种植面积
- 田间作物
- 园艺作物
- 平均养分施用量
- 微量营养素
- 田间作物
- 园艺作物
- 主要营养素
- 田间作物
- 园艺作物
- 次要宏量营养素
- 田间作物
- 园艺作物
- 微量营养素
- 灌溉农田
- 法律规范
- 价值炼和通路分析
第五章市场区隔
- 类型
- 复合型
- 直的
- 微量营养素
- 硼
- 铜
- 铁
- 锰
- 钼
- 锌
- 其他的
- 氮
- 硝酸铵
- 无水氨
- 尿素
- 其他的
- 磷酸
- DAP
- MAP
- SSP
- TSP
- 其他的
- 钾
- MoP
- SoP
- 其他的
- 次要营养物质
- 钙
- 镁
- 硫
- 形式
- 传统的
- 特别的
- CRF
- 液体肥料
- SRF
- 水溶性
- 施肥方式
- 受精
- 叶面喷布
- 土壤
- 作物类型
- 田间作物
- 园艺作物
- 草坪和观赏植物
- 原产地
- 澳洲
- 孟加拉
- 中国
- 印度
- 印尼
- 日本
- 巴基斯坦
- 菲律宾
- 泰国
- 越南
- 其他亚太地区
第六章竞争格局
- 关键策略趋势
- 市场占有率分析
- 商业状况
- 公司简介
- Coromandel International Ltd.
- Grupa Azoty SA(Compo Expert)
- Haifa Group
- Hebei Sanyuanjiuqi Fertilizer Co., Ltd.
- ICL Group Ltd
- Sinofert Holdings Limited
- Sociedad Quimica y Minera de Chile SA
- Xinyangfeng Agricultural Technology Co., Ltd.
- Yara International ASA
- Zhongchuang xingyuan chemical technology co.ltd
第七章:CEO面临的关键策略问题
第 8 章 附录
- 世界概况
- 概述
- 五力分析框架
- 全球价值链分析
- 市场动态(DRO)
- 资讯来源及延伸阅读
- 图片列表
- 关键见解
- 数据包
- 词彙表
简介目录
Product Code: 92607
The Asia-Pacific Fertilizers Market size is estimated at 176.7 billion USD in 2025, and is expected to reach 240.5 billion USD by 2030, growing at a CAGR of 6.36% during the forecast period (2025-2030).
Intensive cultivation and soil nutrient depletion increase fertilizer consumption
- The Asia-Pacific fertilizer market is dominated by field crops, which make up around 81.5% of the overall fertilizer market. Field crop production accounts for more than 90.0% of the region's total agricultural land. The major field crops produced in the region are rice, wheat, soybean, rapeseed/canola, and cotton. Generally, field crops consume the most nitrogen fertilizers. Because grains and cereals are grown intensively, they deplete soil nutrients, necessitating the use of more fertilizers to compensate.
- In 2022, horticultural crops constituted 17.9% of the region's fertilizer market value. China and India command over 70.0% of the horticultural crop production area in the region. The rising demand for fresh fruits and vegetables, coupled with efforts to meet this demand, is poised to propel the horticultural crop market.
- China and India, with their abundant arable land and sizable populations, stand out as key agricultural players in the Asia-Pacific. The government's significant financial support for agricultural mechanization and productivity enhancement further bolsters this growth trajectory.
- The region has witnessed a notable uptick in cultivation area, with a 10.5 million ha expansion from 2017 to 2022. Agriculture employs a fifth of the region's population and occupies more than half of its land, making it a vital contributor to the Asia-Pacific economy. The imperative to enhance food security, coupled with evolving climatic conditions and soil nutrient challenges, is poised to fuel the fertilizer market in the region.
The growing population's need for higher food production and productivity may drive the market
- According to the USDA, China, the world's largest fertilizer producer and exporter, accounted for 25% of global fertilizer production. In 2022, the Chinese fertilizer market was valued at USD 70.3 billion, with a consumption of 94.2 million metric tons.
- India, the world's second-largest fertilizer consumer, consumed 81.4 million metric tons in 2022. Despite being the third-largest global producer, India relies on imports for 25% of its urea, 55% of its phosphorus, and 100% of its potash annually.
- The Indonesian agricultural sector has been experiencing a considerable expansion, which has led to an increase in arable land. This, in turn, has boosted the country's agricultural production, making it an essential player in the region's agricultural industry. As a result, Indonesia has become the third-largest consumer in terms of market value and volume consumption, accounting for 5.6% of the value and 6.7% of volume in the region.
- In 2022, Pakistan held a 4.2% share in the Asia-Pacific fertilizer market. Field crops dominated fertilizer consumption, accounting for 86.3% of the volume, followed by horticultural crops at 13.5% and turf & ornamental crops at a negligible 0.1%. This trend can be attributed to the larger land area dedicated to field crops.
- The market is expected to be driven by factors such as the growing population's need for higher food production and productivity, especially since the area available for cultivation is decreasing. Additionally, the adoption of advanced cultivation methods will increase the usage of both conventional and specialty fertilizers.
Asia-Pacific Fertilizers Market Trends
The increase in cultivation area is attributed to the growing domestic and export demand
- Field crop cultivation dominates the Asia-Pacific region, accounting for more than 95% of the total crop area. Rice, wheat, and corn are the major field crops produced in the region, together accounting for about 38% of the total crop area in 2022. The rising area under cultivation is expected to increase the need for fertilizer usage in the country.
- The Asia-Pacific region, which includes China, India, Pakistan, and Australia, is among the world's largest wheat producers. China and India are also the world's largest wheat producers and consumers. Wheat is one of the major staple foods of this region, driving the increase in demand and consumption. Notably, the area under wheat cultivation increased by 638.6 thousand ha from 2018 to 2022. In 2022, China accounted for the production of 138 million metric tons of wheat, making it the largest wheat producer in the world, and India recorded wheat production of 103 million metric tons.
- Rice is the largest cultivated field crop in the region. Its cultivation alone accounted for about 16.44% of the total agricultural land in 2022. Rice is the staple food of Asia and most parts of the Pacific region. China was projected to produce 147 million tons of rice, and India was expected to harvest 124 million tons of rice in 2022. India was also expected to consume 109 million tons while exporting a world-leading 19.5 million tons.
- The surge in both domestic and international demand for field crops has prompted an expansion in the cultivation area dedicated to these crops. This significant increase in cultivated land is expected to have a direct and positive impact on the Asia-Pacific fertilizer market throughout the 2023-2030 period.
About 28% of nitrous oxide emissions from cropland globally are from Chinese agricultural lands
- The average application rate of primary nutrients (nitrogen, potassium, and phosphorus) in field crops in China stood at 129.1 kg/ha in 2022. Nitrogen dominated the mix, accounting for 58.5%, followed by potassium at 25.3% and phosphorus at 16.1%. The primary nutrients are predominantly applied through soil-based methods. In 2022, conventional soil-based primary macronutrient fertilizers held a commanding 69.2% share of the primary macronutrient fertilizer market.
- Asia witnesses a significant demand for primary nutrients, especially nitrogen and potassium fertilizers, owing to the prevalent deficiencies in these nutrients in the region's soils. Notably, the Asia-Pacific region, with its vast land area and population, leads the global agrochemical production and consumption. China's agricultural lands alone contribute to about 28% of the world's nitrous oxide emissions from croplands.
- Among field crops, wheat recorded the highest average primary nutrient application rate at 214.9 kg/ha in 2022. Nitrogen took the lead among primary nutrients, with an average application rate of 448.5 kg/ha. This high nitrogen demand is attributed to its crucial role in plant metabolism, as well as its presence in chlorophyll and amino acids.
- The contamination of surface and groundwater with nitrogen and phosphorus has been linked to inadequate guidance on fertilizer application rates and the potential for excessive crop yields. However, there is a noticeable shift toward the adoption of highly efficient fertilizers.
Asia-Pacific Fertilizers Industry Overview
The Asia-Pacific Fertilizers Market is fragmented, with the top five companies occupying 5.83%. The major players in this market are Coromandel International Ltd., ICL Group Ltd, Sinofert Holdings Limited, Xinyangfeng Agricultural Technology Co., Ltd. and Yara International ASA (sorted alphabetically).
Additional Benefits:
- The market estimate (ME) sheet in Excel format
- 3 months of analyst support
TABLE OF CONTENTS
1 EXECUTIVE SUMMARY & KEY FINDINGS
2 REPORT OFFERS
3 INTRODUCTION
- 3.1 Study Assumptions & Market Definition
- 3.2 Scope of the Study
- 3.3 Research Methodology
4 KEY INDUSTRY TRENDS
- 4.1 Acreage Of Major Crop Types
- 4.1.1 Field Crops
- 4.1.2 Horticultural Crops
- 4.2 Average Nutrient Application Rates
- 4.2.1 Micronutrients
- 4.2.1.1 Field Crops
- 4.2.1.2 Horticultural Crops
- 4.2.2 Primary Nutrients
- 4.2.2.1 Field Crops
- 4.2.2.2 Horticultural Crops
- 4.2.3 Secondary Macronutrients
- 4.2.3.1 Field Crops
- 4.2.3.2 Horticultural Crops
- 4.2.1 Micronutrients
- 4.3 Agricultural Land Equipped For Irrigation
- 4.4 Regulatory Framework
- 4.5 Value Chain & Distribution Channel Analysis
5 MARKET SEGMENTATION (includes market size in Value in USD and Volume, Forecasts up to 2030 and analysis of growth prospects)
- 5.1 Type
- 5.1.1 Complex
- 5.1.2 Straight
- 5.1.2.1 Micronutrients
- 5.1.2.1.1 Boron
- 5.1.2.1.2 Copper
- 5.1.2.1.3 Iron
- 5.1.2.1.4 Manganese
- 5.1.2.1.5 Molybdenum
- 5.1.2.1.6 Zinc
- 5.1.2.1.7 Others
- 5.1.2.2 Nitrogenous
- 5.1.2.2.1 Ammonium Nitrate
- 5.1.2.2.2 Anhydrous Ammonia
- 5.1.2.2.3 Urea
- 5.1.2.2.4 Others
- 5.1.2.3 Phosphatic
- 5.1.2.3.1 DAP
- 5.1.2.3.2 MAP
- 5.1.2.3.3 SSP
- 5.1.2.3.4 TSP
- 5.1.2.3.5 Others
- 5.1.2.4 Potassic
- 5.1.2.4.1 MoP
- 5.1.2.4.2 SoP
- 5.1.2.4.3 Others
- 5.1.2.5 Secondary Macronutrients
- 5.1.2.5.1 Calcium
- 5.1.2.5.2 Magnesium
- 5.1.2.5.3 Sulfur
- 5.2 Form
- 5.2.1 Conventional
- 5.2.2 Speciality
- 5.2.2.1 CRF
- 5.2.2.2 Liquid Fertilizer
- 5.2.2.3 SRF
- 5.2.2.4 Water Soluble
- 5.3 Application Mode
- 5.3.1 Fertigation
- 5.3.2 Foliar
- 5.3.3 Soil
- 5.4 Crop Type
- 5.4.1 Field Crops
- 5.4.2 Horticultural Crops
- 5.4.3 Turf & Ornamental
- 5.5 Country
- 5.5.1 Australia
- 5.5.2 Bangladesh
- 5.5.3 China
- 5.5.4 India
- 5.5.5 Indonesia
- 5.5.6 Japan
- 5.5.7 Pakistan
- 5.5.8 Philippines
- 5.5.9 Thailand
- 5.5.10 Vietnam
- 5.5.11 Rest of Asia-Pacific
6 COMPETITIVE LANDSCAPE
- 6.1 Key Strategic Moves
- 6.2 Market Share Analysis
- 6.3 Company Landscape
- 6.4 Company Profiles
- 6.4.1 Coromandel International Ltd.
- 6.4.2 Grupa Azoty S.A. (Compo Expert)
- 6.4.3 Haifa Group
- 6.4.4 Hebei Sanyuanjiuqi Fertilizer Co., Ltd.
- 6.4.5 ICL Group Ltd
- 6.4.6 Sinofert Holdings Limited
- 6.4.7 Sociedad Quimica y Minera de Chile SA
- 6.4.8 Xinyangfeng Agricultural Technology Co., Ltd.
- 6.4.9 Yara International ASA
- 6.4.10 Zhongchuang xingyuan chemical technology co.ltd
7 KEY STRATEGIC QUESTIONS FOR FERTILIZER CEOS
8 APPENDIX
- 8.1 Global Overview
- 8.1.1 Overview
- 8.1.2 Porter's Five Forces Framework
- 8.1.3 Global Value Chain Analysis
- 8.1.4 Market Dynamics (DROs)
- 8.2 Sources & References
- 8.3 List of Tables & Figures
- 8.4 Primary Insights
- 8.5 Data Pack
- 8.6 Glossary of Terms
02-2729-4219
+886-2-2729-4219
 美国化肥:市场占有率分析、产业趋势与统计、成长预测(2026-2031)越南化肥:市场占有率分析、产业趋势与统计、成长预测(2026-2031)非洲化肥市场:市场占有率分析、产业趋势与统计、成长预测(2026-2031年)
 2026-2034年肥料市场规模、份额、趋势及预测(依产品类型、产品形态、作物类型及地区划分)
 化肥市场规模、份额和趋势分析报告:按类型、应用、地区和细分市场预测(2026-2033 年)
 2026年全球复合肥料市场报告2026年全球硼肥市场报告2026年全球螯合肥料市场报告
 肥料棒市场 - 全球产业规模、份额、趋势、机会及预测(按类型、应用、营养成分、分销管道、地区和竞争格局划分,2021-2031年)
 全球液态硫代硫酸铵市场按等级、作物类型、应用和销售管道划分 - 预测(2026-2032 年)
▼