


 |
市场调查报告书
商品编码
1693558
中东和非洲肥料:市场占有率分析、行业趋势和统计数据、成长预测(2025-2030 年)Middle East & Africa Fertilizers - Market Share Analysis, Industry Trends & Statistics, Growth Forecasts (2025 - 2030) |
||||||
※ 本网页内容可能与最新版本有所差异。详细情况请与我们联繫。
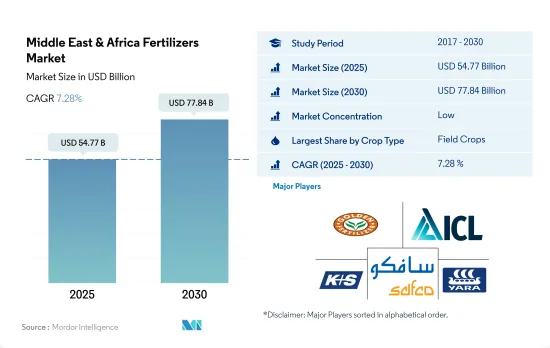
预计 2025 年中东和非洲肥料市场规模为 547.7 亿美元,到 2030 年将达到 778.4 亿美元,预测期内(2025-2030 年)的复合年增长率为 7.28%。
田间作物因种植面积大而占市场主导地位。
- 预计 2023 年至 2030 年期间,整个肥料市场的复合年增长率将达到 7.0%。农业是非洲最重要的经济活动。它们为非洲大陆约三分之二的劳动人口提供了就业机会,平均占非洲国家国内生产总值的30-60%和出口的30.0%。
- 非洲因其拥有丰富的可耕地而被视为重要的农业生产中心。然而,非洲只有6.0%的可耕地得到灌溉。 2018年,撒哈拉以南非洲地区的平均肥料消费量为每公顷17.0公斤,远低于全球平均的135.0公斤/公顷。
- 中东地区主要种植小麦、大麦等主粮作物。埃及和沙乌地阿拉伯在稻米、玉米、扁豆、鹰嘴豆、蔬菜和水果的生产方面也处于领先地位。另一方面,非洲拥有各种各样的蔬菜,包括番茄、洋葱、捲心菜、辣椒、秋葵、茄子和黄瓜。尤其是番茄和洋葱,在北非沿海地区种植十分丰富。受欢迎的饮料作物包括茶、咖啡、可可和葡萄。
- 农业部门在经济和社会发展中发挥着至关重要的作用,但尚未得到中东和北非地区政策制定者和相关人员的足够重视。儘管农业对 GDP 的贡献较低,但其对中东和北非国家永续的战略重要性预计将在未来几年推动化肥市场的发展。
人口成长和粮食安全问题正在推动市场发展,而这些问题需要透过在该地区使用化学肥料来解决。
- 该地区的肥料市场受到人口增长、粮食安全需求、集约化农业实践的采用以及土壤营养缺乏等因素的驱动。预计 2023 年至 2030 年的复合年增长率为 7.0%。
- 非洲是世界上人口最多的大陆,拥有广大的可耕地。例如,撒哈拉以南非洲地区居住着全球13%的人口,控制着全球约20%的农业用地。然而,该地区面临严重的粮食短缺问题,主要是由于对化学肥料的依赖增加。
- 奈及利亚将引领非洲化肥市场,到 2022 年将占 12.7% 的市场。奈及利亚拥有 70 多家混合厂和主要尿素生产设施,正迅速成为尿素市场上具有全球竞争力的化肥强国。产量的激增导致成本降低、供应增加,从而提高了农民的采用率。
- 众所周知,中东地区的气候条件不利于农业发展,严重依赖化肥进口来满足国内需求。因此,该地区的化肥采用率相对较高,可满足国内和国际需求。
- 肥料具有经济效益,可以持续提高产量,但由于供应有限和环境条件恶劣等挑战,肥料的使用量不断增加。该地区面临着满足不断增长的人口需求和确保粮食安全的迫切需要,进一步推动市场成长。
中东和非洲肥料市场趋势
风蚀和水蚀使雨养土地和灌溉土地都遭到破坏,对该地区的作物种植带来了挑战。
- 在中东和非洲,玉米、水稻、高粱和大豆等田间作物通常在四月至五月之间种植,九月至十月之间收穫。该地区的农业部门面临重大挑战。土地和水资源稀缺,雨养土地因风蚀和水蚀劣化,不可持续的农业实践使情况更加恶化。农田作物是农业的主要组成部分,约占该地区农业用地总面积的90%。 2022年,田间作物种植面积将达2.49亿公顷,比2017年增加3.9%。其中,玉米的种植面积较大,占田间作物总面积的17.8%。小麦种植面积也显着增加,预计2022年小麦种植面积将比2017年增加4.6%。其中,2022年该地区玉米种植面积将达4,430万公顷。
- 在非洲,奈及利亚是最大的高粱生产国,紧随其后的是衣索比亚。高粱是尼日利亚农业的主要作物,占该国谷物总产量的 50%,且占谷物生产土地面积的 45% 左右。高粱耐旱耐涝,适应各种土壤条件,是中东和非洲干旱地区保障粮食和收入安全的理想作物。
- 过去十年来该地区人口增加了23%以上。虽然由于生产能力有限,预计粮食进口量将会增加,但随着耕地面积的扩大,农业也呈现持续成长。
干旱天气加速了土壤中氮的消耗,而氮是农业生产力的关键营养素。
- 氮、磷和钾是植物生长必需的大量营养素。氮和磷是植物组织的主要成分—蛋白质和核酸所必需的。另一方面,钾对收穫作物的品质有显着的影响。田间作物平均每公顷获得174.4公斤主要养分。
- 其中,中东及非洲地区田间作物氮、磷、钾平均施用量分别为234.8公斤/公顷、127.4公斤/公顷、161.0公斤/公顷。中东和非洲主要种植小麦、高粱、水稻、玉米等田间作物。 2022年这些作物的主要养分平均施用量分别为144.5公斤/公顷、162.9公斤/公顷、152.6公斤/公顷和245.24公斤/公顷。
- 在主要营养元素中,氮将成为中东和非洲地区的主要消费量,到2022年将达到170万吨。氮是作物产量最重要的营养元素,由于该地区土壤普遍缺乏氮,氮是应用最广泛的肥料。这一优势是由于该地区耕作面积大,约占总面积的 95.0%,因此对主要营养物质的需求很高。强调自给自足和减少对进口的依赖是该地区田间作物市场成长的基础。
中东和非洲肥料行业概况
中东和非洲肥料市场较为分散,前五大企业占7.92%。该市场的主要企业有:Golden Fertilizer Company Limited、ICL Group Ltd、K+S Aktiengesellschaft、SABIC Agri-Nutrients Co. 和 Yara International ASA(按字母顺序排列)
其他福利
- Excel 格式的市场预测 (ME) 表
- 3个月的分析师支持
目录
第一章执行摘要和主要发现
第二章 报告要约
第三章 引言
- 研究假设和市场定义
- 研究范围
- 调查方法
第四章 产业主要趋势
- 主要作物种植面积
- 田间作物
- 园艺作物
- 平均养分施用量
- 微量营养素
- 田间作物
- 园艺作物
- 主要营养素
- 田间作物
- 园艺作物
- 次要宏量营养素
- 田间作物
- 园艺作物
- 微量营养素
- 灌溉农田
- 法律规范
- 价值炼和通路分析
第五章市场区隔
- 类型
- 复合型
- 直的
- 微量营养素
- 硼
- 铜
- 铁
- 锰
- 钼
- 锌
- 其他的
- 氮
- 硝酸铵
- 尿素
- 其他的
- 磷酸
- DAP
- MAP
- SSP
- TSP
- 其他的
- 钾
- MoP
- SoP
- 其他的
- 次要营养物质
- 钙
- 镁
- 硫
- 形式
- 传统的
- 特别的
- CRF
- 液体肥料
- SRF
- 水溶性
- 施肥方式
- 受精
- 叶面喷布
- 土壤
- 作物类型
- 田间作物
- 园艺作物
- 草坪和观赏植物
- 原产地
- 奈及利亚
- 沙乌地阿拉伯
- 南非
- 土耳其
- 其他中东和非洲地区
第六章竞争格局
- 关键策略趋势
- 市场占有率分析
- 商业状况
- 公司简介
- Foskor
- Gavilon South Africa(MacroSource, LLC)
- Golden Fertilizer Company Limited
- ICL Group Ltd
- K+S Aktiengesellschaft
- Kynoch Fertilizer
- SABIC Agri-Nutrients Co.
- Safsulphur
- Unikeyterra Chemical
- Yara International ASA
第七章:CEO面临的关键策略问题
第 8 章 附录
- 世界概况
- 概述
- 五力分析框架
- 全球价值链分析
- 市场动态(DRO)
- 资讯来源及延伸阅读
- 图片列表
- 关键见解
- 数据包
- 词彙表
The Middle East & Africa Fertilizers Market size is estimated at 54.77 billion USD in 2025, and is expected to reach 77.84 billion USD by 2030, growing at a CAGR of 7.28% during the forecast period (2025-2030).
Field crops dominated the market owing to their larger cultivation area
- The overall fertilizer market is estimated to register a CAGR of 7.0% from 2023 to 2030. Agriculture is by far the single most important economic activity in Africa. It provides employment for about two-thirds of the continent's working population, and for each country, it contributes an average of 30-60% of the gross domestic product and 30.0% of the value of exports.
- Africa is regarded as a key center of agricultural production because of the availability of arable land. However, only 6.0% of cultivated land in Africa is irrigated. In 2018, Sub-Saharan Africa's average fertilizer consumption stood at 17.0 kg of nutrients per hectare, significantly lower than the global average of 135.0 kg/ha.
- The Middle East predominantly cultivates staple crops like wheat and barley. Additionally, Egypt and Saudi Arabia lead in the production of rice, maize, lentils, chickpeas, vegetables, and fruits. Africa, on the other hand, boasts a diverse vegetable range, including tomatoes, onions, cabbages, peppers, okra, eggplants, and cucumbers. Notably, tomatoes and onions thrive in abundance along North Africa's coastal regions. Africa's notable beverage crops encompass tea, coffee, cocoa, and grapes.
- While the agricultural sector plays a pivotal role in economic and social development, it has not garnered sufficient attention from policymakers and stakeholders in the MENA region. Despite its modest GDP contribution, agriculture holds strategic importance for sustainable development in MENA countries, which is expected to fuel the fertilizers market in the coming years.
The growing population and concern regarding food security need to be addressed through fertilizer use in the region, drive the market
- The fertilizer market in the region is being propelled by factors such as a growing population, the need to ensure food security, the adoption of intensive agricultural practices, and nutrient deficiencies in regional soils. It is projected to witness a value CAGR of 7.0% during 2023-2030.
- Africa, with its vast arable land, boasts the highest population on the continent. For instance, the Sub-Saharan African region is home to 13% of the global population and controls roughly 20% of the world's agricultural land. However, the region grapples with significant food insecurity, largely due to its increasing reliance on fertilizers.
- Nigeria leads the fertilizer market in Africa, commanding a share of 12.7% in 2022. With over 70 blending plants and major urea production facilities, the country is poised to become a fertilizer powerhouse, even competing globally in the urea market. This surge in production has led to cost reductions and increased availability, driving higher adoption rates among farmers.
- The Middle East, known for its unfavorable climatic conditions for farming, heavily relies on fertilizer imports to meet its domestic needs. Consequently, the region witnesses a comparatively higher adoption of fertilizers to cater to both domestic and international demands.
- While fertilizers offer economic benefits and can boost yields sustainably, their usage is on the rise due to challenges like limited availability and adverse environmental conditions. The region's imperative to address the needs of a growing population and ensure food security further fuels the market's growth.
Middle East & Africa Fertilizers Market Trends
Deterioration of both rain-fed and irrigated lands due to erosion caused by wind and water will pose a challenge in cultivating crops in the region.
- In the Middle East and Africa, field crops such as corn, rice, sorghum, and soybeans are typically planted between April and May and harvested from September to October. The agricultural sector in this region faces significant challenges. Land and water resources are scarce, and both rain-fed and irrigated lands are deteriorating due to erosion from wind and water, exacerbated by unsustainable farming practices. Field crops dominate the agricultural landscape, occupying around 90% of the total agricultural land in the region. In 2022, the cultivation area for field crops reached 249 million hectares, marking a 3.9% increase from 2017. Corn alone commands a significant share, covering 17.8% of the total field crop area. Wheat cultivation also saw a notable increase, with a 4.6% increase from 2017 to 2022. Specifically, the corn cultivation area in the region reached 44.3 million hectares in 2022.
- In Africa, Nigeria takes the lead as the top sorghum producer, closely followed by Ethiopia. Sorghum, a staple cereal crop, dominates the agricultural landscape in Nigeria, accounting for 50% of the total cereal output and occupying approximately 45% of the land dedicated to cereal production. Sorghum's resilience to drought and waterlogging, coupled with its adaptability to diverse soil conditions, makes it a preferred choice for food and income security in the drier regions of the Middle East and Africa.
- The region's population has surged by over 23% in the past decade. While food imports are projected to rise due to limited production capacity, the agricultural industry has shown consistent growth, paralleled by an expansion in cultivated land.
The arid climate leads to a faster depletion of nitrogen in the soil, making it a crucial nutrient for agricultural productivity.
- Nitrogen, phosphorous, and potassium are primary nutrients crucial for plant growth. Nitrogen and phosphorous are integral to proteins and nucleic acids, key components of plant tissue. Meanwhile, potassium significantly influences the quality of harvested crops. Field crops, on average, receive an application rate of 174.4 kg per hectare for these primary nutrients.
- Specifically, the average application rates for nitrogen, phosphorous, and potassium in field crops across the Middle East & Africa stood at 234.8 kg/hectare, 127.4 kg/hectare, and 161.0 kg/hectare, respectively. The Middle East & Africa predominantly cultivate major field crops like wheat, sorghum, rice, and corn. In 2022, the average application rates for primary nutrients in these crops were 144.5 kg/hectare, 162.9 kg/hectare, 152.6 kg/hectare, and 245.24 kg/hectare, respectively.
- Of the primary nutrients, nitrogen dominates consumption in the Middle East & Africa, reaching 1.7 million metric tons in 2022. Nitrogen is the most crucial nutrient for crop yields, and given the prevalent deficiency of nitrogen in regional soils, it has become the most widely applied fertilizer. This dominance is driven by the region's substantial field crop area, comprising around 95.0% of the total, and the resulting high demand for primary nutrients. This emphasis on self-sufficiency and reducing import reliance underscores the growing market for field crops in the region.
Middle East & Africa Fertilizers Industry Overview
The Middle East & Africa Fertilizers Market is fragmented, with the top five companies occupying 7.92%. The major players in this market are Golden Fertilizer Company Limited, ICL Group Ltd, K+S Aktiengesellschaft, SABIC Agri-Nutrients Co. and Yara International ASA (sorted alphabetically).
Additional Benefits:
- The market estimate (ME) sheet in Excel format
- 3 months of analyst support
TABLE OF CONTENTS
1 EXECUTIVE SUMMARY & KEY FINDINGS
2 REPORT OFFERS
3 INTRODUCTION
- 3.1 Study Assumptions & Market Definition
- 3.2 Scope of the Study
- 3.3 Research Methodology
4 KEY INDUSTRY TRENDS
- 4.1 Acreage Of Major Crop Types
- 4.1.1 Field Crops
- 4.1.2 Horticultural Crops
- 4.2 Average Nutrient Application Rates
- 4.2.1 Micronutrients
- 4.2.1.1 Field Crops
- 4.2.1.2 Horticultural Crops
- 4.2.2 Primary Nutrients
- 4.2.2.1 Field Crops
- 4.2.2.2 Horticultural Crops
- 4.2.3 Secondary Macronutrients
- 4.2.3.1 Field Crops
- 4.2.3.2 Horticultural Crops
- 4.2.1 Micronutrients
- 4.3 Agricultural Land Equipped For Irrigation
- 4.4 Regulatory Framework
- 4.5 Value Chain & Distribution Channel Analysis
5 MARKET SEGMENTATION (includes market size in Value in USD and Volume, Forecasts up to 2030 and analysis of growth prospects)
- 5.1 Type
- 5.1.1 Complex
- 5.1.2 Straight
- 5.1.2.1 Micronutrients
- 5.1.2.1.1 Boron
- 5.1.2.1.2 Copper
- 5.1.2.1.3 Iron
- 5.1.2.1.4 Manganese
- 5.1.2.1.5 Molybdenum
- 5.1.2.1.6 Zinc
- 5.1.2.1.7 Others
- 5.1.2.2 Nitrogenous
- 5.1.2.2.1 Ammonium Nitrate
- 5.1.2.2.2 Urea
- 5.1.2.2.3 Others
- 5.1.2.3 Phosphatic
- 5.1.2.3.1 DAP
- 5.1.2.3.2 MAP
- 5.1.2.3.3 SSP
- 5.1.2.3.4 TSP
- 5.1.2.3.5 Others
- 5.1.2.4 Potassic
- 5.1.2.4.1 MoP
- 5.1.2.4.2 SoP
- 5.1.2.4.3 Others
- 5.1.2.5 Secondary Macronutrients
- 5.1.2.5.1 Calcium
- 5.1.2.5.2 Magnesium
- 5.1.2.5.3 Sulfur
- 5.2 Form
- 5.2.1 Conventional
- 5.2.2 Speciality
- 5.2.2.1 CRF
- 5.2.2.2 Liquid Fertilizer
- 5.2.2.3 SRF
- 5.2.2.4 Water Soluble
- 5.3 Application Mode
- 5.3.1 Fertigation
- 5.3.2 Foliar
- 5.3.3 Soil
- 5.4 Crop Type
- 5.4.1 Field Crops
- 5.4.2 Horticultural Crops
- 5.4.3 Turf & Ornamental
- 5.5 Country
- 5.5.1 Nigeria
- 5.5.2 Saudi Arabia
- 5.5.3 South Africa
- 5.5.4 Turkey
- 5.5.5 Rest of Middle East & Africa
6 COMPETITIVE LANDSCAPE
- 6.1 Key Strategic Moves
- 6.2 Market Share Analysis
- 6.3 Company Landscape
- 6.4 Company Profiles
- 6.4.1 Foskor
- 6.4.2 Gavilon South Africa (MacroSource, LLC)
- 6.4.3 Golden Fertilizer Company Limited
- 6.4.4 ICL Group Ltd
- 6.4.5 K+S Aktiengesellschaft
- 6.4.6 Kynoch Fertilizer
- 6.4.7 SABIC Agri-Nutrients Co.
- 6.4.8 Safsulphur
- 6.4.9 Unikeyterra Chemical
- 6.4.10 Yara International ASA
7 KEY STRATEGIC QUESTIONS FOR FERTILIZER CEOS
8 APPENDIX
- 8.1 Global Overview
- 8.1.1 Overview
- 8.1.2 Porter's Five Forces Framework
- 8.1.3 Global Value Chain Analysis
- 8.1.4 Market Dynamics (DROs)
- 8.2 Sources & References
- 8.3 List of Tables & Figures
- 8.4 Primary Insights
- 8.5 Data Pack
- 8.6 Glossary of Terms
 2026年全球生物炭肥料市场报告
 几丁质肥料市场:2026-2032年全球市场预测(按应用、类型、原料、配方和分销管道划分)肥料包膜市场:2026-2032年全球市场预测(以包膜化学、释放机制、包膜养分类型、外形规格、製造流程、最终用途及通路划分)化肥市场:2026-2032年全球市场预测(依产品类型、作物类型、包装、施用方法、最终用户和分销管道划分)复合肥料市场:按产品类型、作物类型、物理形态和应用分類的全球市场预测,2026-2032年藻类肥料市场:2026-2032年全球市场预测(依原料、产品类型、通路及应用划分)颗粒肥料市场:依产品类型、作物类型、配方类型、施用方法、包装类型、使用时间、最终用户和销售管道划分-2026-2032年全球预测
 硅肥市场报告:按类型、形态、应用和地区划分(2026-2034年)
 ATS肥料市场规模、份额和成长分析:按产品类型、形态、应用、作物类型、最终用户、分销管道和地区划分 - 2026-2033年行业预测
 美国化肥:市场占有率分析、产业趋势与统计、成长预测(2026-2031)