


 |
市场调查报告书
商品编码
1693621
亚太商用车:市场占有率分析、产业趋势与成长预测(2025-2030 年)Asia-Pacific Commercial Vehicles - Market Share Analysis, Industry Trends & Statistics, Growth Forecasts (2025 - 2030) |
||||||
价格
※ 本网页内容可能与最新版本有所差异。详细情况请与我们联繫。
简介目录
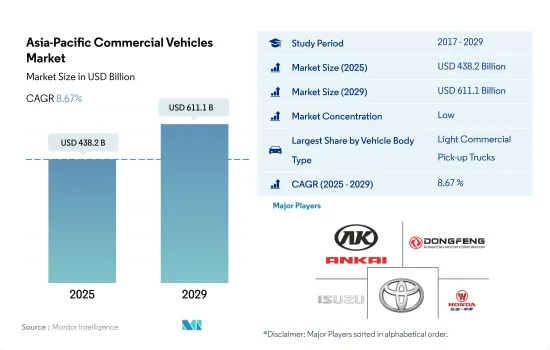
亚太商用车市场规模预计在 2025 年为 4,382 亿美元,预计到 2029 年将达到 6,111 亿美元,预测期内(2025-2029 年)的复合年增长率为 8.67%。
亚太地区作为全球商用车产业关键参与企业的重要性体现在其韧性、适应性和成长潜力。
- 亚太商用车市场的轻型商用皮卡车领域表现出韧性和稳定成长。从 2017 年的 4,624,010 辆开始,2018 年和 2019 年销量一度停滞不前。然而,接下来的几年销量显着增长,证明了对这些车辆的强劲需求。根据预测,到 2023 年,该细分市场的销量将达到 6,042,081 辆,显示出显着的復苏和成长轨迹。相较之下,轻型商用厢型车市场则从2017年的1,176,110辆下滑至2019年的885,614辆。自2019年以来,市场逐渐復苏,但尚未达到皮卡的步伐。 2023 年轻型商用货车的预测销售量为 1,082,025 辆,显示此类车辆的需求稳定但适中。
- 近年来,亚太商用车市场的中型商用卡车领域面临挑战。在 2017 年达到 461,391 辆的峰值之后,2019 年大幅下降至 327,819 辆。不过,也有令人鼓舞的復苏迹象,一些预测表明,到 2023 年这一数字将上升至 492,106 辆。在重型商用卡车领域,一个清晰的模式正在浮现。虽然 2017 年至 2021 年间数字有所波动,但整体趋势是上升的。 2017 年起,该细分市场的销量为 1,459,599 辆,2020 年达到高峰 1,754,298 辆。在 2021 年下滑之后,预计该细分市场将强劲復苏,2023 年销量预测为 2,318,219 辆。
- 最后,作为大众运输必不可少的公车领域,亚太市场的销量最初从 2017 年的 680,162 辆下降到 2019 年的 546,164 辆。然而,自 2019 年以来,这一数量已经稳定下来,预计将缓慢增长,到 2023 年将达到 709,944 辆。
亚太地区商用车註册量持续稳定成长,可望支撑该地区日益增长的物流和商业需求
- 工业生产以中国为中心转移,开闢了贸易管道,间接使商用车市场和物流业受益。由于物流和电子商务行业的成长,轻型商用车的需求预计会增加。中国不断增长的经济正在增加中阶的可支配收入,从而刺激了商用车和乘用车的需求。此外,过去五年来,中国的低生产成本推动了汽车需求的大幅成长。
- 受新冠疫情影响,亚太地区商用车市场遭遇挫折,地方政府对商业和旅游实施限制。这导致商用车销售量急剧下降。疫情导致消费者偏好转向低价产品,重塑了当地商用车市场。
- 儘管面临障碍,印度政府仍致力于开发共用、连网和电动交通的生态系统。预计这些努力将长期推动商用电动车的成长。预计到2030年,亚洲各国政府将在基础建设方面投资26兆美元,将大大增强亚太地区建筑材料和机械的流动。严格的污染法规迫使汽车製造商(OEM)转向电动车。随着人们对未来出行方式的理解不断加深,现代新兴企业和企业家越来越多地支持商用电动车。
亚太商用车市场趋势
受政府措施和商用车电气化推动,亚太地区电动车需求和销售快速成长
- 近年来,亚太地区电动车(EV)的需求和销售量激增。主要市场中国2022年电动车销量较2021年成长2.90%,日本同期电动车销量成长11.11%。推动这一趋势的因素包括日益增长的环境问题、严格的法规以及电动车的优势,例如燃油效率、降低维护成本和零碳排放。政府补贴进一步推动了亚洲国家对电动车的采用。
- 使用传统燃料的商用车辆,尤其是卡车和公共汽车,正在导致亚太国家污染水平上升。为此,该地区许多国家正在大力投资,将内燃机 (ICE) 汽车转型为电动车,以减少二氧化碳排放。例如,2020 年 12 月,印尼市政公车业者 Transjakarta 宣布了雄心勃勃的计划,到 2030 年将其电动公车车队扩大到 10,000 辆。类似这样的全部区域努力正在推动商用车的电气化。
- 亚太地区各国政府机构正积极提案逐步淘汰石化燃料汽车的措施,此举可望提振电动商用车市场。值得注意的进展是,2022 年 5 月,塔塔汽车赢得了一份政府合同,根据 FAME 2 计划,向印度供应 5,450 辆电动公车,价值 500 亿印度卢比。该公司还宣布计划向六家大型电子商务公司交付20,000 辆小型电动卡车。预计电动车领域的这些进步将在 2024 年至 2030 年间进一步推动亚太地区对电动商用车的需求。
亚太商用车产业概览
亚太商用车市场细分化,前五大企业占31.67%。市场的主要企业有安徽安凯汽车、东风汽车公司、五十铃汽车公司、丰田汽车公司、五菱汽车控股有限公司等。
其他福利
- Excel 格式的市场预测 (ME) 表
- 3个月的分析师支持
目录
第一章执行摘要和主要发现
第二章 报告要约
第三章 引言
- 研究假设和市场定义
- 研究范围
- 调查方法
第四章 产业主要趋势
- 人口
- 人均GDP
- 消费者汽车支出(cvp)
- 通货膨胀率
- 汽车贷款利率
- 电气化的影响
- 电动车充电站
- 电池组价格
- 新款 Xev 车型发布
- 物流绩效指数
- 燃油价格
- OEM生产统计
- 法律规范
- 价值炼和通路分析
第五章市场区隔
- 汽车模型
- 商用车
- 公车
- 大型商用卡车
- 轻型商用皮卡车
- 轻型商用厢型车
- 中型商用卡车
- 商用车
- 推进类型
- 混合动力和电动车
- 按燃料类别
- BEV
- FCEV
- HEV
- PHEV
- 内燃机
- 按燃料类别
- 天然气
- 柴油引擎
- 汽油
- LPG
- 混合动力和电动车
- 国家
- 澳洲
- 中国
- 印度
- 印尼
- 日本
- 马来西亚
- 韩国
- 泰国
- 其他亚太地区
第六章 竞争格局
- 关键策略趋势
- 市场占有率分析
- 商业状况
- 公司简介
- Anhui Ankai Automobile Co. Ltd.
- Daihatsu Motor Co. Ltd.
- Dongfeng Motor Corporation
- Ford Motor Company
- General Motors Company
- Great Wall Motor Company Ltd(GWM)
- Honda Motor Co. Ltd.
- Hyundai Motor Company
- Isuzu Motors Limited
- Kia Corporation
- Mazda Motor Corporation
- Mitsubishi Motors Corporation
- Nissan Motor Co. Ltd.
- Renault-Nissan-Mitsubishi Alliance
- Subaru Corporation
- Suzuki Motor Corporation
- Tata Motors Limited
- Toyota Motor Corporation
- Wuling Motors Holdings Limited
第七章:CEO面临的关键策略问题
第 8 章 附录
- 世界概况
- 概述
- 五力分析框架
- 全球价值链分析
- 市场动态(DRO)
- 资讯来源及延伸阅读
- 图片列表
- 关键见解
- 数据包
- 词彙表
简介目录
Product Code: 93009
The Asia-Pacific Commercial Vehicles Market size is estimated at 438.2 billion USD in 2025, and is expected to reach 611.1 billion USD by 2029, growing at a CAGR of 8.67% during the forecast period (2025-2029).
APAC's significance as a pivotal player in the global commercial vehicle industry is marked by resilience, adaptability, and growth potential
- The light commercial pickup trucks segment of the Asia-Pacific commercial vehicles market has been showcasing resilience and steady growth. Starting at 4,620,401 units in 2017, there was a brief lull in 2018 and 2019. However, subsequent years witnessed a notable uptick, underscoring a robust demand for these vehicles. Projections indicated that by 2023, this segment would hit 6,042,081 units, showcasing a remarkable recovery and growth trajectory. In contrast, the light commercial vans segment registered a decline from 1,176,110 units in 2017 to 885,614 units in 2019. While there has been a modest rebound since 2019, it has not matched the pace of pickup trucks. The forecast for 2023 stood at 1,082,025 units for light commercial vans, indicating a steady but moderate demand for these vehicles.
- The medium-duty commercial trucks segment of the Asia-Pacific commercial vehicles market has faced challenges in recent years. After peaking at 461,391 units in 2017, it experienced a significant drop to 327,819 units by 2019. However, there were positive signs of recovery, with projections indicating a rise to 492,106 units by 2023. In the heavy-duty commercial trucks segment, a distinct pattern emerges. While the figures fluctuated between 2017 and 2021, the overall trend has been upward. Starting at 1,459,599 units in 2017, there was a peak in 2020 at 1,754,298 units. Despite a dip in 2021, the segment rebounded strongly, with 2,318,219 units projected for 2023.
- Lastly, the buses segment, crucial for mass transit, initially saw a decline from 680,162 units in 2017 to 546,164 units in 2019 across the Asia-Pacific market. However, the post-2019 period has been marked by stabilization and gradual growth, with projections indicating a rise to 709,944 units by 2023.
Asia-Pacific is likely to continue witnessing a consistent increase in CV registrations, supporting the region's expanding logistical and commercial demands
- The relocation of industrial output, primarily to China, has opened up trade channels, indirectly benefiting the commercial vehicle market and the logistics sector. With the growth of the logistics and e-commerce sectors, the demand for LCVs is expected to rise. The expanding Chinese economy has led to an increase in disposable income for the middle class, driving up demand for both commercial and passenger vehicles. Additionally, the nation's low production costs have fueled a significant surge in automobile demand over the past five years.
- The Asia-Pacific commercial vehicles market faced a setback during the COVID-19 outbreak, with local authorities imposing restrictions on commerce and travel. This led to a sharp decline in commercial vehicle sales. The pandemic shifted consumer preferences toward low-cost goods, reshaping the local commercial vehicle market.
- Despite hurdles, the Indian government is committed to developing a shared, connected, and electric mobility ecosystem. Such initiatives are expected to drive the growth of commercial electric vehicles in the long term. Asian governments are projected to invest USD 26 trillion in infrastructure by 2030, significantly bolstering the transportation of construction materials and machinery across Asia-Pacific. Stringent pollution regulations have prompted automakers (OEMs) to pivot toward electric vehicles. With a growing understanding of the future of mobility, modern start-ups and entrepreneurs are increasingly favoring commercial electric vehicles.
Asia-Pacific Commercial Vehicles Market Trends
APAC's rapid electric vehicle demand and sales growth are driven by government initiatives and commercial vehicle electrification
- Electric vehicle (EV) demand and sales have surged in the APAC region in recent years. China, the dominant market, saw a 2.90% rise in electric car sales in 2022 compared to 2021, while Japan experienced an 11.11% increase during the same period. Factors driving this trend include mounting environmental concerns, stringent regulations, and the advantages of EVs, such as fuel efficiency, lower maintenance costs, and zero carbon emissions. Government subsidies further bolster the adoption of EVs in Asian nations.
- Conventional fuel-powered commercial vehicles, notably trucks and buses, are contributing to the escalating pollution levels in several Asia-Pacific countries. In response, many nations in the region are making substantial investments to transition their internal combustion engine (ICE) vehicles to electric ones, aiming to curb carbon emissions. For instance, in December 2020, TransJakarta, a city-owned bus operator in Indonesia, unveiled an ambitious plan to expand its electric bus (e-bus) fleet to 10,000 units by 2030. Such initiatives across the region are propelling the electrification of commercial vehicles.
- Government bodies in various APAC countries are actively proposing measures to phase out fossil fuel vehicles, a move that is poised to bolster the market for electric commercial vehicles. In a notable development, in May 2022, Tata Motors secured a government contract in India to supply 5,450 electric buses worth INR 5,000 crore under the FAME 2 scheme. Additionally, the company announced plans to deliver 20,000 light electric trucks to six major e-commerce players. These advancements in the EV space are anticipated to further fuel the demand for electric commercial vehicles in the APAC region from 2024 to 2030.
Asia-Pacific Commercial Vehicles Industry Overview
The Asia-Pacific Commercial Vehicles Market is fragmented, with the top five companies occupying 31.67%. The major players in this market are Anhui Ankai Automobile Co. Ltd., Dongfeng Motor Corporation, Isuzu Motors Limited, Toyota Motor Corporation and Wuling Motors Holdings Limited (sorted alphabetically).
Additional Benefits:
- The market estimate (ME) sheet in Excel format
- 3 months of analyst support
TABLE OF CONTENTS
1 EXECUTIVE SUMMARY & KEY FINDINGS
2 REPORT OFFERS
3 INTRODUCTION
- 3.1 Study Assumptions & Market Definition
- 3.2 Scope of the Study
- 3.3 Research Methodology
4 KEY INDUSTRY TRENDS
- 4.1 Population
- 4.2 GDP Per Capita
- 4.3 Consumer Spending For Vehicle Purchase (cvp)
- 4.4 Inflation
- 4.5 Interest Rate For Auto Loans
- 4.6 Impact Of Electrification
- 4.7 EV Charging Station
- 4.8 Battery Pack Price
- 4.9 New Xev Models Announced
- 4.10 Logistics Performance Index
- 4.11 Fuel Price
- 4.12 Oem-wise Production Statistics
- 4.13 Regulatory Framework
- 4.14 Value Chain & Distribution Channel Analysis
5 MARKET SEGMENTATION (includes market size in Value in USD and Volume, Forecasts up to 2029 and analysis of growth prospects)
- 5.1 Vehicle Type
- 5.1.1 Commercial Vehicles
- 5.1.1.1 Buses
- 5.1.1.2 Heavy-duty Commercial Trucks
- 5.1.1.3 Light Commercial Pick-up Trucks
- 5.1.1.4 Light Commercial Vans
- 5.1.1.5 Medium-duty Commercial Trucks
- 5.1.1 Commercial Vehicles
- 5.2 Propulsion Type
- 5.2.1 Hybrid and Electric Vehicles
- 5.2.1.1 By Fuel Category
- 5.2.1.1.1 BEV
- 5.2.1.1.2 FCEV
- 5.2.1.1.3 HEV
- 5.2.1.1.4 PHEV
- 5.2.2 ICE
- 5.2.2.1 By Fuel Category
- 5.2.2.1.1 CNG
- 5.2.2.1.2 Diesel
- 5.2.2.1.3 Gasoline
- 5.2.2.1.4 LPG
- 5.2.1 Hybrid and Electric Vehicles
- 5.3 Country
- 5.3.1 Australia
- 5.3.2 China
- 5.3.3 India
- 5.3.4 Indonesia
- 5.3.5 Japan
- 5.3.6 Malaysia
- 5.3.7 South Korea
- 5.3.8 Thailand
- 5.3.9 Rest-of-APAC
6 COMPETITIVE LANDSCAPE
- 6.1 Key Strategic Moves
- 6.2 Market Share Analysis
- 6.3 Company Landscape
- 6.4 Company Profiles
- 6.4.1 Anhui Ankai Automobile Co. Ltd.
- 6.4.2 Daihatsu Motor Co. Ltd.
- 6.4.3 Dongfeng Motor Corporation
- 6.4.4 Ford Motor Company
- 6.4.5 General Motors Company
- 6.4.6 Great Wall Motor Company Ltd (GWM)
- 6.4.7 Honda Motor Co. Ltd.
- 6.4.8 Hyundai Motor Company
- 6.4.9 Isuzu Motors Limited
- 6.4.10 Kia Corporation
- 6.4.11 Mazda Motor Corporation
- 6.4.12 Mitsubishi Motors Corporation
- 6.4.13 Nissan Motor Co. Ltd.
- 6.4.14 Renault-Nissan-Mitsubishi Alliance
- 6.4.15 Subaru Corporation
- 6.4.16 Suzuki Motor Corporation
- 6.4.17 Tata Motors Limited
- 6.4.18 Toyota Motor Corporation
- 6.4.19 Wuling Motors Holdings Limited
7 KEY STRATEGIC QUESTIONS FOR VEHICLES CEOS
8 APPENDIX
- 8.1 Global Overview
- 8.1.1 Overview
- 8.1.2 Porter's Five Forces Framework
- 8.1.3 Global Value Chain Analysis
- 8.1.4 Market Dynamics (DROs)
- 8.2 Sources & References
- 8.3 List of Tables & Figures
- 8.4 Primary Insights
- 8.5 Data Pack
- 8.6 Glossary of Terms
02-2729-4219
+886-2-2729-4219
 商用车市场:2026-2032年全球市场预测(依车辆类型、燃料类型、变速箱类型、负载容量、动力传动系统、应用和销售管道)
 商用车市场规模、份额和成长分析:按产品类型、动力系统、最终用途和地区划分-2026-2033年产业预测
 东协商用车:市场占有率分析、产业趋势与统计、成长预测(2026-2031)商用车空气悬吊系统市场(按车辆类型、零件类型、技术、应用和分销管道划分)-2026-2032年全球预测
 商用车市场-全球产业规模、份额、趋势、机会和预测,按车辆类型、应用类型、动力类型、地区和竞争格局划分,2021-2031年预测
 日本商用车市场报告(按车辆类型(巴士、重型商用卡车、轻型商用皮卡、轻型商用厢型车、中型商用卡车)、引擎类型(混合动力和电动车、内燃机)和地区划分,2026-2034 年)
 人工智慧及其在商用车市场的应用,全球(2024-2029)
 2025-2029年全球商用车市场
 商用车市场:依产品、最终用途及地区划分印度商用车市场:市场占有率分析、行业趋势和统计数据、成长预测(2025-2030 年)
▼