


 |
市场调查报告书
商品编码
1693755
北美生物防治剂:市场占有率分析、产业趋势与统计、成长预测(2025-2030 年)North America Biopesticides - Market Share Analysis, Industry Trends & Statistics, Growth Forecasts (2025 - 2030) |
||||||
价格
※ 本网页内容可能与最新版本有所差异。详细情况请与我们联繫。
简介目录
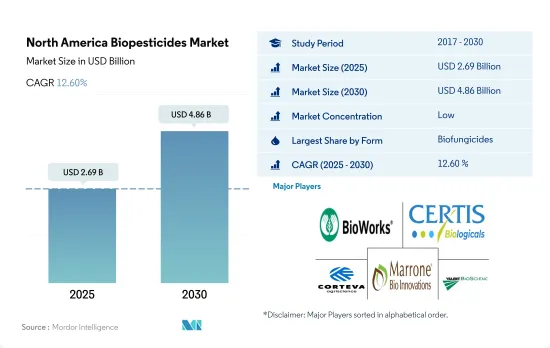
北美生物农药市场规模预计在 2025 年为 26.9 亿美元,预计到 2030 年将达到 48.6 亿美元,预测期内(2025-2030 年)的复合年增长率为 12.60%。
- 生物农药是施用于植物以预防由致病真菌引起的疾病的物质。生物农药要么来自微生物,要么植物来源。在北美,生物农药市场规模预计在2022年达到8.912亿美元,同年市场占有率为46.7%,是最受欢迎的生物农药类型。芽孢桿菌、木霉菌和假单胞菌等微生物种是市面上使用最广泛的生物农药。
- 预计2022年北美生物农药市值将达5.65亿美元,占29.6%,成为第二大消费量生物农药。此外,占有机农业面积最大的大田田间作物在2022年占生物农药使用量的73.5%。其次是园艺作物,占21.4%,经济作物占5%。
- 其他生物农药包括杀线虫剂、杀鼠剂、杀螨剂、杀软体动物剂等生物来源产品。这些生物农药在2022年的份额为16.08%,位居生物杀菌剂和生物杀虫剂之后的第三位。
- 预计2022年生物除草剂市场规模将达1.444亿美元,同年消费量将达9,900吨。生物除草剂是用于控制与作物生长竞争的杂草的微生物、植物抽取物或其他植物毒素,透过抑制杂草生长或阻止杂草种子发芽来控制。
- 由于农民对农药过度使用的认识不断提高,以及政府支持永续和有机农业实践的倡议,对生物农药的需求正在上升。因此,预计生物农药市场将在 2023-2029 年期间扩大。
- 北美生物农药市场主要由美国主导,2022 年占市场份额的 68.9%。这一增长归功于该国广阔的有机种植面积,占该地区作物作物总面积的 39.5%。连续作物也发挥重要作用,到 2022 年将占市场价值的 50.5%。
- 加拿大是该地区第二大生物农药市场,2022 年的市场占有率为 23.7%。该国有机作物种植面积正在扩大,将从2017年的40万公顷增加到2022年的45万公顷。预计这一趋势将持续下去,推动农业植物生物防治化学品市场的成长。
- 墨西哥是北美有机农业面积第二大的国家,2022年有机作物种植总面积为54万公顷,预计2029年将增加至61万公顷。有机作物种植面积的增加是生物农药需求的主要动力。
- 2022 年,北美其他地区的生物农药消费量量占不到 1.15%。然而,2017 年至 2022 年期间,该市场成长了 2.9%。预计 2023 年至 2029 年的复合年增长率为 9.2%。
- 由于农民对永续性的认识不断提高以及政府推动有机农业的倡议,预计北美生物农药市场在美国的成长速度将快于其他北美国家。对有机产品和永续农业的需求不断增长也可能推动未来几年生物农药市场的成长。
北美生物农药市场趋势
美国等主要国家对有机农产品的需求正在成长,政府的支持也有助于增加有机农产品的种植面积
- 根据FibL统计的数据,2021年北美作物有机种植面积达150万公顷。 2017年至2021年间,该地区有机种植面积增加了13.5%。在北美国家中,美国占据主导地位,有62.3万公顷农地用于有机农业,其中加州、缅因州和纽约州是实施有机农业的主要州。
- 紧随美国之后的是墨西哥,2021年有机农业用地面积达531,100公顷。墨西哥是全球前20大有机食品生产国之一。根据世界咖啡大师的数据,墨西哥是世界上最大的有机咖啡出口国。从有机咖啡种植者的数量来看,它是全国有机咖啡生产面积最大的国家。该国主要的有机食品生产州是恰帕斯州、瓦哈卡州、米却肯州、奇瓦瓦州和格雷罗州,占全国有机种植面积的80.0%。全国有机农业协会等组织正在该国推广有机农业,预计将激励更多农民从事有机农业。除了资金支持外,墨西哥政府也支持有机农业的研发活动。
- 加拿大作物作物面积从2017年的40万公顷增加到2021年的45万公顷。 2021年,行作物将占最大面积,达42万公顷。加拿大政府宣布,将于2021年向有机发展基金提供297,330美元,用于支持有机农民。这些努力有望增加该地区有机种植的面积。
国内外市场对有机农产品的需求不断成长,人均有机食品支出不断增加
- 2021年北美人均有机食品支出为109.7美元,其中美国人均支出最高,2021年平均支出为186.7美元。根据有机食品协会统计,2021年美国有机产品销售额超过630亿美元,与前一年同期比较成长2.0%,其中有机食品销售额达575亿美元。有机水果和蔬菜占有机产品总销售额的15.0%,2021年价值210亿美元。
- 根据加拿大有机联盟报告的数据,2020 年加拿大有机食品销售额达到 81 亿美元。加拿大是世界第六大有机产品市场,据报道,该国有机产品的供应量无法满足需求。 2021年有机食品人均支出为142.6美元。政府加大对零售商的支持力度,预计将提高该国有机产品的供应量、可近性和可负担性。有机塔尔德协会预测,2021 年至 2026 年间,加拿大有机产品市场将达到 6.3% 的复合年增长率。
- 2021年,墨西哥有机产品市场规模为6,300万美元,全球排名第35。根据有机贸易协会估计,2021年至2026年期间的复合年增长率为7.2%。然而,与该地区的其他国家相比,该国的人均有机产品支出较低,2021年为0.49美元。随着越来越多的参与企业进入墨西哥市场,预计该国对有机产品的需求将会增加。
北美生物农药产业概况
北美生物农药市场细分化,前五大公司占6.36%的市占率。该市场的主要企业包括 Bioworks Inc.、Certis USA LLC、Corteva Agriscience、Marrone Bio Innovations Inc.、Valent Biosciences LLC 等。
其他福利
- Excel 格式的市场预测 (ME) 表
- 3个月的分析师支持
目录
第一章执行摘要和主要发现
第二章 报告要约
第三章 引言
- 研究假设和市场定义
- 研究范围
- 调查方法
第四章 产业主要趋势
- 有机种植区
- 有机产品人均支出
- 法律规范
- 加拿大
- 墨西哥
- 美国
- 价值炼和通路分析
第五章市场区隔
- 形式
- 生物防治剂
- 生物除草剂
- 生物防治剂
- 其他生物防治剂
- 作物类型
- 经济作物
- 园艺作物
- 耕地作物
- 原产地
- 加拿大
- 墨西哥
- 美国
- 北美其他地区
第六章竞争格局
- 关键策略趋势
- 市场占有率分析
- 商业状况
- 公司简介
- AEF Global Biopesticides
- Andermatt Group AG
- BIOQUALITUM SA de CV
- Bioworks Inc.
- Certis USA LLC
- Corteva Agriscience
- Lallemand Inc.
- Marrone Bio Innovations Inc.
- Terramera Inc.
- Valent Biosciences LLC
第七章:CEO面临的关键策略问题
第 8 章 附录
- 世界概况
- 概述
- 五力分析框架
- 全球价值链分析
- 市场动态(DRO)
- 资讯来源及延伸阅读
- 图片列表
- 关键见解
- 数据包
- 词彙表
简介目录
Product Code: 500015
The North America Biopesticides Market size is estimated at 2.69 billion USD in 2025, and is expected to reach 4.86 billion USD by 2030, growing at a CAGR of 12.60% during the forecast period (2025-2030).
- Biofungicides are substances applied to plants to prevent diseases caused by pathogenic fungi. Biofungicides may be of microbial or botanical origin. In North America, the market for biofungicides was valued at USD 891.2 million in 2022, making them the most popular biopesticide type, with a 46.7% market share in the same year. Microbial species like Bacillus, Trichoderma, and Pseudomonas are the most available biofungicides in the market.
- The market for bioinsecticides in North America was valued at USD 565.0 million in 2022, with a share of 29.6%, making it the second most consumed biopesticide. Furthermore, the field crops with the largest area under organic agriculture accounted for 73.5% of bioinsecticide usage in 2022. Horticulture and cash crops followed with 21.4% and 5%, respectively, in the same year.
- Other biopesticides include products like nematicides, rodenticides, acaricides, and molluscicides of biological origin. These biological pesticides accounted for a share of 16.08% in 2022, occupying the third place after biofungicides and bioinsecticides.
- The market for biological herbicides was valued at USD 144.4 million in 2022, with a volume consumption of 9.9 thousand metric tons in the same year. Bioherbicides are microbes, plant extracts, or other phytotoxins used to manage weeds that compete with crops for growth by reducing weed growth or germinating weed seeds.
- The increasing awareness about the overuse of pesticides among farmers and the government initiatives to support sustainable agricultural practices and organic farming resulted in an increasing demand for biopesticides. Therefore, the market for biopesticides is anticipated to increase between 2023 and 2029.
- The North American biopesticides market is largely dominated by the United States, which accounted for 68.9% of the market value in 2022. This growth can be attributed to the country's vast organic cultivation area, which makes up 39.5% of the total organic crop area in the region. Row crops also play a significant role, which made up 50.5% of the market value in 2022.
- Canada was the second-largest biopesticides market in the region, with a market share of 23.7% in 2022. The country's organic crop farming area has been expanding, which grew from 400.0 thousand ha in 2017 to 450.0 thousand ha in 2022. This trend is expected to continue, driving growth in the agricultural plant biopesticides market.
- Mexico has the second-largest organic agricultural area in North America, with an overall organic crop area of 0.54 million ha in 2022, which is expected to increase to 0.61 million ha by 2029. This growth in organic crop areas is a key demand driver for biopesticides.
- The Rest of North America accounted for less than 1.15% of biopesticide consumption in 2022. However, the market grew by 2.9% between 2017 and 2022. It is projected to register a CAGR of 9.2% between 2023 and 2029.
- The North American biopesticides market is expected to grow faster in the United States than in other North American countries due to increased knowledge of sustainability among farmers and government measures promoting organic farming. The rising demand for organic products and sustainable agriculture practices may also drive growth in the biopesticides market in the coming years.
North America Biopesticides Market Trends
Organic produce demand grows in major countries like the United States, increasing cultivation area with government support
- The area under organic cultivation of crops in North America was recorded at 1.5 million ha in 2021, according to the data provided by FibL statistics. The area under organic cultivation in the region increased by 13.5% between 2017 and 2021. Among the North American countries, the United States is dominant, with 623.0 thousand ha of agricultural land under organic farming, with California, Maine, and New York being the major states practicing agriculture.
- The United States was followed by Mexico, with 531.1 thousand hectares of area under organic farming in 2021. Mexico is among the top 20 organic food producers in the world. Mexico is the largest exporter of organic coffee in the world, according to the Global Coffee Masters data. The country has the largest area under organic coffee production in terms of the number of organic coffee producers in the country. The major organic food-producing states in the country include Chiapas, Oaxaca, Michoacan, Chihuahua, and Guerrero, which account for 80.0% of the total organic area in the country. Organizations such as the National Association for Organic Agriculture are promoting organic agriculture in the country, which is expected to motivate more farmers to take up organic agriculture. In addition to financial assistance, the Mexican government supports research and development activities to help organic agriculture.
- Canada's area under organic crop cultivation increased from 0.4 million ha in 2017 to 0.45 million ha in 2021. Row crops occupied the maximum area with 0.42 million in 2021. The Canadian government announced a sum of USD 297,330 in 2021 as Organic Development Fund to support organic farmers. These initiatives are expected to increase the organic area in the region.
Growing demand for organic produce in domestic and international markets, rise in per capita spending on organic food
- The average per capita spending on organic food products in North America was USD 109.7 in 2021. The per capita spending in the United States is the highest among the North American countries, with average spending of USD 186.7 in 2021. The sales of organic products in the United States crossed USD 63.00 billion in 2021, according to the Organic Tarde Association, with a 2.0% increase over the previous year, with organic food sales standing at USD 57.5 billion in 2021. Organic fruits and vegetables accounted for 15.0% of the total organic product sales, with a value of USD 21.0 billion in 2021.
- Organic food sales in Canada reached a value of USD 8.10 billion in 2020, as per the data reported by the Organic Federation of Canada. It is reported that Canada is the sixth-largest market in the world for organic products, with the supply of organic products failing to keep up with the demand in the country. The average spending on organic food per person was USD 142.6 in 2021. Increasing government support to retailers is expected to increase the availability, accessibility, and affordability of organic products in the country. The Organic Tarde Association estimates that the organic products market in Canada is expected to register a CAGR of 6.3% between 2021 and 2026.
- In 2021, Mexico registered a market size of USD 63.0 million for organic products with a global rank of 35. According to the Organic Trade Association, it is estimated to register a CAGR of 7.2% between 2021 and 2026. However, the per capita spending on organic products in the country is less compared to other countries in the region, accounting for a value of USD 0.49 in 2021. More players entering the market in Mexico are expected to increase the demand for organic products in the country.
North America Biopesticides Industry Overview
The North America Biopesticides Market is fragmented, with the top five companies occupying 6.36%. The major players in this market are Bioworks Inc., Certis U.S.A. LLC, Corteva Agriscience, Marrone Bio Innovations Inc. and Valent Biosciences LLC (sorted alphabetically).
Additional Benefits:
- The market estimate (ME) sheet in Excel format
- 3 months of analyst support
TABLE OF CONTENTS
1 EXECUTIVE SUMMARY & KEY FINDINGS
2 REPORT OFFERS
3 INTRODUCTION
- 3.1 Study Assumptions & Market Definition
- 3.2 Scope of the Study
- 3.3 Research Methodology
4 KEY INDUSTRY TRENDS
- 4.1 Area Under Organic Cultivation
- 4.2 Per Capita Spending On Organic Products
- 4.3 Regulatory Framework
- 4.3.1 Canada
- 4.3.2 Mexico
- 4.3.3 United States
- 4.4 Value Chain & Distribution Channel Analysis
5 MARKET SEGMENTATION (includes market size in Value in USD and Volume, Forecasts up to 2030 and analysis of growth prospects)
- 5.1 Form
- 5.1.1 Biofungicides
- 5.1.2 Bioherbicides
- 5.1.3 Bioinsecticides
- 5.1.4 Other Biopesticides
- 5.2 Crop Type
- 5.2.1 Cash Crops
- 5.2.2 Horticultural Crops
- 5.2.3 Row Crops
- 5.3 Country
- 5.3.1 Canada
- 5.3.2 Mexico
- 5.3.3 United States
- 5.3.4 Rest of North America
6 COMPETITIVE LANDSCAPE
- 6.1 Key Strategic Moves
- 6.2 Market Share Analysis
- 6.3 Company Landscape
- 6.4 Company Profiles (includes Global Level Overview, Market Level Overview, Core Business Segments, Financials, Headcount, Key Information, Market Rank, Market Share, Products and Services, and Analysis of Recent Developments).
- 6.4.1 AEF Global Biopesticides
- 6.4.2 Andermatt Group AG
- 6.4.3 BIOQUALITUM SA de CV
- 6.4.4 Bioworks Inc.
- 6.4.5 Certis U.S.A. LLC
- 6.4.6 Corteva Agriscience
- 6.4.7 Lallemand Inc.
- 6.4.8 Marrone Bio Innovations Inc.
- 6.4.9 Terramera Inc.
- 6.4.10 Valent Biosciences LLC
7 KEY STRATEGIC QUESTIONS FOR AGRICULTURAL BIOLOGICALS CEOS
8 APPENDIX
- 8.1 Global Overview
- 8.1.1 Overview
- 8.1.2 Porter's Five Forces Framework
- 8.1.3 Global Value Chain Analysis
- 8.1.4 Market Dynamics (DROs)
- 8.2 Sources & References
- 8.3 List of Tables & Figures
- 8.4 Primary Insights
- 8.5 Data Pack
- 8.6 Glossary of Terms
02-2729-4219
+886-2-2729-4219
 生物杀线虫剂市场规模、份额和成长分析(按类型、剂型、应用方式、作物类型、虫害类型和地区划分)-产业预测,2025-2032年
 全球生物肥料和生物农药市场:预测至2032年-按产品类型、形态、应用方法、作物类型和地区分類的分析
 生物农药市场(按类型、作物、剂型、应用和销售管道)——2025-2030 年全球预测
 2025-2033年生物农药市场报告(依产品、剂型、来源、应用方式、作物种类及地区)
 2025年全球生物农药市场报告
 生物农药市场:2025 年至 2030 年预测
 细菌生物防治剂:市场占有率分析、产业趋势、统计数据、成长预测(2025-2030 年)2032年生物农药市场预测:按产品类型、作物类型、剂型、应用、最终用户和地区进行的全球分析日本生物农药市场报告(依产品类型(生物除草剂、生物杀虫剂、生物杀菌剂等)、应用领域(作物型、非作物型)及地区划分)2025-2033
 生物农药市场规模、份额及成长分析(按类型、来源、剂型、应用类型、作物类型和地区)-2025-2032 年产业预测
▼