


 |
市场调查报告书
商品编码
1693769
亚太农业生技药品-市场占有率分析、产业趋势与成长预测(2025-2030年)Asia-Pacific Agricultural Biologicals - Market Share Analysis, Industry Trends & Statistics, Growth Forecasts (2025 - 2030) |
||||||
※ 本网页内容可能与最新版本有所差异。详细情况请与我们联繫。
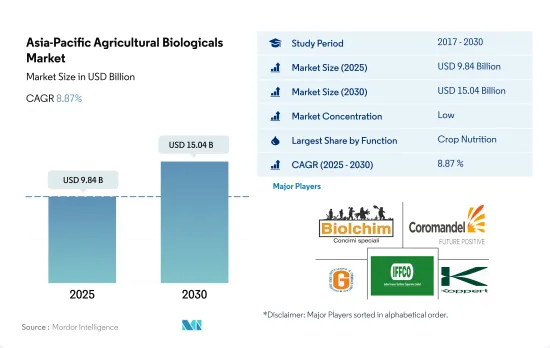
亚太地区农业生技药品市场规模预计在 2025 年为 98.4 亿美元,预计到 2030 年将达到 150.4 亿美元,预测期内(2025-2030 年)的复合年增长率为 8.87%。
- 在亚太地区,农业生技药品在永续农业中发挥关键作用。这些产品透过提供必要的营养和控制作物害虫和昆虫来减少化学肥料和杀虫剂的使用。该地区的农业生技药品市场正与前一年同期比较成长。 2017年至2022年,市场规模的复合年增长率为2.2%。
- 亚太地区对生物解决方案的需求主要受到欧盟等出口市场的推动,欧盟正在加强对某些传统农药使用的监管,以及当地消费者和客户对更永续种植食品的需求。因此,越来越多的生产商开始寻求替代解决方案。最有前景的部分是新鲜食用的高价值水果和蔬菜(如浆果和葡萄)和温室种植的作物。
- 亚太行动网络(PANAP)是农药行动网络五个区域中心之一,致力于开展有关农药对人类和环境有害影响的意识提升宣传活动,并推广基于生物多样性的生态农业。
- 中国、印度、澳洲和印尼等国家都已采用有机农业战略。中国和印度是该地区农业生技药品市场的领先国家,分别占50.5%和32.6%的份额。这些国家已经采取各种倡议,大力鼓励有机农业和农业生技药品的使用。例如,中国计划将作物和连续作物的农药使用量分别减少10%和5%。在印度,PKVY 和 MOVCDNER 等多项措施为农民提供财政援助,以购买用于有机农业的农业生技药品。
- 亚太地区是世界领先的有机农业生产地区之一。米、甘蔗、新鲜水果和蔬菜是该地区种植的主要有机作物。中国和印度是该地区主要的有机作物生产国,也是最大的有机产品消费市场。
- 2017年至2022年间,该地区的有机农业面积将大幅增加,从2017年的310万公顷增加到2022年的380万公顷。该地区的生技药品市场在过去一段时间内成长了10.1%,预计在预测期内将成长约65.1%,到2029年将达到138.1亿美元。
- 依国家划分,2022年中国分别占亚太农业生技药品市场的50.5%及78.6%。印度以32.6%的份额位居第二,而同年亚太其他地区占亚太地区生技药品市场总量的5.9%。
- 2022年,亚太地区连续作物消耗的生物肥料较多,占总市场价值的80.1%。这是因为田间作物是该地区许多国家的稳定食物来源,因此种植面积巨大。其次是经济作物(10.9%)和园艺作物(8.3%)。
- 作物种植面积不断增加以及对有机产品和肥料的需求不断增长,导致化学肥料使用量整体减少。预计作物生产的总体成本和政府鼓励有机农业的努力将在 2023 年至 2029 年期间推动亚太生技药品市场的发展。
亚太农业生技药品市场趋势
中国、印度、印尼和澳洲等国政府的支持日益增强,有助于推动该地区的有机农业
- 根据FiBL统计,2021年亚太地区有机农地面积将超过370万公顷,占全球有机农地面积的26.4%。此外,2017 年至 2022 年间,有机种植面积预计将增加 19.3%。截至 2020 年,该地区的有机生产者数量约为 183 万,其中印度以 130 万位居榜首。中国、印度、印尼和澳洲是该地区有机种植面积最大的国家。中国和印度等国家的政府部门正在不断推广有机农业,以减少作物种植对化学投入的依赖。例如,印度实施了「Paramparagat Krishi Vikas Yojana」和「全印度有机农业网路计画」(AI-NPOF)等计画。
- 2021年,中国占最大份额,为250万公顷,占66.1%,其次是印度,占19.3%,印尼,占1.5%,澳大利亚,占1.4%。所有有机农场种植的作物分为三类:连续作物、园艺作物、经济作物。该地区有机农地大部分为连作作物,2021 年达 250 万公顷,占 67.5%。该地区主要连作作物包括水稻、小麦、豆类、大豆和小米。
- 经济作物将占据第二大份额,到2021年将达到70万公顷,占有机农地的18.5%。全球对糖和有机茶等有机经济作物的需求正在增加。在全球范围内,中国和印度分别是最大的有机绿茶和有机红茶生产国。由于国际需求不断增长,该地区有机种植面积预计会增加。
澳洲是迄今为止人均有机产品支出最高的国家,而中国的有机食品市场正在大幅成长。
- 印度的有机产品远远落后于全球需求的 1.0%,2021 年的人均支出仅 0.08 美元。然而,随着人们越来越意识到食用有机食品的好处,以及对茶和有机果汁等有机产品的需求不断增长,印度将成为未来几年的潜在市场。预计到 2025 年将达到 1.533 亿美元。目前,该地区的有机市场高度分散,有机产品仅在少数超级市场和专卖店有售。
- 中国持续维持高于地区和全球平均的有机成长,2021 年成长 13.3%。预计这种正成长模式将持续下去,2023 年至 2029 年的平均复合年增长率为 7.1%。
- 预计有机产品将在中国经历强劲成长,2023 年至 2029 年期间的复合年增长率为 7.1%,到 2025 年总合将达到 64 亿美元。推动这一成长的因素包括年轻一代越来越重视有机产品,越来越多的职业母亲对有机婴儿食品的需求不断增长,以及人们越来越接受健康和保健趋势。预计消费者知识和购买意愿的提高将使人们更加了解该地区有机食品的可持续属性。人均收入的增加,加上消费者对消费有机食品重要性的认识不断提高,有可能增加亚太地区人均有机食品支出。
亚太农业生技药品产业概览
亚太农业生技药品市场细分化,前五大公司占6.21%。市场的主要企业包括 Biolchim SpA、Coromandel International Ltd、Gujarat State Fertilizers & Chemicals Ltd、Indian Farmers Fertiliser Cooperative Limited、Koppert Biological Systems Inc. 等。
其他福利
- Excel 格式的市场预测 (ME) 表
- 3个月的分析师支持
目录
第一章执行摘要和主要发现
第二章 报告要约
第三章 引言
- 研究假设和市场定义
- 研究范围
- 调查方法
第四章 产业主要趋势
- 有机种植区
- 有机产品人均支出
- 法律规范
- 澳洲
- 中国
- 印度
- 印尼
- 日本
- 菲律宾
- 泰国
- 越南
- 价值炼和通路分析
第五章市场区隔
- 功能
- 作物营养
- 生物肥料
- 固氮螺菌
- 固氮菌
- 菌根真菌
- 解磷细菌
- 根瘤菌
- 其他生物肥料
- 生物肥料
- 胺基酸
- 富里酸
- 腐植酸
- 蛋白质水解物
- 海藻萃取物
- 其他生物刺激素
- 有机肥
- 肥料
- 餐食基肥料
- 油饼
- 其他有机肥料
- 作物保护
- 生物防治剂
- 大型微生物
- 微生物
- 生物防治剂
- 生物真菌剂
- 生物除草剂
- 生物杀虫剂
- 其他生物防治剂
- 作物营养
- 作物类型
- 经济作物
- 园艺作物
- 耕地作物
- 原产地
- 澳洲
- 中国
- 印度
- 印尼
- 日本
- 菲律宾
- 泰国
- 越南
- 其他亚太地区
第六章竞争格局
- 关键策略趋势
- 市场占有率分析
- 商业状况
- 公司简介
- Biolchim SpA
- Coromandel International Ltd
- Genliduo Bio-tech Corporation Ltd
- Gujarat State Fertilizers & Chemicals Ltd
- Indian Farmers Fertiliser Cooperative Limited
- Koppert Biological Systems Inc.
- Novozymes
- Sustane Natural Fertilizer Inc.
- Valagro
- Valent Biosciences LLC
第七章:CEO面临的关键策略问题
第 8 章 附录
- 世界概况
- 概述
- 五力分析框架
- 全球价值链分析
- 市场动态(DRO)
- 资讯来源及延伸阅读
- 图片列表
- 关键见解
- 数据包
- 词彙表
The Asia-Pacific Agricultural Biologicals Market size is estimated at 9.84 billion USD in 2025, and is expected to reach 15.04 billion USD by 2030, growing at a CAGR of 8.87% during the forecast period (2025-2030).
- In the Asia-Pacific region, agricultural biologicals play a key role in sustainable agriculture. These products reduce the use of chemical fertilizers and pesticides by providing required nutrients and controlling pests and insects in crops. The agricultural biologicals market in the region is growing Y-o-Y. From 2017 to 2022, the market value grew by a CAGR of 2.2%.
- The demand for biological solutions in Asia-Pacific is being driven primarily by export markets such as the European Union, which is tightening regulations on the use of some conventional pesticides and local consumer and customer demand for more sustainably grown food. Thus, more growers are showing a growing interest in alternative solutions. The most promising segments are high-value fruits and vegetables (e.g., berries and grapes) eaten fresh and crops grown in greenhouses.
- PAN Asia Pacific (PANAP), one of five regional centers of the Pesticide Action Network, is creating an awareness campaign regarding the harmful effects of pesticides on humans and the environment and promoting biodiversity-based ecological agriculture.
- Countries such as China, India, Australia, and Indonesia are adopting organic farming strategies. China and India are the major countries holding shares of 50.5% and 32.6%, respectively, of the agricultural biologicals market in the region. These countries are implementing different initiatives to encourage organic farming and agricultural biologicals usage widely. For instance, China is planning to reduce 10% and 5% pesticide usage in horticultural crops and row crops, respectively. India, through many initiatives like PKVY and MOVCDNER, provides financial support to farmers to buy agricultural biologicals for organic farming.
- The Asia-Pacific region is one of the world's major organic producers. Rice, sugarcane, and fresh fruits and vegetables are among the major organic crops cultivated in the region. China and India are the region's main organic crop producers and have the highest organic product consumption markets.
- The area of the region that was organically farmed increased significantly between 2017 and 2022, rising from 3.1 million hectares in 2017 to 3.8 million hectares in 2022. The region's biologicals market increased by 10.1% during the historical period and is expected to increase by about 65.1% over the forecast period, reaching USD 13.81 billion by 2029.
- As an individual country, China dominated the Asia-Pacific agricultural biologicals market in 2022 by 50.5% of the market value and 78.6% of the market volume. India occupied second place with 32.6%, and the Rest of Asia-Pacific held 5.9% of the total Asia-Pacific biologicals market values the same year.
- In 2022, row crops in the Asia-Pacific region consumed more biological fertilizers, accounting for 80.1% of the total market value. This is due to the region's huge area under cultivation of field crops, as they are the stable food in many countries in the region. This is followed by cash crops and horticultural crops, which had 10.9% and 8.3% shares, respectively, in the same year.
- The rising trend in organic crop areas and the rising demand for organic products and organic fertilizers reduce overall chemical fertilizer use. The overall cost of crop production and government attempts to encourage organic farming are expected to drive the Asia-Pacific biologicals market between 2023 and 2029.
Asia-Pacific Agricultural Biologicals Market Trends
Growing government support in countries like China, India, Indonesia, and Australia, boosts organic farming in the region
- The area under organic agricultural land in the Asia-Pacific region was over 3.7 million hectares in 2021, representing 26.4% of the global organic area, as per FiBL statistics. Moreover, the organic area under cultivation witnessed a growth of 19.3% between 2017-2022. As of 2020, the region recorded around 1.83 million organic producers, with India topping the list with 1.3 million organic producers. China, India, Indonesia, and Australia are the major countries with large organic cultivation areas in the region. Government authorities in countries such as China and India constantly promote organic agriculture to reduce reliance on chemical inputs for crop cultivation. For instance, India has implemented schemes such as Paramparagat Krishi Vikas Yojana and the All India Network Programme on Organic Farming (AI-NPOF).
- In 2021, China accounted for the maximum share of 66.1% with 2.5 million hectares, followed by India, Indonesia, and Australia with 19.3%, 1.5%, and 1.4% shares, respectively. The crops grown in the total organic land can be divided into three types, namely row crops, horticultural crops, and cash crops. Row crops occupy a major share of organic agricultural land in the region, which accounted for a 67.5% share with 2.5 million hectares in 2021. The major row crops grown in the region include paddy, wheat, pulses, soybeans, and millets.
- Cash crops held the second largest share, with 0.7 million hectares in 2021, accounting for an 18.5% share of organic cropland. The demand for organic cash crops, such as sugar and organic tea, is increasing globally. Globally, China and India are the largest organic green and black tea producers, respectively. The growing international demand is expected to increase the organic acreages in the region.
Per capita spending on organic product predominant in Australia and China's organic food market growing significantly
- Organic products in India represent far less than 1.0% of the global value demand, with a per capita expenditure of just USD 0.08 in 2021. However, with people becoming more aware of the benefits of consuming organic food and the growth in demand for organic products in categories such as tea and organic juice, India represents a potential market over the coming years. It is expected to reach a value of USD 153.3 million by 2025. Currently, the market for organic goods in the region is very fragmented, with just a few supermarkets and specialty stores selling them, as only people from higher-income families are possible customers.
- China continues to show organic growth above the regional and global averages, posting a 13.3% expansion in 2021. A positive growth pattern is expected to continue, with China averaging a CAGR of 7.1% between 2023 and 2029.
- Organic products are anticipated to experience strong growth in China, registering a value CAGR of 7.1% between 2023 and 2029 and reaching a total of USD 6.4 billion by 2025. This growth can be attributed to an increasing emphasis on the importance of organic products among the younger generation, a rise in demand for organic baby food due to the growing number of mothers in the workforce, and the increasing adoption of the health and wellness trend. Growing consumer knowledge and buying motivations are expected to lead to a better understanding of the sustainable qualities of organic food in the region. Increased per capita income, along with increased consumer awareness of the importance of organic food intake, has the potential to raise per capita expenditure on organic food items in the Asia-Pacific region.
Asia-Pacific Agricultural Biologicals Industry Overview
The Asia-Pacific Agricultural Biologicals Market is fragmented, with the top five companies occupying 6.21%. The major players in this market are Biolchim SpA, Coromandel International Ltd, Gujarat State Fertilizers & Chemicals Ltd, Indian Farmers Fertiliser Cooperative Limited and Koppert Biological Systems Inc. (sorted alphabetically).
Additional Benefits:
- The market estimate (ME) sheet in Excel format
- 3 months of analyst support
TABLE OF CONTENTS
1 EXECUTIVE SUMMARY & KEY FINDINGS
2 REPORT OFFERS
3 INTRODUCTION
- 3.1 Study Assumptions & Market Definition
- 3.2 Scope of the Study
- 3.3 Research Methodology
4 KEY INDUSTRY TRENDS
- 4.1 Area Under Organic Cultivation
- 4.2 Per Capita Spending On Organic Products
- 4.3 Regulatory Framework
- 4.3.1 Australia
- 4.3.2 China
- 4.3.3 India
- 4.3.4 Indonesia
- 4.3.5 Japan
- 4.3.6 Philippines
- 4.3.7 Thailand
- 4.3.8 Vietnam
- 4.4 Value Chain & Distribution Channel Analysis
5 MARKET SEGMENTATION (includes market size in Value in USD and Volume, Forecasts up to 2030 and analysis of growth prospects)
- 5.1 Function
- 5.1.1 Crop Nutrition
- 5.1.1.1 Biofertilizer
- 5.1.1.1.1 Azospirillum
- 5.1.1.1.2 Azotobacter
- 5.1.1.1.3 Mycorrhiza
- 5.1.1.1.4 Phosphate Solubilizing Bacteria
- 5.1.1.1.5 Rhizobium
- 5.1.1.1.6 Other Biofertilizers
- 5.1.1.2 Biostimulants
- 5.1.1.2.1 Amino Acids
- 5.1.1.2.2 Fulvic Acid
- 5.1.1.2.3 Humic Acid
- 5.1.1.2.4 Protein Hydrolysates
- 5.1.1.2.5 Seaweed Extracts
- 5.1.1.2.6 Other Biostimulants
- 5.1.1.3 Organic Fertilizer
- 5.1.1.3.1 Manure
- 5.1.1.3.2 Meal Based Fertilizers
- 5.1.1.3.3 Oilcakes
- 5.1.1.3.4 Other Organic Fertilizers
- 5.1.2 Crop Protection
- 5.1.2.1 Biocontrol Agents
- 5.1.2.1.1 Macrobials
- 5.1.2.1.2 Microbials
- 5.1.2.2 Biopesticides
- 5.1.2.2.1 Biofungicides
- 5.1.2.2.2 Bioherbicides
- 5.1.2.2.3 Bioinsecticides
- 5.1.2.2.4 Other Biopesticides
- 5.1.1 Crop Nutrition
- 5.2 Crop Type
- 5.2.1 Cash Crops
- 5.2.2 Horticultural Crops
- 5.2.3 Row Crops
- 5.3 Country
- 5.3.1 Australia
- 5.3.2 China
- 5.3.3 India
- 5.3.4 Indonesia
- 5.3.5 Japan
- 5.3.6 Philippines
- 5.3.7 Thailand
- 5.3.8 Vietnam
- 5.3.9 Rest of Asia-Pacific
6 COMPETITIVE LANDSCAPE
- 6.1 Key Strategic Moves
- 6.2 Market Share Analysis
- 6.3 Company Landscape
- 6.4 Company Profiles (includes Global Level Overview, Market Level Overview, Core Business Segments, Financials, Headcount, Key Information, Market Rank, Market Share, Products and Services, and Analysis of Recent Developments).
- 6.4.1 Biolchim SpA
- 6.4.2 Coromandel International Ltd
- 6.4.3 Genliduo Bio-tech Corporation Ltd
- 6.4.4 Gujarat State Fertilizers & Chemicals Ltd
- 6.4.5 Indian Farmers Fertiliser Cooperative Limited
- 6.4.6 Koppert Biological Systems Inc.
- 6.4.7 Novozymes
- 6.4.8 Sustane Natural Fertilizer Inc.
- 6.4.9 Valagro
- 6.4.10 Valent Biosciences LLC
7 KEY STRATEGIC QUESTIONS FOR AGRICULTURAL BIOLOGICALS CEOS
8 APPENDIX
- 8.1 Global Overview
- 8.1.1 Overview
- 8.1.2 Porter's Five Forces Framework
- 8.1.3 Global Value Chain Analysis
- 8.1.4 Market Dynamics (DROs)
- 8.2 Sources & References
- 8.3 List of Tables & Figures
- 8.4 Primary Insights
- 8.5 Data Pack
- 8.6 Glossary of Terms
 农业生技药品市场-2025-2030年预测
 全球农业生技药品市场按类型、来源、配方、应用方式、作物类型和地区划分-预测至2030年
 农业生技药品市场预测至2032年:按产品类型、来源、作物类型、应用方法和地区分類的全球分析
 农业生物製药市场:按产品类型、应用、供应源类型、配方类型、作物类型、功能、最终用户和分销管道 - 2025-2030 年全球预测
 2025年全球农业生技药品市场报告
 农业生技药品市场分析及预测(至2034年):类型、产品、服务、技术、组件、应用、形式、最终用户、安装类型、设备
 日本农业生物製品市场报告(按类型、来源、应用模式、应用和地区)2025-2033全球农业生物製品市场研究报告-产业分析、规模、份额、成长、趋势及2025年至2033年预测
 中国农业生技药品:市场占有率分析、产业趋势与统计、成长预测(2025-2030年)农业生物製剂:市场占有率分析、产业趋势与统计、成长预测(2025-2030 年)