


 |
市场调查报告书
商品编码
1693774
亚太有机肥料:市场占有率分析、行业趋势和成长预测(2025-2030 年)Asia-Pacific Organic Fertilizer - Market Share Analysis, Industry Trends & Statistics, Growth Forecasts (2025 - 2030) |
||||||
※ 本网页内容可能与最新版本有所差异。详细情况请与我们联繫。
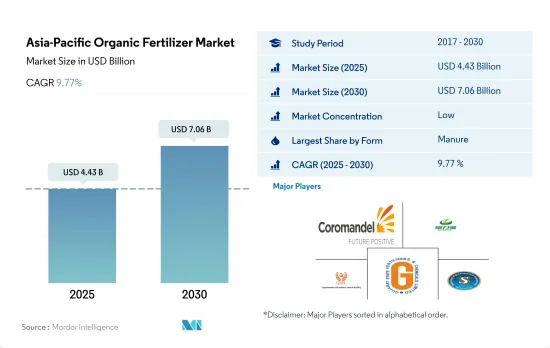
亚太有机肥料市场规模预计在 2025 年为 44.3 亿美元,预计到 2030 年将达到 70.6 亿美元,预测期内(2025-2030 年)的复合年增长率为 9.77%。
- 有机肥料是亚太地区消耗量最大的农业生物肥料。预计到2022年,有机肥料将占亚太地区农业生技药品市值的约45.8%,主要归功于其在有机和传统农业中的大规模使用。
- 在该地区,堆肥在传统农业和有机农业中都占主导地位,因为它适用于所有类型的作物,主要是田间作物、经济作物、水果和蔬菜,2022 年的市场规模为 16.7 亿美元。肥料也用于在播种前改善土壤的理化性质,并根据需要在作物生长的不同阶段使用。
- 2022 年,餐食基有机肥的消费量价值为 9.274 亿美元。这些肥料的养分含量高于粪肥。血粉和鹿角粉等粉状肥料的磷含量比其他粉状肥料高,是经济作物的理想选择。
- 2022年油饼有机肥消费量价值1,870万美元。这些肥料非常适合园艺作物,因为它们能缓慢释放营养。
- 印度和中国等该地区领先的农业国家已经启动了各种计画和方案来推广有机农业和永续农业投入的应用。 2023 年至 2029 年期间,有机作物种植面积的增加和对有机产品的需求的上升可能会推动亚太有机肥料市场的发展。
- 亚太地区正迅速成为全球有机农业和有机肥料市场的热门地点。全部区域主要种植作物、甘蔗、新鲜水果和蔬菜等有机作物。中国和印度正在成为有机生产领域的领导者。虽然这两个国家的有机农业面积很大,但有机农业占其农业总面积的比例仍不到2.0%。
- 近年来,该地区有机农业面积大幅增加,从2017年的490万公顷增加到2021年的690万公顷。这一成长趋势正在推动有机肥料的需求,预计到2029年将成长73.1%。
- 亚太地区大多数国家以连作物主,约占有机作物总面积的67.7%。这项优势将使连续作物成为有机肥料的最大消费量,到2022年将占亚太地区有机消费量的79.7%。
- 各政府机构透过各种计划和方案推广有机和永续农业实践,包括提供有机肥料补贴。预计这一趋势将推动该地区对有机肥料的需求。
- 亚太地区的有机农业和有机肥料市场正在显着成长。该地区有机农业面积的不断增加,加上政府的各种激励措施,预计将在 2023-2029 年期间推动该地区对有机肥料的需求。
亚太有机肥市场趋势
中国、印度、印尼和澳洲等国政府的支持日益增强,有助于推动该地区的有机农业
- 根据FiBL统计,2021年亚太地区有机农地面积超过370万公顷,占全球有机农地面积的26.4%。 2017年至2022年间,有机种植面积增加了19.3%。截至 2020 年,该地区共有 183 万家有机生产者,其中印度以 130 万家位居榜首。中国、印度、印尼和澳洲是该地区有机种植面积最大的国家。中国和印度等国家的政府部门正在不断推广有机农业,以减少作物种植对化学物质的依赖。例如,印度实施了「Paramparagat Krishi Vikas Yojana」和「全印度有机农业网路计画」(AI-NPOF)等计画。
- 2021年,中国以250万公顷的面积占最大份额,为66.1%,其次是印度,为19.3%,印尼,为1.5%,澳大利亚,为1.4%。所有有机农地分为三种作物类型:连续作物、园艺作物和经济作物。连作作物占该地区有机土地的最大份额,2021 年为 67.5%,即 250 万公顷。该地区种植的主要连作作物包括水稻、小麦、豆类、大豆和小米。
- 经济作物将占第二大份额,到2021年将达到70万公顷,占有机农地的18.5%。全球对糖和有机茶等有机经济作物的需求正在增加。中国和印度分别是有机绿茶和有机红茶的最大生产国。由于国际需求不断增长,该地区有机种植面积预计会增加。
澳洲人均有机产品支出最高,而中国有机食品市场成长迅速
- 2021 年该地区人均有机产品支出为 85.1 美元。同年,澳洲人均有机产品支出较高,为 58.3 美元,主要是由于消费者认为有机食品更健康,导致需求增加。根据全球有机贸易的数据,2021 年澳洲有机包装食品和饮料市场价值 8.852 亿美元。
- 预计2021年中国有机食品市场将成长13.3%,并将持续维持正成长模式,2023年至2029年的复合年增长率为7.1%。预计到2025年,有机市场规模将达到64亿美元,这得益于年轻一代越来越重视有机产品,以及由于职业母亲数量的增加和健康保健趋势的普及,对有机婴儿食品的需求不断增长。
- 印度的有机产品远远落后于全球需求的 1.0%,2021 年的人均支出仅 0.08 美元。然而,印度市场在未来几年可能会继续成长,到 2025 年将达到 1.533 亿美元。目前,该地区的有机市场高度分散,只有少数超级市场和专卖店销售有机产品。增加消费者知识和改变购买模式可能会让人们更了解该地区有机食品的永续性。人均收入的增加和消费者对有机食品重要性的认识的提高可能会推动亚太地区人均有机食品支出的增加。
亚太有机肥产业概况
亚太有机肥市场细分化,前五大公司占6.60%。市场的主要企业有 Coromandel International Ltd、Genliduo Bio-tech Corporation Ltd、Gujarat Narmada Valley Fertilizers & Chemicals Ltd、Gujarat State Fertilizers & Chemicals Ltd、Swaroop Agrochemical Industries 等。
其他福利
- Excel 格式的市场预测 (ME) 表
- 3个月的分析师支持
目录
第一章执行摘要和主要发现
第二章 报告要约
第三章 引言
- 研究假设和市场定义
- 研究范围
- 调查方法
第四章 产业主要趋势
- 有机种植区
- 有机产品人均支出
- 法律规范
- 澳洲
- 中国
- 印度
- 印尼
- 日本
- 菲律宾
- 泰国
- 越南
- 价值炼和通路分析
第五章市场区隔
- 形式
- 肥料
- 餐食基肥料
- 油饼
- 其他有机肥料
- 作物类型
- 经济作物
- 园艺作物
- 田间作物
- 原产地
- 澳洲
- 中国
- 印度
- 印尼
- 日本
- 菲律宾
- 泰国
- 越南
- 其他亚太地区
第六章竞争格局
- 关键策略趋势
- 市场占有率分析
- 商业状况
- 公司简介
- Biolchim SpA
- Coromandel International Ltd
- Deepak Fertilisers & Petrochemicals Corp. Ltd
- Genliduo Bio-tech Corporation Ltd
- Gujarat Narmada Valley Fertilizers & Chemicals Ltd
- Gujarat State Fertilizers & Chemicals Ltd
- Prabhat Fertilizer And Chemical Works
- Shandong Nongda Fertilizer Sci.& Tech. Co. Ltd(NDFY)
- Sustane Natural Fertilizer Inc.
- Swaroop Agrochemical Industries
第七章:CEO面临的关键策略问题
第 8 章 附录
- 世界概况
- 概述
- 五力分析框架
- 全球价值链分析
- 市场动态(DRO)
- 资讯来源及延伸阅读
- 图片列表
- 关键见解
- 数据包
- 词彙表
The Asia-Pacific Organic Fertilizer Market size is estimated at 4.43 billion USD in 2025, and is expected to reach 7.06 billion USD by 2030, growing at a CAGR of 9.77% during the forecast period (2025-2030).
- Organic fertilizers are the most consumed fertilizers in Asia-Pacific under agricultural biologicals. Organic fertilizers accounted for about 45.8% of the Asia-Pacific agriculture biologicals market value in 2022, mainly due to their application in bulk quantities in organic and conventional farming.
- Manure application was dominant in the region, valued at USD 1.67 billion in 2022, mainly due to its suitability to all types of crops, including field crops, cash crops, and fruits and vegetables, both in conventional and organic farming. Manures are also used to improve the physio-chemical properties of the soil before taking up the seed sowing and even at different growth stages of the crop based on the requirement.
- The consumption of meal-based organic fertilizers was valued at USD 927.4 million in 2022. These fertilizers have high nutrient content compared to manures. Meal-based fertilizers like blood and horn meal have higher phosphorus content compared to other meal-based fertilizers, and they are best suited for cash crops.
- The consumption value of oil cake organic fertilizers was valued at USD 18.7 million in 2022. These fertilizers are best suited in horticultural crops due to their slow release of nutrients.
- Major agricultural countries in the region, like India and China, have initiated various programs or schemes promoting organic farming and the application of sustainable agricultural inputs. The growing organic crop cultivation areas and the rising demand for organic commodities may drive the Asia-Pacific organic fertilizer market between 2023 and 2029.
- The Asia-Pacific region is rapidly becoming a hotspot in the global organic farming and organic fertilizer market. Major organic crops, like rice, sugarcane, and fresh fruits and vegetables, are grown across the region. China and India are emerging as leaders in organic production. While these two countries have a higher area under organic farming, it still accounts for less than 2.0% of the total agricultural area in these countries.
- The region has seen a significant increase in organic farming area over the last few years, growing from 4.9 million hectares in 2017 to 6.9 million hectares in 2021. This rising trend is driving the demand for organic fertilizers, which is estimated to increase by 73.1% by 2029.
- Row crops dominate most countries in the Asia-Pacific region, accounting for about 67.7% of the total organic crop area. This dominance resulted in row crops having the highest consumption of organic fertilizers, accounting for a 79.7% share of the Asia-Pacific region's consumption by value in 2022.
- Various government bodies are encouraging organic or sustainable farming methods through various schemes or programs, including offering incentives for organic fertilizers. This trend is expected to drive the demand for organic fertilizers in the region.
- The Asia-Pacific region is witnessing substantial growth in the organic farming and organic fertilizer market. The region's increasing organic farming area, combined with various government incentives, is expected to drive the demand for organic fertilizers in the region between 2023 and 2029.
Asia-Pacific Organic Fertilizer Market Trends
Growing government support in countries like China, India, Indonesia, and Australia, boosts organic farming in the region
- The area of organic agricultural land in Asia-Pacific was over 3.7 million ha in 2021, representing 26.4% of the global organic area, as per FiBL statistics. The organic area under cultivation grew by 19.3% between 2017-2022. As of 2020, the region had 1.83 million organic producers, with India topping the list with 1.3 million organic producers. China, India, Indonesia, and Australia are the major countries with large organic cultivation areas in the region. Government authorities in countries like China and India are constantly promoting organic agriculture to reduce reliance on chemical inputs for crop cultivation. For instance, India has implemented schemes like Paramparagat Krishi Vikas Yojana and the All India Network Programme on Organic Farming (AI-NPOF).
- In 2021, China accounted for a maximum share of 66.1%, with 2.5 million ha, followed by India, Indonesia, and Australia, with 19.3%, 1.5%, and 1.4%, respectively. The total organic land is divided into three crop types, namely row crops, horticultural crops, and cash crops. Row crops occupy a major share of organic agricultural land in the region, accounting for 67.5% share, i.e., 2.5 million ha in 2021. The major row crops grown in the region include paddy, wheat, pulses, soybeans, and millets.
- Cash crops held the second largest share, with 0.7 million ha in 2021, accounting for an 18.5% share of organic cropland. The demand for organic cash crops like sugar and organic tea is increasing worldwide. China and India are the largest organic green and black tea producers, respectively. The growing international demand is expected to increase the organic acreages in the region.
Per capita spending on organic product predominant in Australia and China's organic food market growing significantly
- The per capita spending on organic products in the region was recorded at USD 85.1 in 2021. Australia witnessed a higher per capita spending on organic products, with USD 58.3 in the same year, attributed to the higher demand due to consumers' perception of organic food as healthy. As per the Global Organic Trade data, the organic packaged food and beverage market in Australia was valued at USD 885.2 million in 2021.
- China's organic food market grew by 13.3% in 2021, and the positive growth pattern is expected to continue, with a CAGR of 7.1% between 2023 and 2029. With an increasing emphasis on the importance of organic products among the younger generation and the rising demand for organic baby food due to the growing number of mothers in the workforce and the increasing adoption of the health and wellness trend, organic products are expected to reach a value of USD 6.4 billion by 2025.
- Organic products in India represent far less than 1.0% of global demand, with a per capita expenditure of just USD 0.08 in 2021. However, the Indian market may grow over the coming years, reaching a value of USD 153.3 million by 2025. Currently, the region's organic goods market is highly fragmented, with just a few supermarkets and specialty stores selling them, as people from higher-income families are the only potential customers. Growing consumer knowledge and changing buying patterns may lead to a better understanding of organic food sustainability in the region. Increasing per capita income and increased consumer awareness of the importance of organic food can raise per capita expenditure on organic food items in the Asia-Pacific region.
Asia-Pacific Organic Fertilizer Industry Overview
The Asia-Pacific Organic Fertilizer Market is fragmented, with the top five companies occupying 6.60%. The major players in this market are Coromandel International Ltd, Genliduo Bio-tech Corporation Ltd, Gujarat Narmada Valley Fertilizers & Chemicals Ltd, Gujarat State Fertilizers & Chemicals Ltd and Swaroop Agrochemical Industries (sorted alphabetically).
Additional Benefits:
- The market estimate (ME) sheet in Excel format
- 3 months of analyst support
TABLE OF CONTENTS
1 EXECUTIVE SUMMARY & KEY FINDINGS
2 REPORT OFFERS
3 INTRODUCTION
- 3.1 Study Assumptions & Market Definition
- 3.2 Scope of the Study
- 3.3 Research Methodology
4 KEY INDUSTRY TRENDS
- 4.1 Area Under Organic Cultivation
- 4.2 Per Capita Spending On Organic Products
- 4.3 Regulatory Framework
- 4.3.1 Australia
- 4.3.2 China
- 4.3.3 India
- 4.3.4 Indonesia
- 4.3.5 Japan
- 4.3.6 Philippines
- 4.3.7 Thailand
- 4.3.8 Vietnam
- 4.4 Value Chain & Distribution Channel Analysis
5 MARKET SEGMENTATION (includes market size in Value in USD and Volume, Forecasts up to 2030 and analysis of growth prospects)
- 5.1 Form
- 5.1.1 Manure
- 5.1.2 Meal Based Fertilizers
- 5.1.3 Oilcakes
- 5.1.4 Other Organic Fertilizers
- 5.2 Crop Type
- 5.2.1 Cash Crops
- 5.2.2 Horticultural Crops
- 5.2.3 Row Crops
- 5.3 Country
- 5.3.1 Australia
- 5.3.2 China
- 5.3.3 India
- 5.3.4 Indonesia
- 5.3.5 Japan
- 5.3.6 Philippines
- 5.3.7 Thailand
- 5.3.8 Vietnam
- 5.3.9 Rest of Asia-Pacific
6 COMPETITIVE LANDSCAPE
- 6.1 Key Strategic Moves
- 6.2 Market Share Analysis
- 6.3 Company Landscape
- 6.4 Company Profiles (includes Global Level Overview, Market Level Overview, Core Business Segments, Financials, Headcount, Key Information, Market Rank, Market Share, Products and Services, and Analysis of Recent Developments).
- 6.4.1 Biolchim SpA
- 6.4.2 Coromandel International Ltd
- 6.4.3 Deepak Fertilisers & Petrochemicals Corp. Ltd
- 6.4.4 Genliduo Bio-tech Corporation Ltd
- 6.4.5 Gujarat Narmada Valley Fertilizers & Chemicals Ltd
- 6.4.6 Gujarat State Fertilizers & Chemicals Ltd
- 6.4.7 Prabhat Fertilizer And Chemical Works
- 6.4.8 Shandong Nongda Fertilizer Sci.&Tech. Co. Ltd (NDFY)
- 6.4.9 Sustane Natural Fertilizer Inc.
- 6.4.10 Swaroop Agrochemical Industries
7 KEY STRATEGIC QUESTIONS FOR AGRICULTURAL BIOLOGICALS CEOS
8 APPENDIX
- 8.1 Global Overview
- 8.1.1 Overview
- 8.1.2 Porter's Five Forces Framework
- 8.1.3 Global Value Chain Analysis
- 8.1.4 Market Dynamics (DROs)
- 8.2 Sources & References
- 8.3 List of Tables & Figures
- 8.4 Primary Insights
- 8.5 Data Pack
- 8.6 Glossary of Terms
 全球有机农药市场规模、份额、趋势和成长分析报告(2026-2034年)
 全球有机农药市场,2025-2029年
 全球有机肥料市场,2026-2030年
 有机肥料:市场占有率分析、产业趋势与统计、成长预测(2026-2031)全球有机肥料市场:市场规模、份额、成长率、产业分析、按类型、应用和地区划分的分析、未来预测(2026-2034)
 有机肥料市场规模、份额和成长分析(按来源、作物类型、形态、应用方法和地区划分)-2026-2033年产业预测
 有机农药市场规模、份额和成长分析(按产品类型、品种、剂型、应用和地区划分)-2026-2033年产业预测
 全球有机肥市场:预测(至2032年)-按来源、形态、营养成分、作物类型、施用方法、最终用户和地区进行分析
 有机农药市场依产品类型、作物类型、配方、施用方法及通路划分-2025-2032年全球预测有机肥料市场(按最终用户、销售管道、配方、产品形式、供应来源和应用划分)—2025-2032 年全球预测