


 |
市场调查报告书
商品编码
1693892
北美硅砂:市场占有率分析、产业趋势与成长预测(2025-2030 年)North America Silica Sand - Market Share Analysis, Industry Trends & Statistics, Growth Forecasts (2025 - 2030) |
||||||
价格
※ 本网页内容可能与最新版本有所差异。详细情况请与我们联繫。
简介目录
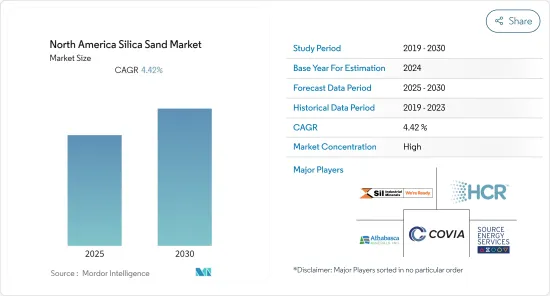
预计北美硅砂市场在预测期内的复合年增长率将达到 4.42%
关键亮点
- COVID-19 疫情对多个行业产生了不利影响。北美大部分地区的封锁扰乱了基础设施、建设活动、采矿作业和货运,扰乱了供应链。不过,2021年情况开始好转,市场恢復成长轨迹。
- 北美玻璃製造业的需求成长和铸造业的消费是推动研究市场成长的关键因素。
- 然而,非法开采沙和硅砂替代品的出现可能会抑制所研究市场的成长。
- 牙科和生物技术领域的沙基治疗的发展可能为所研究的市场提供丰厚的成长机会。
- 由于石油天然气和玻璃製造业的硅砂消耗量最高,美国是该地区最大的硅砂市场。
北美硅砂市场趋势
石油和天然气产业占市场主导地位
- 硅砂也被称为“水力压裂砂”,因其在水力压裂中的应用而得名,水力压裂是石油和天然气公司用来从页岩等传统型低储存储层中生产天然气、液态天然气和石油的一种完井方法。
- 在页岩压裂过程中,硅砂对于从岩石孔隙中释放天然气、石油和天然气液体至关重要。当高压水流将微小的孔眼推入较大的裂缝时,破碎的沙子会使这些裂缝保持打开状态,从而继续释放石化燃料。当使用白沙来打开这些裂缝时,它被称为支撑剂。支撑剂越能承受裂缝的巨大压力,就能开采越多的石油。可以开采更多的石油并最大限度地提高油井的效率。
- 美国和加拿大是世界上最大的石油和天然气生产国之一。加拿大是世界第四大石油生产国。加拿大的石油和天然气产业在 12 个省和地区有直接和间接的业务(包括海上业务)。
- 根据能源研究所《2023年世界能源统计评论》,2022年加拿大石油产量将达到2.74亿吨,占全球份额的6.2%。此外,这比与前一年同期比较的产量增加了近2.8%。
- 此外,据加拿大石油生产商协会称,预计到 2023 年加拿大的支出将增至 400 亿美元,比 2022 年增长 11%。预计到 2023 年,油砂投资将达到 115 亿美元,而传统型石油和天然气资本支出为 285 亿美元。
- 预计 2022 年北美原油和液体燃料总产量将达到每天 2,781 万桶,而 2021 年为每天 2,644 万桶。
- 美国是全球传统型原油蕴藏量探勘的主要国家之一,其探勘市场蕴藏着巨大的机会。
- 美国是世界上最大的石油和天然气消费国和出口国之一。根据美国能源资讯署 (EIA) 的数据,2022 年美国原油产量将平均达到 1,190 万桶/日,比 2021 年增加 70 万桶/日。此外,预计2023年的产量将超过1,280万桶/日,打破2019年创下的1,230万桶/日的年均产量纪录。
- 考虑到该地区石油和天然气产量的稳定增长,预测期内对硅砂的需求可能会扩大。
美国主导区域市场
- 石油和天然气产业是该国硅砂的主要消费者。根据美国能源资讯署的数据,2022 年原油产量为 1,190 万桶/日。预计到 2023 年这一数字将增至平均每天 1,241 万桶,到 2024 年将增至平均每天 1,280 万桶。为了满足日益增长的人口热量消耗和工业需求,预计需求将飙升。
- 近年来,美国对全谷硅的需求不断增加。新道路和建筑的发展促进了全谷二氧化硅市场的发展。
- 建筑业是硅砂的最大消费者之一。硅砂的物理特性与一般建筑用砂不同。硅砂的特性包括化学和物理特性的结合,例如二氧化硅含量高且有害杂质含量极低,因此近年来建筑业对硅砂的需求增加。
- 此外,根据美国人口普查局的统计数据,美国每年的新建筑投资预计将从 2021 年的 1.5 兆美元增加到 2022 年的 1.66 兆美元。
- 2022年美国住宅建筑年价值为8.4916亿美元,而2021年为7.4065亿美元。硅砂消费量短期内将会增加,2022年将达到8.0843亿美元,而2021年为7.5918亿美元。
- 铸造砂是一种高黏度的均质硅砂,用于生产黑色和非铁金属的模具和型芯。通常由80%以上的优质硅砂、5-10%的膨润土、2-5%的水、少于5%的海煤组成。石英砂中高含量的二氧化硅使铸造业能够生产出无缺陷且具有优良表面光洁度的高完整性铸件。汽车、建筑和电子等各行业对钢铁和铝的需求不断增加,预计将推动铸造厂对硅砂的消费。
- 随着建筑业的成长,国内陶瓷业也有望快速成长。根据美国商务部和北美磁砖委员会(TCNA)的数据,2022年美国磁砖总消费量为2.854亿平方公尺。 2022年国内磁砖产量约8,730万平方公尺,较2021年成长2.3%。
- 因此,考虑到该国各个终端用户产业的需求和成长,预计美国硅砂市场在未来几年将稳定成长。
北美硅砂产业概况
北美硅砂市场趋于整合。主要企业(排名不分先后)包括 Covia Holdings LLC、Hi-Crush Inc.、Source Energy Services Ltd.、Sil Industrial Minerals 和 Athabasca Minerals Inc.
其他福利
- Excel 格式的市场预测 (ME) 表
- 3个月的分析师支持
目录
第一章 引言
- 调查前提条件
- 研究范围
第二章调查方法
第三章执行摘要
第四章 市场动态
- 驱动程式
- 玻璃产业需求不断成长
- 铸造业消费增加
- 其他驱动因素
- 限制因素
- 替代产品的可用性
- 非法采砂
- 产业价值链分析
- 波特五力分析
- 供应商的议价能力
- 买家的议价能力
- 新进入者的威胁
- 替代品的威胁
- 竞争程度
第五章市场区隔
- 最终用户产业
- 玻璃製造
- 铸件
- 化学製造
- 建设业
- 油漆和涂料
- 陶瓷和耐火材料
- 滤
- 石油和天然气回收
- 其他终端用户产业(食品加工、工业磨料、运动领域)
- 地区
- 美国
- 加拿大
- 墨西哥
第六章竞争格局
- 併购、合资、合作与协议
- 市场占有率(%)**/排名分析
- 主要企业策略
- 公司简介
- Athabasca Minerals Inc.
- Atlas Sand Company, LLC
- Badger Mining Corporation
- Capital Sand Company
- Covia Holdings LLC
- Hi-Crush Inc.
- Sibelco
- Signal Peak Silica LLC
- Sil Industrial Minerals
- Source Energy Services Ltd.
- Superior Silica Sands
- US Silica
第七章 市场机会与未来趋势
- 水处理产业的未来机会
- 牙科和生物技术领域沙基治疗的发展
简介目录
Product Code: 50000792
The North America Silica Sand Market is expected to register a CAGR of 4.42% during the forecast period.
Key Highlights
- The COVID-19 pandemic affected several industries negatively. The lockdown in most countries in North America caused disruptions in infrastructure and construction activities, mining operations, and freight transportation which disturbed the supply chain. However, the conditions started recovering in 2021, restoring the market's growth trajectory.
- The growing demand from the glass production industry in North America and consumption in the foundry industry are major factors driving the growth of the market studied.
- However, the illegal mining of sand and the availability of substitutes for silica sand are likely to restrain the growth of the studied market.
- Nevertheless, the development of sand-based treatments in dentistry and biotechnology is likely to create lucrative growth opportunities for the studied market.
- The United States represents the largest market for silica sand in the region owing to the highest consumption of silica sand from the oil and gas and glass production industries.
North America Silica Sand Market Trends
Oil and Gas Industry to Dominate the Market
- Silica sand, also known as "frac sand," comes from its use in hydraulic fracturing, a completion method used by oil and gas companies to produce natural gas, natural gas liquids, and oil from unconventional, low permeability reservoirs such as shale.
- Silica sand is essential in the process of fracturing shale to release natural gas, oil, and natural gas liquids from pores in the rock. When the high-pressure water stream forces the small perforations to become larger fractures, fracking sand keeps these fractures open to continue releasing fossil fuels. When white sand is used to prop open these fractures, it is referred to as a proppant. The longer the proppant can withstand the enormous pressure of the fractures. The more petroleum can be extracted, maximizing the well's efficiency.
- The United States and Canada are among the world's largest Oil and Gas producers. Canada is the world's fourth-largest producer of oil. The Canadian oil and gas industry has direct and indirect operations (including offshore) in twelve provinces and territories.
- According to the Energy Institute Statistical Review of World Energy 2023, Canada's oil production in 2022 was 274 million tonnes, accounting for 6.2% of the global share. Further, this represents a nearly 2.8% increase in production over the previous year.
- Additionally, according to the Canadian Association of Petroleum Producers, spending in Canada is expected to rise to USD 40 billion in 2023, 11% more compared to 2022. Oil sands investment for 2023 is expected to reach USD 11.5 billion, whereas conventional oil and natural gas capital investment is projected at USD 28.5 billion.
- The total production of crude oil and liquid fuels in North America was 27.81 million barrels per day in 2022, compared to 26.44 million barrels per day in 2021.
- The United States is one of the leading countries globally in the exploration of unconventional crude oil reserves, indicating a massive opportunity for the studied market in the country.
- The United States is one of the world's largest consumers and exporters of oil and gas. According to U.S. Energy Information Administration (EIA), crude oil production in the United States was an average of 11.9 million barrels per day (b/d) in 2022, up 0.7 million b/d from 2021. Also, the output will is expected to exceed 12.8 million b/d in 2023, breaking the previous annual average record of 12.3 million b/d set in 2019.
- Considering the steady growth of oil and gas production in the region, the demand for silica sand is likely to grow during the forecast period.
United States to Dominate the Regional Market
- The oil and gas industry is the country's major consumer of silica sand. According to the US Energy Information Administration, the crude oil output was 11.9 million bpd (barrels per day) in 2022. This is estimated to average 12.41 million bpd by 2023 and 12.8 million bpd in 2024. With the increase in heat consumption by the population and to meet the industrial requirement, the demand is expected to surge.
- The demand for whole-grain silica has increased in the United States in recent years. The market for whole-grain silica is being boosted by the development of new roads and buildings.
- The construction industry is one of the largest consumers of silica sand. The physical properties of silica sands are different from the normal construction sands. The properties of silica sand include the combination of chemical and physical properties, such as high silica content and very low levels of deleterious impurities, for which the demand for silica sand has been increasing in the construction industry in recent times.
- Additionally, as per further statistics generated by the US Census Bureau, the annual value for new construction put in place in the United States accounted for USD 1.66 trillion in 2022, compared to USD 1.50 trillion in 2021.
- The annual value of residential construction put in place in the United States was valued at USD 849.16 million in 2022, compared to USD 740.65 million in 2021. The annual value of non-residential construction put in place in the country was valued at USD 808.43 million in 2022, compared to USD 759.18 million in 2021, thereby increasing the consumption of silica sand in the short term.
- Foundry sand is a uniform silica sand of high consistency that is used to produce molds and cores for ferrous and nonferrous metal castings. It typically comprises more than 80% high-quality silica sand, 5-10% bentonite clay, 2 to 5% water, and less than 5% sea coal. Because of the high silica levels of silica sand, the foundry industry can produce high-integrity castings, free of defects and with superior surface finishes. The rising demand for steel and aluminum in various industries, including automotive, construction, and electronics, is projected to boost the consumption of silica sand in the foundry.
- With the growing construction industry, the ceramic industry in the country is expected to grow rapidly. According to the US Department of Commerce and Tile Council of North America (TCNA), total ceramic tile consumption in the United States was 285.4 million square meters in 2022. The volume of domestically produced tile was around 87.3 million square meters in 2022, up 2.3% in 2021.
- Consequently, given the demand and growth across various end-user industries in the country, the silica sand market in the United States is forecasted to witness steady growth in the coming years.
North America Silica Sand Industry Overview
The North America silica sand market is consolidated in nature. The major players (not in any particular order) include Covia Holdings LLC, Hi-Crush Inc., Source Energy Services Ltd., Sil Industrial Minerals, and Athabasca Minerals Inc., among others.
Additional Benefits:
- The market estimate (ME) sheet in Excel format
- 3 months of analyst support
TABLE OF CONTENTS
1 INTRODUCTION
- 1.1 Study Assumptions
- 1.2 Scope of the Study
2 RESEARCH METHODOLOGY
3 EXECUTIVE SUMMARY
4 MARKET DYNAMICS
- 4.1 Drivers
- 4.1.1 Growing Demand from the Glass Industry
- 4.1.2 Increasing Consumption in the Foundry Industry
- 4.1.3 Other Drivers
- 4.2 Restraints
- 4.2.1 Availability of Substitutes
- 4.2.2 Illegal Mining of Sand
- 4.3 Industry Value Chain Analysis
- 4.4 Porter's Five Forces Analysis
- 4.4.1 Bargaining Power of Suppliers
- 4.4.2 Bargaining power of Buyers
- 4.4.3 Threat of New Entrants
- 4.4.4 Threat of Substitute Products and Services
- 4.4.5 Degree of Competition
5 MARKET SEGMENTATION (Market Size in Volume)
- 5.1 End-User Industry
- 5.1.1 Glass Manufacturing
- 5.1.2 Foundry
- 5.1.3 Chemical Production
- 5.1.4 Construction
- 5.1.5 Paints and Coatings
- 5.1.6 Ceramics and Refractories
- 5.1.7 Filtration
- 5.1.8 Oil and Gas Recovery
- 5.1.9 Other End User Industries (Food Processing, Industrial Abrasives and Sports Fields)
- 5.2 Geography
- 5.2.1 United States
- 5.2.2 Canada
- 5.2.3 Mexico
6 COMPETITIVE LANDSCAPE
- 6.1 Merger & Acquisitions, Joint Ventures, Collaborations, and Agreements
- 6.2 Market Share (%)**/Ranking Analysis
- 6.3 Strategies Adopted by Leading Players
- 6.4 Company Profiles
- 6.4.1 Athabasca Minerals Inc.
- 6.4.2 Atlas Sand Company, LLC
- 6.4.3 Badger Mining Corporation
- 6.4.4 Capital Sand Company
- 6.4.5 Covia Holdings LLC
- 6.4.6 Hi-Crush Inc.
- 6.4.7 Sibelco
- 6.4.8 Signal Peak Silica LLC
- 6.4.9 Sil Industrial Minerals
- 6.4.10 Source Energy Services Ltd.
- 6.4.11 Superior Silica Sands
- 6.4.12 U.S. Silica
7 MARKET OPPORTUNITIES AND FUTURE TRENDS
- 7.1 Future Opportunities in the Water Treatment Industry
- 7.2 Development of Sand-based Treatments in Dentistry and Biotechnology
02-2729-4219
+886-2-2729-4219
 亚太地区硅砂:市占率分析、产业趋势与统计、成长预测(2026-2031年)硅砂:市占率分析、产业趋势与统计、成长预测(2026-2031)
 2026-2034年依最终用途及地区分類的硅砂市场日本硅砂市场规模、份额、趋势和预测:按最终用途和地区划分,2026-2034年
 2026年全球硅砂市场报告
 全球硅砂市场按类型、纯度、粒径、应用、销售管道和终端用户产业划分,2026-2032年预测
 硅砂市场规模、份额和成长分析(按类型、粒度、纯度、等级、应用和地区划分)—产业预测(2026-2033 年)
 工业硅砂:全球市占率及排名、总收入及需求预测(2025-2031年)
 硅砂市场-全球产业规模、份额、趋势、机会及预测(按等级、应用、区域及竞争细分,2020-2030 年)
 全球硅砂市场:预测(2025-2030)
▼