


 |
市场调查报告书
商品编码
1842510
IT营运分析(ITOA):市场占有率分析、产业趋势、统计数据、成长预测(2025-2030)IT Operation Analytics (ITOA) - Market Share Analysis, Industry Trends & Statistics, Growth Forecasts (2025 - 2030) |
||||||
※ 本网页内容可能与最新版本有所差异。详细情况请与我们联繫。
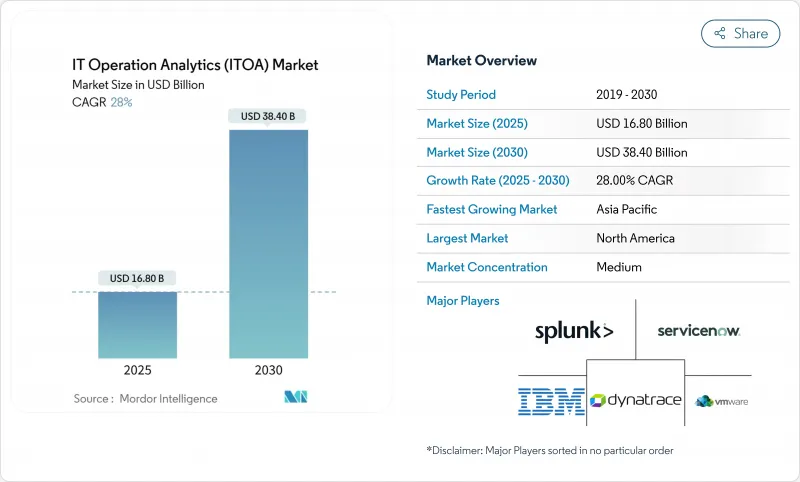
IT 营运分析 (ITOA) 市场预计在 2025 年达到 168 亿美元,在 2030 年达到 384 亿美元。
随着混合云端和多重云端应用的日益普及,企业正从被动监控转向人工智慧驱动的营运智能,以防止代价高昂的宕机。云端部署是预设架构,因为它们可以消除硬体开销并实现弹性扩展;而预测分析则透过将原始远端检测转换为预警讯号,从而降低关键业务工作负载的风险。金融服务领域监管审查的加强以及关键基础设施网路风险的上升,进一步加速了云端技术的采用。策略性併购也进一步增强了市场势头,尤其是思科以280亿美元收购了Splunk,该公司将深度资料包视觉性与高阶分析技术相结合,打造了一个端到端的洞察平台。
全球 IT 营运分析 (ITOA) 市场趋势与洞察
云端原生可观察性的采用推动了对即时 ITOA 的需求
随着云端优先架构将工作负载分散到容器、无伺服器功能和边缘节点,统一远端检测至关重要。采用现代可观测性平台的组织比使用传统工具的组织平均解决时间缩短了 45%。统一的管道将日誌、指标和追踪资料串流传输到单一资料平面,机器学习模型会在此标记异常并启动自动修復。与 DevOps 工作流程的紧密整合使工程师能够在运作之前检测到效能下降。这些功能结合,提高了服务可靠性,同时减少了事件噪音,从而推动了 IT 营运分析 (ITOA) 市场的发展。
从孤立的 ITOM 工具快速转变为整合的 AIOps 套件
企业传统上会同时使用 15-20 种独立的监控产品,造成警报疲劳和盲点。整合的 AIOps 套件打破了孤岛,并将 AI 应用于事件关联,将手动操作减少 90%,并将事件解决时间缩短 21%。随着混合架构增加资料来源数量,整合基础架构、应用程式和业务指标的一站式套件变得至关重要,这将挤压单点供应商的市场份额,并增强主导 IT 营运分析 (ITOA) 市场的平台能力。
资料工程和许可的初始成本高昂
启动一个全面的分析流程可能耗资超过 1000 万美元,其中包括资料湖、收费处理器和 AI 工具。每节点或每 GB 的收费系统会随着基础设施的成长而线性成长,这限制了预算的可预测性。中小企业进入 IT 营运分析市场的速度一直很慢,因为整体拥有成本占年度 IT 支出的 15-20%。虽然云端运算的 SaaS 模式可以降低资本支出,但长期订阅总合仍可与本地部署成本相提并论。
报告中分析的其他驱动因素和限制因素
- 混合云端环境中预测性故障预防的需求
- FinOps 授权推动成本感知分析的采用
- 站点可靠性/DevSecOps 技能短缺
細項分析
预计到2024年,云端交付将占据IT营运分析 (ITOA) 市场份额的71.3%,到2030年,复合年增长率将达到22.8%,这凸显了买家对无需硬体维护的託管服务的偏好。此模式可将部署交付前置作业时间缩短高达60%,并可根据波动的远端检测负载调整容量,从而在预测期内直接推动IT营运分析 (ITOA) 市场规模成长151亿美元。相较之下,在受严格监管且必须将资料锁定在特定管辖范围内的行业中,本地部署选项仍然占据主导地位。
由于主权要求,金融机构和公共部门组织维护本地堆迭,但即使是这些用户也越来越多地采用混合架构,将不太敏感的工作负载迁移到 SaaS AIOps 平台。超大规模企业正在透过将观察钩子直接整合到其基础设施即程式码模板中来增强其优势,从而进一步汇总买家支出。在边缘,轻量级收集器将摘要推送到云端核心,从而实现低延迟,同时保持集中式分析管治。
由于网路攻击在基于签章的工具启动之前利用了操作漏洞,安全性和网路监控将在 2024 年占据 IT 营运分析市场的 29.0%。融合的 SecOps 仪表板将资料包流和应用程式追踪关联起来,检测异常的速度比孤立模型快 50%,从而增强了与风险缓解相关的 IT 营运分析 (ITOA) 市场规模的优势。
以AIOps为中心的根本原因分析成长最快,复合年增长率达24.6%,这得益于AI主导的丛集能够丢弃重复警报并精准定位潜在故障。基础设施监控正朝着预测性容量规划的方向发展,业务服务监控将SLO违规与收益影响联繫起来,成为数位零售商在闪购高峰期备受追捧的功能。通讯业者正在利用5G网路数据分析功能将整体拥有成本降低45%,凸显了IT营运分析市场用例的广泛性。
IT营运分析 (ITOA) 市场配置(云端和本地)、应用(应用程式监控、业务和IT服务监控等)、最终用户产业(BFSI、医疗保健等)、分析类型(预测分析、根本原因分析等)和地区细分。市场预测以美元计算。
区域分析
到2024年,北美将引领IT营运分析 (ITOA) 市场,收入成长率将达到37.4%,这得益于成熟的DevOps文化、资金雄厚的风险投资生态系统以及联邦政府对云端迁移的津贴计画。随着Splunk、IBM和ServiceNow等领先供应商拥有密集的企业装置量,该地区的成长正从待开发区部署转向增值的AI扩展和跨领域整合。在零信任架构法规的推动下,分析预算将进一步成长,但随着第一批计划进入最佳化阶段,整体扩张速度正在放缓。
预计亚太地区将成长最快,到2030年复合年增长率将达到19.8%。世界各国政府都将人工智慧的应用定位为提升工业竞争力的槓桿,并鼓励製造商将现场营运技术 (OT) 流与IT遥测技术结合,以部署预测性维护。 43%的公司的AI投资意向预算成长超过20%,满足了庞大的分析需求。边缘原生架构、丰富的工程人才以及充满活力的新兴企业生态系统正在填补高级SRE领域的技能短缺,巩固该地区作为IT营运分析市场关键引擎的地位。
欧洲正在平衡创新与严格的资料主权法规,要求平台在实现在地化处理的同时,支援跨国协作分析。 《数位营运弹性法案》等立法正在推动采购标准向审核和管治发展,鼓励供应商添加策略感知资料路由功能。永续性指令正在推动用例的增加,企业利用分析技术来追踪资料中心内的能源消费量和碳足迹。儘管宏观经济成长放缓,但合规主导的支出正在推动全球IT营运分析市场的蓬勃发展。
其他福利:
- Excel 格式的市场预测 (ME) 表
- 3个月的分析师支持
目录
第一章 引言
- 研究假设和市场定义
- 调查范围
第二章调查方法
第三章执行摘要
第四章 市场状况
- 市场概况
- 市场驱动因素
- 云端原生可观察性的采用推动了对即时 ITOA 的需求
- 从孤立的 ITOM 工具快速迁移到统一的 AIOps 套件
- 混合云端环境中预测性故障预防的需求
- FinOps 授权推动成本感知分析的采用
- 主权云监管刺激区域ITOA
- 市场限制
- 资料工程和许可的初始成本高昂
- 站点可靠性/DevSecOps 技能短缺
- 日誌出口的资料居住限制阻碍了人工智慧训练
- 监管状况
- 技术展望
- 波特五力分析
- 新进入者的威胁
- 买方的议价能力
- 供应商的议价能力
- 替代品的威胁
- 竞争对手之间的竞争强度
第五章市场规模及成长预测
- 按部署
- 云端基础
- 本地部署
- 按用途
- 应用程式监控
- 业务和 IT 服务监控
- 基础设施监控
- 网路安全监控
- 按最终用户产业
- BFSI
- 卫生保健
- 通讯
- 零售与电子商务
- 工业和製造业
- 政府及公共机构
- 按分析类型
- 预测分析
- 根本原因分析
- 视觉/仪表板分析
- 行为分析
- 按地区(跨细分)
- 北美洲
- 美国
- 加拿大
- 墨西哥
- 欧洲
- 英国
- 德国
- 法国
- 义大利
- 其他欧洲国家
- 亚太地区
- 中国
- 日本
- 印度
- 韩国
- 亚洲其他地区
- 中东
- 以色列
- 沙乌地阿拉伯
- 阿拉伯聯合大公国
- 土耳其
- 其他中东地区
- 非洲
- 南非
- 埃及
- 其他非洲国家
- 南美洲
- 巴西
- 阿根廷
- 其他南美
- 北美洲
第六章 竞争态势
- 市场集中度
- 策略倡议
- 市占率分析
- 公司简介
- Splunk Inc.
- IBM Corporation
- ServiceNow Inc.
- VMware Inc.(Broadcom)
- Dynatrace Inc.
- Oracle Corporation
- BMC Software Inc.
- Micro Focus Intl. plc
- Cisco Systems Inc.
- AppDynamics LLC
- Elastic NV
- SAS Institute Inc.
- New Relic Inc.
- PagerDuty Inc.
- Datadog Inc.
- SolarWinds Corp.
- ManageEngine(Zoho)
- OpsRamp Inc.
- Evolven Software
- XpoLog Ltd.
第七章 市场机会与未来展望
The IT operations analytics market reached USD 16.8 billion in 2025 and is on course to hit USD 38.4 billion by 2030, reflecting a solid 17.9% CAGR.
Expansion is powered by enterprises re-tooling from reactive monitoring to AI-enabled operational intelligence that prevents costly outages in increasingly hybrid and multi-cloud estates. Cloud deployment is the default architecture because it eliminates hardware overhead and permits elastic scaling, while predictive analytics de-risks business-critical workloads by turning raw telemetry into early-warning signals. Intensifying regulatory scrutiny in financial services and heightened cyber-risk across critical infrastructure further amplify adoption. Market momentum is reinforced by strategic M&A, notably Cisco's USD 28 billion purchase of Splunk, which marries deep-packet visibility with advanced analytics to create end-to-end insight platforms.
Global IT Operation Analytics (ITOA) Market Trends and Insights
Cloud-Native Observability Adoption Accelerates Real-Time ITOA Demand
Cloud-first architectures fragment workloads across containers, serverless functions and edge nodes, making unified telemetry indispensable. Organizations that implement modern observability platforms record 45% faster mean-time-to-resolution than users of legacy tools. Integrated pipelines stream logs, metrics and traces into a single data plane, where machine-learning models flag anomalies and launch auto-remediation. Tight coupling with DevOps workflows lets engineers catch performance regressions before production cut-overs. Together these capabilities lift service reliability while shrinking incident noise, propelling the IT operations analytics market forward.
Rapid Shift from Siloed ITOM Tools to Unified AIOps Suites
Enterprises historically juggled 15-20 standalone monitoring products, breeding alert fatigue and blind spots. Consolidated AIOps suites collapse those silos and apply AI for event correlation, cutting manual operational effort by 90% and shrinking incident resolution time 21%.Centralized insight also trims vendor overhead and licensing complexity. As hybrid architectures multiply data sources, one-stop suites that fuse infrastructure, application and business metrics become essential, squeezing single-function vendors and reinforcing platform plays that dominate the IT operations analytics market.
High Initial Data-Engineering & Licensing Costs
Standing up full-scale analytics pipelines can top USD 10 million once data lakes, stream processors and AI tooling are counted. Fee structures that charge per node or per GB scale linearly with infrastructure growth, constraining budget predictability. Smaller enterprises see total cost of ownership absorb 15-20% of annual IT spend, delaying entry into the IT operations analytics market. Cloud SaaS models soften capex, but long-term subscription totals can still rival on-premise expense.
Other drivers and restraints analyzed in the detailed report include:
- Need for Predictive Outage Prevention in Hybrid-Cloud Estates
- FinOps Mandates Push Cost-Aware Analytics Adoption
- Shortage of Site-Reliability / DevSecOps Skillsets
For complete list of drivers and restraints, kindly check the Table Of Contents.
Segment Analysis
Cloud deliveries secured 71.3% of the IT operations analytics market share in 2024 and are forecast to rise at 22.8% CAGR through 2030, underscoring buyer preference for managed services that eliminate hardware upkeep. This model slashes deployment lead-times by up to 60% and aligns capacity with volatile telemetry loads, directly enlarging the IT operations analytics market size by USD 15.1 billion over the forecast window. In contrast, on-premise options persist in heavily regulated verticals that must anchor data within jurisdictional borders.
Financial institutions and public agencies retain local stacks for sovereignty mandates, yet even these users increasingly adopt hybrid blends that shuttle non-sensitive workloads to SaaS AIOps platforms. Hyperscalers strengthen their advantage by embedding observability hooks directly into infrastructure-as-code templates, further consolidating buyer spend. At the edge, lightweight collectors push summaries to cloud cores, preserving low latency while retaining centralized analytics governance.
Security and network monitoring constituted 29.0% of the IT operations analytics market in 2024 as cyberattacks exploit operational weak points before signature-based tools trigger. Converged SecOps dashboards that correlate packet flows with application traces detect anomalies 50% faster than siloed models, reinforcing the IT operations analytics market size premium attached to risk mitigation.
AIOps-centric root-cause analytics is the fastest riser, clocking 24.6% CAGR, as AI-driven clustering collapses duplicate alerts and pinpoints origin faults. Infrastructure monitoring matures toward predictive capacity planning, while business service monitoring links SLO breaches to revenue impact, a feature prized by digital retailers during flash-sale peaks. Telecom operators harness 5G network data-analytics functions to lower total cost of ownership 45%, illuminating the breadth of use cases spanning the IT operations analytics market.
IT Operation Analytics (ITOA) Market is Segmented by Deployment (Cloud and On-Premise), Application (Application Monitoring, Business and IT Services Monitoring, and More), End-User Industry (BFSI, Healthcare, and More), Analytics Type (Predictive Analytics, Root-Cause Analytics, and More), and Geography. The Market Forecasts are Provided in Terms of Value (USD).
Geography Analysis
North America led the IT operations analytics market with 37.4% revenue in 2024, buoyed by mature DevOps cultures, well-funded venture ecosystems and federal programs that subsidize cloud migration. Flagship vendors such as Splunk, IBM and ServiceNow enjoy dense enterprise install bases, so regional growth pivots from greenfield deployments toward value-added AI extensions and cross-domain integrations. Regulatory pushes for zero-trust architectures further elevate analytics budgets, though overall expansion moderates as first-wave projects reach optimization stage.
Asia-Pacific is the fastest-growing geography, projected at 19.8% CAGR to 2030. Governments position AI adoption as a lever for industrial competitiveness, prompting manufacturers to integrate shop-floor OT streams with IT telemetry for predictive maintenance rollouts. AI investment intentions exceed 20% budget growth among 43% of enterprises, feeding a sizeable pipeline of analytics demand. Edge-native architectures, abundant engineering talent and vibrant start-up ecosystems offset skills shortages in advanced SRE disciplines, cementing the region as a primary engine of the IT operations analytics market.
Europe balances innovation with strict data-sovereignty rules, requiring platforms to localize processing while enabling federated analysis across borders. Legislation such as the Digital Operational Resilience Act shapes procurement criteria toward auditability and governance, prompting vendors to add policy-aware data-routing features. Sustainability directives create incremental use cases as enterprises leverage analytics to track energy consumption and carbon footprints within data centers. Despite slower macro-economic growth, compliance-driven spending keeps the IT operations analytics market vibrant across the continent.
- Splunk Inc.
- IBM Corporation
- ServiceNow Inc.
- VMware Inc. (Broadcom)
- Dynatrace Inc.
- Oracle Corporation
- BMC Software Inc.
- Micro Focus Intl. plc
- Cisco Systems Inc.
- AppDynamics LLC
- Elastic N.V.
- SAS Institute Inc.
- New Relic Inc.
- PagerDuty Inc.
- Datadog Inc.
- SolarWinds Corp.
- ManageEngine (Zoho)
- OpsRamp Inc.
- Evolven Software
- XpoLog Ltd.
Additional Benefits:
- The market estimate (ME) sheet in Excel format
- 3 months of analyst support
TABLE OF CONTENTS
1 INTRODUCTION
- 1.1 Study Assumptions and Market Definition
- 1.2 Scope of the Study
2 RESEARCH METHODOLOGY
3 EXECUTIVE SUMMARY
4 MARKET LANDSCAPE
- 4.1 Market Overview
- 4.2 Market Drivers
- 4.2.1 Cloud-native observability adoption accelerates real-time ITOA demand
- 4.2.2 Rapid shift from siloed ITOM tools to unified AIOps suites
- 4.2.3 Need for predictive outage prevention in hybrid-cloud estates
- 4.2.4 FinOps mandates push cost-aware analytics adoption
- 4.2.5 Sovereign-cloud regulations spur regional ITOA variants
- 4.3 Market Restraints
- 4.3.1 High initial data-engineering and licensing costs
- 4.3.2 Shortage of site-reliability / DevSecOps skillsets
- 4.3.3 Data-residency limits on log export hamper AI training
- 4.4 Regulatory Landscape
- 4.5 Technological Outlook
- 4.6 Porter's Five Forces Analysis
- 4.6.1 Threat of New Entrants
- 4.6.2 Bargaining Power of Buyers
- 4.6.3 Bargaining Power of Suppliers
- 4.6.4 Threat of Substitutes
- 4.6.5 Intensity of Competitive Rivalry
5 MARKET SIZE AND GROWTH FORECASTS
- 5.1 By Deployment
- 5.1.1 Cloud-based
- 5.1.2 On-premise
- 5.2 By Application
- 5.2.1 Application Monitoring
- 5.2.2 Business and IT-Service Monitoring
- 5.2.3 Infrastructure Monitoring
- 5.2.4 Network and Security Monitoring
- 5.3 By End-user Industry
- 5.3.1 BFSI
- 5.3.2 Healthcare
- 5.3.3 Telecommunication
- 5.3.4 Retail and E-commerce
- 5.3.5 Industrial / Manufacturing
- 5.3.6 Government and Public Sector
- 5.4 By Analytics Type
- 5.4.1 Predictive Analytics
- 5.4.2 Root-Cause Analytics
- 5.4.3 Visual / Dashboard Analytics
- 5.4.4 Behavior Analytics
- 5.5 By Geography (Cross-segmentation)
- 5.5.1 North America
- 5.5.1.1 United States
- 5.5.1.2 Canada
- 5.5.1.3 Mexico
- 5.5.2 Europe
- 5.5.2.1 United Kingdom
- 5.5.2.2 Germany
- 5.5.2.3 France
- 5.5.2.4 Italy
- 5.5.2.5 Rest of Europe
- 5.5.3 Asia-Pacific
- 5.5.3.1 China
- 5.5.3.2 Japan
- 5.5.3.3 India
- 5.5.3.4 South Korea
- 5.5.3.5 Rest of Asia
- 5.5.4 Middle East
- 5.5.4.1 Israel
- 5.5.4.2 Saudi Arabia
- 5.5.4.3 United Arab Emirates
- 5.5.4.4 Turkey
- 5.5.4.5 Rest of Middle East
- 5.5.5 Africa
- 5.5.5.1 South Africa
- 5.5.5.2 Egypt
- 5.5.5.3 Rest of Africa
- 5.5.6 South America
- 5.5.6.1 Brazil
- 5.5.6.2 Argentina
- 5.5.6.3 Rest of South America
- 5.5.1 North America
6 COMPETITIVE LANDSCAPE
- 6.1 Market Concentration
- 6.2 Strategic Moves
- 6.3 Market Share Analysis
- 6.4 Company Profiles (includes Global level Overview, Market level overview, Core Segments, Financials as available, Strategic Information, Market Rank/Share for key companies, Products and Services, and Recent Developments)
- 6.4.1 Splunk Inc.
- 6.4.2 IBM Corporation
- 6.4.3 ServiceNow Inc.
- 6.4.4 VMware Inc. (Broadcom)
- 6.4.5 Dynatrace Inc.
- 6.4.6 Oracle Corporation
- 6.4.7 BMC Software Inc.
- 6.4.8 Micro Focus Intl. plc
- 6.4.9 Cisco Systems Inc.
- 6.4.10 AppDynamics LLC
- 6.4.11 Elastic N.V.
- 6.4.12 SAS Institute Inc.
- 6.4.13 New Relic Inc.
- 6.4.14 PagerDuty Inc.
- 6.4.15 Datadog Inc.
- 6.4.16 SolarWinds Corp.
- 6.4.17 ManageEngine (Zoho)
- 6.4.18 OpsRamp Inc.
- 6.4.19 Evolven Software
- 6.4.20 XpoLog Ltd.
7 MARKET OPPORTUNITIES AND FUTURE OUTLOOK
- 7.1 White-space and Unmet-need Assessment
 IT 营运分析市场 - 全球产业规模、份额、趋势、机会和预测(按组件、按应用、按最终用户、按地区和竞争细分,2020-2030 年预测)视觉化分析市场-全球产业规模、份额、趋势、机会和预测,按视觉化类型、资料来源、最终用户、地区和竞争情况细分,2020-2030 年预测
 IT 营运分析市场:2025-2030 年全球预测(按解决方案类型、分析类型、资料来源、部署类型、组织规模、应用程式和产业)
 IT 营运分析市场规模及预测 2021 - 2031、全球及地区份额、趋势及成长机会分析报告涵盖范围:依产品、部署、应用、垂直产业及地区
 全球 IT 营运分析市场研究报告 - 产业分析、规模、份额、成长、趋势及 2025 年至 2033 年预测
 2025年全球IT营运分析市场报告
 全球视觉化分析市场规模、份额、趋势分析报告 - 按部署模式、类型、业务功能、组织规模、行业垂直和地区分類的展望和预测,2024 年至 2031 年
 2025-2033 年按组件、服务、部署模式、企业规模、业务功能、垂直行业和地区分類的可视化分析市场报告
 IT 营运分析市场规模、份额、按产品、资料来源、技术和地区分類的成长分析 - 产业预测,2024-2031 年
 全球 IT 营运分析市场规模、份额和趋势分析:按公司规模、技术、部署类型、应用、最终用途、区域、前景和预测,2024-2031 年