


 |
市场调查报告书
商品编码
1844510
漂白剂:市场份额分析、行业趋势、统计数据和成长预测(2025-2030 年)Bleaching Agent - Market Share Analysis, Industry Trends & Statistics, Growth Forecasts (2025 - 2030) |
||||||
※ 本网页内容可能与最新版本有所差异。详细情况请与我们联繫。
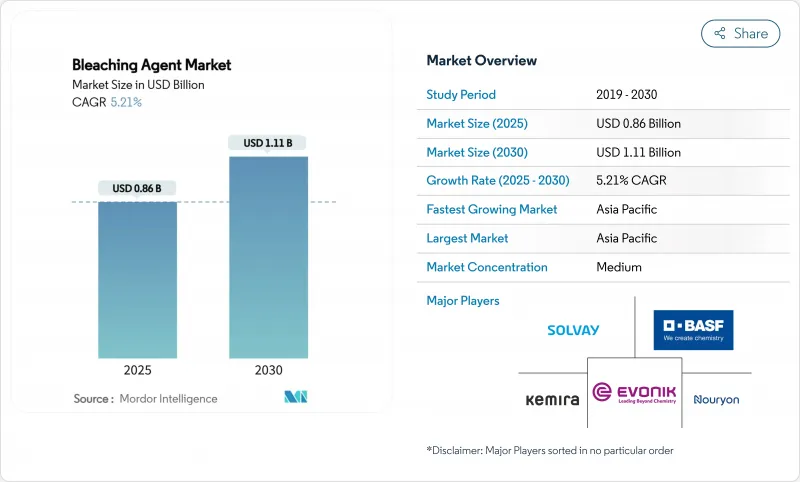
漂白水市场规模预计在 2025 年达到 8.6 亿美元,预计到 2030 年将达到 11.1 亿美元,预测期内(2025-2030 年)的复合年增长率为 5.21%。
这项预测成长证明了漂白水市场规模的稳定成长,以及该产业在供应链中断和环保审查日益严格的情况下仍然保持的适应能力。市政和工业水处理的持续需求、氯製剂因其成本和有效性而持续受到青睐,以及现场二氧化氯製备技术的快速普及,这些因素支撑了市场的发展势头。此外,亚太地区庞大的生产基地以及纸浆、纸张和纺织品中漂白剂消费量的不断增长,将继续引领该地区的成长。
全球漂白水市场趋势与洞察
市政和工业水处理需求不断增长
为了在抑制三卤甲烷形成的同时实现更强的病原体控制,世界各地的公共产业正在用二氧化氯溶液取代传统的氯化系统。由于营运商致力于避免运输危险化学品并提高剂量准确性,现场发生器的安装量每年增长超过20%。食品、饮料和製药厂的工业用户也出现了同步成长,这些用户必须满足更严格的微生物标准。新冠疫情期间卫生意识的增强,推动了医疗机构和机构的用量增加。在缺水地区,公用事业公司更青睐漂白剂,因为它可以在不增加产品成本的情况下处理日益污染的水源。
亚太地区纸浆和造纸产量快速成长
快速的都市化和电子商务正在推动包装需求,从而推动中国、印度、日本和韩国的纸浆和纸张生产以及相关漂白剂的消费量。工厂运营商正在从单质氯过渡到二氧化氯和酶辅助工艺,以在保持目标白度的同时降低化学氧消费量。随着生产商将白度从ISO 88提高到92或更高,过氧化氢在无氯製程中发挥关键作用。区域生产商也持续投资安全维修,以减少高压氧化器的事故。
对氯漂白剂急性和慢性毒性的担忧
一些司法管辖区已将二氧化氯蒸气的职业暴露限值设定为0.1 ppm(8小时时间加权平均值),这促使工业用户安装先进的通风和洩漏检测系统。疫情期间的中毒事件加剧了消费者的担忧,促使零售商提供危害较小的象征性替代品。儘管过氧化物和过乙酸混合物,但医疗保健和食品行业越来越青睐它们,以减少员工培训和仓储管理。
細項分析
到 2024 年,氯气部分将占据漂白剂市场 35.11% 的份额,这主要归功于完善的基础设施、低廉的原材料成本以及垂直整合的氯碱製造商的多元化供应控制。氯碱热电汽电共生确保了氯气的持续供应,使大型公司能够签订长期供应协议,特别是针对市政消毒厂。儘管对氯化副产品进行了严格审查,但由于许多工厂缺乏新反应器和安全维修的资金,替代速度仍然很慢。过氧化氢和过碳酸钠的复合年增长率最快,为 5.76%,这得益于纸浆和造纸厂转向无元素氯产品以及洗衣配方製造商销售生态标籤。催化过氧化物分解为水和氧气,对寻求无残留卫生的食品、饮料和製药加工商具有吸引力。高锰酸钾和活性漂白土等特殊氧化剂填补了半导体、石油精炼和食用油精炼等高价值、低销售量的细分市场。
区域分析
2024年,亚太地区将占据45.22%的收入份额,这将支持製造规模的扩大和本地消费的成长。政府对纸张回收的激励措施,加上出口导向纺织丛集的发展,支撑了6.21%的复合年增长率。中国沿海的工厂正在升级为多级二氧化氯工艺,以提高亮度,同时减少吸附性有机卤化物的排放。在新建氯酸钠和过氧化氢工厂的支持下,印度下游的造纸和服饰正在推动该地区强劲的需求成长。
北美正受益于先进的製程控制、日益增强的监管意识以及近期减少对运输氯气依赖的资本计划。亚利桑那州一家耗资7,000万美元的工厂将盐水转化为次氯酸钠,代表着一种在岸化趋势,提高了西部公用事业的供应安全性。医疗机构青睐使用二氧化氯对热水管道进行消毒。约翰霍普金斯医院数十年的业绩记录表明,该医院能够持续抑制退伍军人菌,且不会腐蚀管道。
欧洲面临最昂贵的合规负担。 REACH 申请费和即将出台的排放上限正在推动生产商转向危害性较低的配方,从而增加了人们对生物基和酶漂白的兴趣。斯堪地那维亚的纸浆厂已经证明,用漆酶介导的步骤取代初始碱性萃取步骤可以减少 25% 的化学品使用量。拉丁美洲和中东的市场规模仍然相对较小,但透过扩大饮用水网路和纤维素纤维产能的基础设施计划,它们仍有成长潜力。
其他福利:
- Excel 格式的市场预测 (ME) 表
- 3个月的分析师支持
目录
第一章 引言
- 研究假设和市场定义
- 调查范围
第二章调查方法
第三章执行摘要
第四章 市场状况
- 市场概况
- 市场驱动因素
- 市政和工业水处理需求不断增长
- 亚太地区纸浆和造纸产量快速成长
- 扩大纺织品加工能力
- 加强饮用水中余氯的监管
- 二氧化氯发生器在分散消毒的快速应用
- 市场限制
- 对氯漂白剂急性和慢性毒性的担忧
- 严格的环境法规
- 原料成本波动
- 价值链分析
- 五力分析
- 供应商的议价能力
- 买方的议价能力
- 新进入者的威胁
- 替代品的威胁
- 竞争程度
第五章市场规模及成长预测
- 依产品类型
- 氯
- 过氧化物
- 钠
- 钙
- 其他活动(高锰酸盐、活性漂白土等)
- 按形式
- 粉末
- 液体
- 按最终用户产业
- 纸浆和造纸
- 纺织品
- 建造
- 电气和电子
- 卫生保健
- 水处理
- 其他(食品、石油和天然气等)
- 按地区
- 亚太地区
- 中国
- 印度
- 日本
- 韩国
- ASEAN
- 其他亚太地区
- 北美洲
- 美国
- 加拿大
- 墨西哥
- 欧洲
- 德国
- 英国
- 法国
- 义大利
- 俄罗斯
- 其他欧洲国家
- 南美洲
- 巴西
- 阿根廷
- 南美洲其他地区
- 中东和非洲
- 沙乌地阿拉伯
- 南非
- 其他中东和非洲地区
- 亚太地区
第六章 竞争态势
- 市场集中度
- 策略倡议
- 市占率分析
- 公司简介
- Accepta Water Treatment
- Aditya Birla Group
- ANSA McAL
- Arkema
- Ashland
- BASF
- Chemtrade International Corporation
- Chlorum Solutions
- Clariant
- Dow
- Ecolab Inc
- Erco Worldwide
- Evonik Industries AG
- Gujarat Alkalies and Chemicals Limited
- Hawkins
- Kemira
- MITSUBISHI GAS CHEMICAL COMPANY, INC.
- Nouryon
- Olin Corporation
- Solenis
- Solvay
第七章 市场机会与未来展望
The Bleaching Agent Market size is estimated at USD 0.86 billion in 2025, and is expected to reach USD 1.11 billion by 2030, at a CAGR of 5.21% during the forecast period (2025-2030).
This projected expansion underscores a steady rise in the bleaching agent market size and the sector's ability to adapt despite supply-chain disruptions and stricter environmental oversight. Persistent demand from municipal and industrial water treatment, continued preference for chlorine formulations because of cost and efficacy, and rapid uptake of on-site chlorine-dioxide generation underpin market momentum. Powder products, which offer logistical and dosing advantages, deepen manufacturers' cost leadership, while Asia Pacific's sizable production base and escalating consumption of bleaching agents in pulp, paper, and textiles keep the region at the forefront of growth.
Global Bleaching Agent Market Trends and Insights
Rising Demand for Municipal & Industrial Water Treatment
Utilities worldwide are replacing legacy chlorination systems with chlorine-dioxide solutions because these deliver stronger pathogen control while curbing trihalomethane formation. Installations of on-site generators are growing more than 20% each year as operators aim to bypass hazardous chemical transport and enhance dosage precision. Parallel growth stems from industrial users in food, beverage, and pharmaceutical plants that must meet tighter microbial standards. Heightened hygiene awareness that emerged during the COVID-19 pandemic sustains elevated consumption in health-care and institutional settings. In regions experiencing water scarcity, utilities favor bleaching agents that can treat increasingly contaminated sources without escalating byproducts.
Surging Pulp & Paper Output in APAC
Rapid urbanization and e-commerce have boosted packaging demand, lifting pulp and paper output and, consequently, bleaching agent consumption across China, India, Japan, and South Korea. Mill operators are transitioning from elemental chlorine to chlorine-dioxide and enzyme-aided sequences, which cut chemical oxygen-demand while maintaining brightness targets. Hydrogen peroxide remains pivotal in elemental-chlorine-free processes as producers raise brightness from 88 to more than 92 ISO. Regional producers also continue to invest in safety retrofits to curb incidents in high-pressure oxidation units.
Acute & Chronic Toxicity Concerns of Chlorinated Bleaches
Occupational-exposure limits for chlorine-dioxide vapors are set at 0.1 ppm (8-hour TWA) in several jurisdictions, prompting industrial users to install advanced ventilation and leak-detection systems. Publicized poisoning events during the pandemic reinforced consumer skepticism and spurred retailers to offer alternatives with lower hazard symbols. Healthcare and food sectors increasingly favor peroxide or peracetic-acid blends, even at higher unit costs, to reduce staff training and storage controls.
Other drivers and restraints analyzed in the detailed report include:
- Expanding Textile Processing CapacityExpanding Textile Processing Capacity
- Tightening Potable-Water Residual-Chlorine Regulations
- Stringent Environmental Regulations
For complete list of drivers and restraints, kindly check the Table Of Contents.
Segment Analysis
The chlorine segment retained 35.11% of bleaching agent market share in 2024-largely due to entrenched infrastructure, low raw-material cost, and diversified supply controlled by vertically integrated chlor-alkali producers. Chlor-alkali cogeneration ensures continuous chlorine gas availability, allowing large players to honor long-term supply contracts, especially for municipal disinfection plants. Despite scrutiny over chlorinated byproducts, replacement remains gradual because many facilities lack immediate capital for new reactors or safety retrofits. Hydrogen peroxide and sodium percarbonate together posted the fastest 5.76% CAGR, buoyed by pulp and paper mills striving for elemental-chlorine-free status and laundry formulators marketing eco-labels. Catalyzed peroxide, which decomposes into water and oxygen, appeals to food, beverage, and pharmaceutical processors seeking residue-free sanitation. Specialty oxidants such as potassium permanganate and activated bleaching earth fill high-value but lower-volume niches in semiconductor, oil-refining, and edible-oil purification.
The Bleaching Agent Market Report is Segmented by Product Type (Chlorine, Peroxides, Sodium, Calcium, Others), Form (Powder, Liquid), End-User Industry (Pulp and Paper, Textile, Construction, Electrical and Electronics, Healthcare, Water Treatment, Others), and Geography (Asia-Pacific, North America, Europe, South America, Middle East and Africa). The Market Forecasts are Provided in Terms of Value (USD).
Geography Analysis
Asia Pacific's 45.22% revenue share in 2024 underscores its combined manufacturing scale and rising local consumption. Government incentives for paper recycling, coupled with export-oriented textile clusters, underpin a 6.21% CAGR outlook. Mills across coastal China have upgraded to multi-stage chlorine-dioxide sequences that raise brightness while cutting adsorbable-organic-halide discharge. India's downstream paper and garment sectors, supported by new sodium-chlorate and hydrogen-peroxide plants, contribute to steady regional demand growth.
North America benefits from advanced process control, high regulatory awareness, and recent capital projects that reduce reliance on transported chlorine gas. A USD 70 million plant in Arizona converting salt brine to sodium hypochlorite typifies the on-shoring trend, which enhances supply security for western utilities. Healthcare facilities favor chlorine-dioxide for hot-water-line disinfection; Johns Hopkins Hospital's multi-decade performance record demonstrates sustained Legionella suppression without pipe corrosion.
Europe confronts the costliest compliance burden. REACH dossier fees and upcoming emissions ceilings push producers toward lower-hazard formulations and raise interest in bio-based or enzyme-aided bleaching. Pilot installations in Scandinavian pulp mills demonstrate 25% chemical-consumption cuts when replacing the first alkaline extraction with laccase-mediated steps. Latin American and Middle-Eastern markets remain comparatively small but present upside through infrastructure projects that expand potable-water networks and cellulose fiber capacity.
- Accepta Water Treatment
- Aditya Birla Group
- ANSA McAL
- Arkema
- Ashland
- BASF
- Chemtrade International Corporation
- Chlorum Solutions
- Clariant
- Dow
- Ecolab Inc
- Erco Worldwide
- Evonik Industries AG
- Gujarat Alkalies and Chemicals Limited
- Hawkins
- Kemira
- MITSUBISHI GAS CHEMICAL COMPANY, INC.
- Nouryon
- Olin Corporation
- Solenis
- Solvay
Additional Benefits:
- The market estimate (ME) sheet in Excel format
- 3 months of analyst support
TABLE OF CONTENTS
1 Introduction
- 1.1 Study Assumptions & Market Definition
- 1.2 Scope of the Study
2 Research Methodology
3 Executive Summary
4 Market Landscape
- 4.1 Market Overview
- 4.2 Market Drivers
- 4.2.1 Rising demand for municipal & industrial water treatment
- 4.2.2 Surging pulp & paper output in APAC
- 4.2.3 Expanding textile processing capacity
- 4.2.4 Tightening potable-water residual-chlorine regulations
- 4.2.5 Rapid uptake of chlorine-dioxide generators in decentralized disinfection
- 4.3 Market Restraints
- 4.3.1 Acute & chronic toxicity concerns of chlorinated bleaches
- 4.3.2 Stringent environmental regulations
- 4.3.3 Volatility in raw material costs
- 4.4 Value Chain Analysis
- 4.5 Porter's Five Forces
- 4.5.1 Bargaining Power of Suppliers
- 4.5.2 Bargaining Power of Buyers
- 4.5.3 Threat of New Entrants
- 4.5.4 Threat of Substitutes
- 4.5.5 Degree of Competition
5 Market Size & Growth Forecasts (Value)
- 5.1 By Product Type
- 5.1.1 Chlorine
- 5.1.2 Peroxides
- 5.1.3 Sodium
- 5.1.4 Calcium
- 5.1.5 Others (Permanganate, Activated Bleaching Earth, etc.)
- 5.2 By Form
- 5.2.1 Powder
- 5.2.2 Liquid
- 5.3 By End-user Industry
- 5.3.1 Pulp and Paper
- 5.3.2 Textile
- 5.3.3 Construction
- 5.3.4 Electrical and Electronics
- 5.3.5 Healthcare
- 5.3.6 Water Treatment
- 5.3.7 Others (Food, Oil and Gas, etc.)
- 5.4 By Geography
- 5.4.1 Asia-Pacific
- 5.4.1.1 China
- 5.4.1.2 India
- 5.4.1.3 Japan
- 5.4.1.4 South Korea
- 5.4.1.5 ASEAN
- 5.4.1.6 Rest of Asia-Pacific
- 5.4.2 North America
- 5.4.2.1 United States
- 5.4.2.2 Canada
- 5.4.2.3 Mexico
- 5.4.3 Europe
- 5.4.3.1 Germany
- 5.4.3.2 United Kingdom
- 5.4.3.3 France
- 5.4.3.4 Italy
- 5.4.3.5 Russia
- 5.4.3.6 Rest of Europe
- 5.4.4 South America
- 5.4.4.1 Brazil
- 5.4.4.2 Argentina
- 5.4.4.3 Rest of South America
- 5.4.5 Middle East and Africa
- 5.4.5.1 Saudi Arabia
- 5.4.5.2 South Africa
- 5.4.5.3 Rest of Middle East and Africa
- 5.4.1 Asia-Pacific
6 Competitive Landscape
- 6.1 Market Concentration
- 6.2 Strategic Moves
- 6.3 Market Share Analysis
- 6.4 Company Profiles (includes Global level Overview, Market level overview, Core Segments, Financials as available, Strategic Information, Market Rank/Share for key companies, Products & Services, and Recent Developments)
- 6.4.1 Accepta Water Treatment
- 6.4.2 Aditya Birla Group
- 6.4.3 ANSA McAL
- 6.4.4 Arkema
- 6.4.5 Ashland
- 6.4.6 BASF
- 6.4.7 Chemtrade International Corporation
- 6.4.8 Chlorum Solutions
- 6.4.9 Clariant
- 6.4.10 Dow
- 6.4.11 Ecolab Inc
- 6.4.12 Erco Worldwide
- 6.4.13 Evonik Industries AG
- 6.4.14 Gujarat Alkalies and Chemicals Limited
- 6.4.15 Hawkins
- 6.4.16 Kemira
- 6.4.17 MITSUBISHI GAS CHEMICAL COMPANY, INC.
- 6.4.18 Nouryon
- 6.4.19 Olin Corporation
- 6.4.20 Solenis
- 6.4.21 Solvay
7 Market Opportunities & Future Outlook
- 7.1 White-space & Unmet-need Assessment
 漂白水市场(按漂白水类型、形式、最终用途和分销管道)—全球预测 2025-2032
 次氯酸盐漂白剂:市场份额分析、行业趋势、统计数据和成长预测(2025-2030 年)
 过碳酸钠市场-全球产业规模、份额、趋势、机会和预测,按销售管道、最终用途、地区和竞争细分,2020-2030 年
 过碳酸钠市场报告:2031 年趋势、预测与竞争分析
 2025年过碳酸钠全球市场报告
 次氯酸盐漂白市场规模、份额和成长分析(按产品类型、形式、强度、应用、最终用途和地区)- 产业预测 2025-2032
 全球漂白水市场(2025-2029)
 2025 年至 2033 年漂白剂市场报告(按产品类型、形式、最终用户产业和地区划分)次氯酸盐漂白剂市场,按形式、类型、应用、国家和地区 - 2025 年至 2032 年全球行业分析、市场规模、市场份额和预测
 漂白凝胶市场:全球产业分析、规模、份额、成长、趋势和预测,2025-2032 年