


 |
市场调查报告书
商品编码
1844611
光纤压力感测器:市场份额分析、行业趋势、统计数据和成长预测(2025-2030)Fiber Optic Pressure Sensors - Market Share Analysis, Industry Trends & Statistics, Growth Forecasts (2025 - 2030) |
||||||
※ 本网页内容可能与最新版本有所差异。详细情况请与我们联繫。
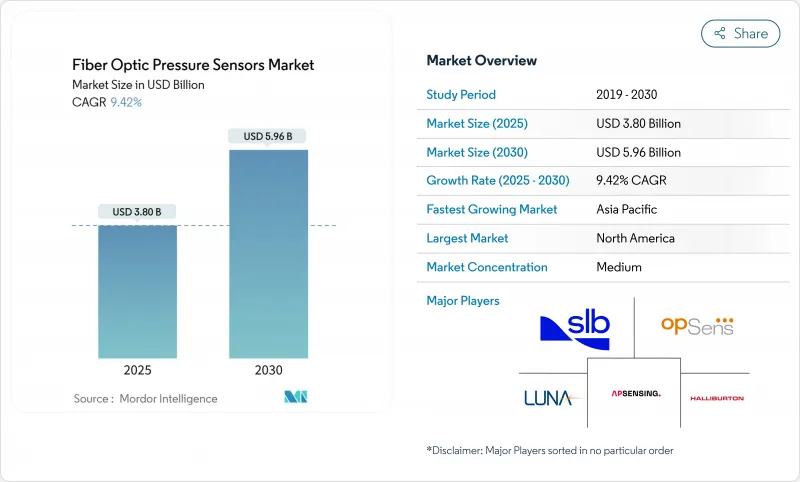
预计光纤压力感测器市场规模到 2025 年将达到 38 亿美元,到 2030 年将成长至 59.6 亿美元,复合年增长率为 9.42%。
由于该技术适用于地下油井和电动车电池组等恶劣环境下的即时监控,因此需求强劲。法布里-珀罗微腔的日益小型化,加上自2020年以来单位解调成本下降了60%,使其在工业自动化、医疗保健、移动出行等领域得到了广泛应用。多路復用技术的提升推动了光纤布拉格光栅 (FBG) 的普及,而边缘分析在智慧工厂和嵌入式设备中的整合则凸显了新的成长途径。儘管成本比压阻感测器高出2-3倍,但整体拥有成本的不断提升、员工技能的提升以及连接器标准化倡议,正在持续降低应用门槛。
全球光纤压力感测器趋势与洞察
法布里-珀罗 MEMS 腔体的快速小型化
大批量微影术可使腔体尺寸达到 10µm 或更小,同时保持 +/-0.01% 的满量程精度。这项突破使空间受限的医疗设备能够检测低至 2 kPa 的压力,灵敏度比传统聚合物感测器高 80%。紧凑的腔体可实现遵循硅光电製程的晶圆级集成,从而缩短响应时间并降低单位成本。微型感测器现已支援基于导管的心血管监测、高速航太驱动回馈和嵌入式电池单元诊断,且不会损害结构完整性。随着产量的增加,光纤压力感测器市场的有线和无线部分都将受益于更高的性能,同时降低每通道价格。
降低分散式光纤询问单元的成本
自2020年以来,硅光电的整合已使检测单元的价格下降了约60%,使亚奈米波长分辨率进入常规工业预算范围。低成本单元现已实现2.5με的精度和亚秒响应时间,加速了桥樑、隧道和管道结构健康监测的应用。中国以11.3%的市占率领先全球,检验了大规模智慧工厂部署的成本竞争力。边缘分析韧体进一步减少了数据回程传输的需求,增强了远端资产的价值提案,并推动了光纤压力感测器市场的整体成长。
与压阻感测器相比,平均售价更高
2-3倍的单价溢价仍然存在,尤其是在预算紧张的多感测器工业自动化计划中。与简单的应变计调节器相比,专用读取硬体会增加资本成本。然而,在腐蚀性或高温环境下,维护成本的节省可以抵消资产生命週期内的初始成本,从而推动逐步更换。预计到2028年,硅光电的规模化将使量产生产线上的差距缩小到接近平价,进而缓解光纤压力感测器市场的此限制因素。
細項分析
到2024年,有线设备将占总收入的73%,巩固其在井下完井、管线舷梯和工业炉等高可靠性资产中的地位。随着炼油厂升级和LNG接收站扩建,有线光纤压力感测器单元的市场规模预计将稳定成长。在无线传播不可靠的环境中,实体连接可确保数公里光纤上的讯号完整性。
无线节点将以 12% 的复合年增长率成长,以适应布线增加重量、复杂性和安全风险的安装需求。植入式医疗设备、电池单元和旋转机械将使用非同步读取的无电池被动标籤。超低功耗光学读取器成本的持续下降将扩大早期采用者以外的潜在用户群,从而推动整个光纤压力感测器市场的需求[3]。
法布里-珀罗感测器凭藉其亚毫巴分辨率和在200°C下的稳定性,占据了47%的收入份额。小于10µm的微腔设计使其能够整合到皮下注射针和狭窄的地质钻孔中,从而巩固了光纤压力感测器的市场份额领先地位。
然而,FBG阵列的扩张速度最快,复合年增长率高达13.5%。数百个光栅可在单一光纤上復用,从而降低结构安全监控和远距管道计划的单点成本。高速解调器可达到±1 pm的稳定性,增强高层建筑的地震监测和风荷载分析。随着解调成本的下降,FBG的采用将削弱法布里-珀罗的主导地位,并扩大光纤压力感测器市场的总潜在收益。
区域分析
由于严格的安全规范以及页岩气领域电动汽车电池工厂的扩张,北美地区将在2024年占据38%的收益,占据领先地位。联邦政府对先进製造业的激励措施以及油田服务巨头的进驻,正在推动快速原型製作和早期商业化。航太计画也在飞行关键系统中采用光学仪表,巩固了该地区在光纤压力感测器市场的创新主导地位。
预计到2030年,亚太地区将迎来最强劲的复合年增长率,达到12.2%。中国在全球分散式感测应用中所占的11.3%份额,证明了政府主导的智慧工厂部署。一家日本精密汽车巨头正在将光学感测器整合到电池冷却迴路中,而印度炼油厂的扩建则需要高温测量。硅光电的区域成本优势将加速询问单元的产量,扩大国内供应,并刺激光纤压力感测器市场的整体成长。
欧洲正稳步成长,以汽车製造、石化加工和离岸风力发电为主导。德国在全球光纤安装量中所占份额为9.4%,反映了其在工业自动化领域的长期领先地位。英国海底运营商正在北海新一轮的寿命延长计划中采用湿式光纤连接器。法国航太部门越来越青睐用于即时结构诊断的光学阵列,这为整个光纤压力感测器市场增添了稳定的成长动力。
其他福利:
- Excel 格式的市场预测 (ME) 表
- 3个月的分析师支持
目录
第一章 引言
- 研究假设和市场定义
- 调查范围
第二章调查方法
第三章执行摘要
第四章 市场状况
- 市场概况
- 市场驱动因素
- 法布里-珀罗 MEMS 腔体的快速小型化
- 分散式光纤检查单元的成本降低
- 电动汽车电池组热失控安全中的 OEM 集成
- 井下数位化目标(OandG)授权
- 智慧工厂中的边缘分析(报告不足)
- 植入式智慧导管资金筹措激增(未通报)
- 市场限制
- 高 ASP 与压阻感测器
- 海底系统连接器标准化延迟。
- 合格视光学技术人员短缺问题未充分通报
- 微腔设计的智慧财产权碎片化(通报不足)
- 价值/供应链分析
- 监管状况
- 技术展望
- 波特五力分析
- 新进入者的威胁
- 买方的议价能力
- 供应商的议价能力
- 替代品的威胁
- 竞争的激烈程度
第五章市场规模及成长预测
- 按类型
- 有线
- 无线的
- 依技术
- 法布里-珀罗
- 光纤布拉格光栅
- 基于实力
- 其他技术
- 按用途
- 石油和天然气
- 工业自动化
- 医疗保健和医疗设备
- 汽车与移动出行
- 消费性电子产品
- 石化
- 其他用途
- 按安装环境
- 井下/地下
- 工业地面设备
- 体内/生物医学
- 航太和无人机
- 海洋/海底结构
- 按地区
- 北美洲
- 美国
- 加拿大
- 欧洲
- 英国
- 德国
- 法国
- 俄罗斯
- 其他欧洲国家
- 亚太地区
- 中国
- 印度
- 日本
- 其他亚太地区
- 南美洲
- 巴西
- 阿根廷
- 南美洲其他地区
- 中东和非洲
- 海湾合作委员会国家
- 土耳其
- 南非
- 其他中东和非洲地区
- 北美洲
第六章 竞争态势
- 市场集中度
- 策略倡议
- 市占率分析
- 公司简介
- AP Sensing GmbH
- Baker Hughes Company
- Halliburton Company
- Honeywell International Inc.
- Infineon Technologies AG
- Luna Innovations Incorporated(incl. FISO Technologies)
- NXP Semiconductors NV
- Omron Corporation
- Opsens Inc.
- Panasonic Holdings Corporation
- Pressure Profile Systems Inc.
- Robert Bosch GmbH
- Schlumberger Limited(SLB)
- STMicroelectronics NV
- Texas Instruments Incorporated
- Yokogawa Electric Corporation
- ABB Ltd.
- Broadcom Inc.
- Rockwell Automation Inc.
- Sumitomo Electric Industries Ltd.
第七章 市场机会与未来展望
The fiber optic pressure sensors market size is valued at USD 3.8 billion in 2025 and is forecast to rise to USD 5.96 billion by 2030, advancing at a 9.42% CAGR.
Robust demand stems from the technology's suitability for real-time monitoring in harsh environments such as downhole oil wells and electric-vehicle battery packs. Ongoing miniaturization of Fabry-Perot micro-cavities and a 60% fall in interrogation-unit costs since 2020 have broadened adoption across industrial automation, healthcare, and mobility. Multiplexing gains have lifted Fiber Bragg Grating (FBG) uptake, while edge analytics integration in smart factories and implantable devices underscores new avenues of growth. Despite a 2-3 X cost premium over piezo-resistive sensors, rising total-cost-of-ownership advantages, workforce upskilling, and connector standardization initiatives continue to mitigate adoption barriers.
Global Fiber Optic Pressure Sensors Market Trends and Insights
Rapid Miniaturization of Fabry-Perot MEMS Cavities
Mass-production lithography now delivers cavity dimensions below 10 µm while preserving +-0.01% full-scale accuracy. This leap enables pressure detection as low as 2 kPa in space-constrained medical devices, outperforming conventional polymer sensors by 80% sensitivity. Smaller cavities shorten response times and lower unit cost through wafer-level integration that follows silicon-photonics process flows. Miniature sensors now support catheter-based cardiovascular monitoring, high-speed aerospace actuation feedback, and embedded battery-cell diagnostics without compromising structural integrity. As production volumes climb, the wired and wireless segments of the fiber optic pressure sensors market both benefit from higher performance at reduced price per channel.
Cost-Down of Distributed Fiber-Optic Interrogation Units
The integration of silicon photonics has trimmed interrogation-unit pricing by roughly 60% since 2020, placing sub-nanometer wavelength resolution within reach of routine industrial budgets. Low-cost units now achieve 2.5 µε accuracy and sub-1 s response time, accelerating structural-health-monitoring adoption in bridges, tunnels, and pipelines. China leads global deployments with 11.3% share, validating cost competitiveness in large-scale smart-factory rollouts. Edge-analytics firmware further reduces data-backhaul needs, strengthening the value proposition in remote assets and boosting overall uptake of the fiber optic pressure sensors market.
High ASP Versus Piezo-Resistive Sensors
A 2-3 X unit-price premium persists, particularly in multi-sensor industrial automation projects where budget ceilings remain strict. Specialized interrogation hardware inflates capital cost compared to simple strain-gauge conditioners. Yet maintenance savings in corrosive or high-temperature sites offset initial spend over asset life cycles, encouraging gradual substitution. Silicon-photonics scale-up is expected to shrink the gap to near parity in high-volume lines by 2028, easing this restraint on the fiber optic pressure sensors market.
Other drivers and restraints analyzed in the detailed report include:
- OEM Integration in EV Battery-Pack Thermal-Runaway Safety
- Mandatory Down-Hole Digitalization Targets in Oil & Gas
- Connector Standardization Lag in Subsea Systems
For complete list of drivers and restraints, kindly check the Table Of Contents.
Segment Analysis
Wired devices represented 73% of revenue in 2024, cementing their role in high-integrity assets such as downhole completions, pipeline corridors, and industrial furnaces. The fiber optic pressure sensors market size for wired units is projected to rise steadily alongside refinery upgrades and LNG terminal expansions. Physical connectivity guarantees signal integrity across kilometers of fiber in environments where wireless propagation is unreliable.
Wireless nodes, growing at a 12% CAGR, address installations where cabling adds weight, complexity, or safety risk. Implantable medical devices, battery cells, and rotating machinery capitalize on battery-free passive tags interrogated asynchronously. Continuous cost declines in ultra-low-power optical interrogators widen the addressable base beyond early adopters, lifting overall demand within the broader fiber optic pressure sensors market.[3]
Fabry-Perot sensors held 47% revenue share thanks to sub-milli-bar resolution and robustness at 200 °C. Their micro-cavity designs, now below 10 µm, allow integration in hypodermic needles and narrow geological perforations, reinforcing leadership within the fiber optic pressure sensors market share.
FBG arrays, however, will expand the fastest at 13.5% CAGR. A single fiber multiplexes hundreds of gratings, trimming per-point cost for structural-health-monitoring and long-haul pipeline projects. High-speed demodulators achieve +-1 pm stability, enhancing earthquake-resilient building surveillance and high-rise wind-load analysis. As interrogation costs fall, FBG uptake moderates Fabry-Perot dominance while enlarging total addressable revenue for the fiber optic pressure sensors market.
The Fiber Optic Pressure Sensors Market Report is Segmented by Type (Wired, Wireless), Technology (Fabry-Perot, Fiber Bragg Grating, and More), Application (Oil & Gas, Industrial Automation, Healthcare & Medical Devices, and More), Installation Environment (Down-hole/Sub-surface, Industrial Surface Plants, In-vivo/Biomedical, and More), and Geography. The Market Forecasts are Provided in Terms of Value (USD).
Geography Analysis
North America led with 38% revenue in 2024, supported by rigorous safety codes across shale plays and expanding EV battery plants. Federal incentives for advanced manufacturing and the presence of oilfield service majors foster rapid prototyping and early commercial launches. Aerospace programs also adopt optical gauges for flight-critical systems, reinforcing the region's innovation edge within the fiber optic pressure sensors market.
Asia-Pacific posts the strongest 12.2% CAGR to 2030. China's 11.3% share of global distributed sensing deployments evidences government-driven smart-factory rollouts. Japan's precision automotive giants integrate optical sensors in battery cooling loops, while India's refinery expansions demand high-temperature gauging. Regional cost advantages in silicon photonics accelerate interrogation-unit output, broadening domestic availability and stimulating overall growth in the fiber optic pressure sensors market.
Europe records stable uptake anchored in automotive manufacturing, petrochemical processing, and offshore wind. Germany's 9.4% share of global optical deployments reflects long-standing leadership in industrial automation. United Kingdom subsea operators embrace wet-mate optical connectors for a new wave of North Sea life-extension projects. France's aerospace sector increasingly favors optical arrays for real-time structural diagnostics, adding to steady momentum across the fiber optic pressure sensors market.
- AP Sensing GmbH
- Baker Hughes Company
- Halliburton Company
- Honeywell International Inc.
- Infineon Technologies AG
- Luna Innovations Incorporated (incl. FISO Technologies)
- NXP Semiconductors N.V.
- Omron Corporation
- Opsens Inc.
- Panasonic Holdings Corporation
- Pressure Profile Systems Inc.
- Robert Bosch GmbH
- Schlumberger Limited (SLB)
- STMicroelectronics N.V.
- Texas Instruments Incorporated
- Yokogawa Electric Corporation
- ABB Ltd.
- Broadcom Inc.
- Rockwell Automation Inc.
- Sumitomo Electric Industries Ltd.
Additional Benefits:
- The market estimate (ME) sheet in Excel format
- 3 months of analyst support
TABLE OF CONTENTS
1 INTRODUCTION
- 1.1 Study Assumptions and Market Definition
- 1.2 Scope of the Study
2 RESEARCH METHODOLOGY
3 EXECUTIVE SUMMARY
4 MARKET LANDSCAPE
- 4.1 Market Overview
- 4.2 Market Drivers
- 4.2.1 Rapid miniaturisation of Fabry-Perot MEMS cavities
- 4.2.2 Cost-down of distributed fiber-optic interrogation units
- 4.2.3 OEM integration in EV battery-pack thermal-runaway safety
- 4.2.4 Mandatory down-hole digitalisation targets (OandG)
- 4.2.5 Edge-analytics in smart factories (under-reported)
- 4.2.6 Implantable smart-catheter RandD funding spike (under-reported)
- 4.3 Market Restraints
- 4.3.1 High ASP vs piezo-resistive sensors
- 4.3.2 Connector standard-isation lag in subsea systems
- 4.3.3 Scarcity of opto-qualified technicians (under-reported)
- 4.3.4 IP fragmentation around micro-cavity designs (under-reported)
- 4.4 Value / Supply-Chain Analysis
- 4.5 Regulatory Landscape
- 4.6 Technological Outlook
- 4.7 Porter's Five Forces Analysis
- 4.7.1 Threat of New Entrants
- 4.7.2 Bargaining Power of Buyers
- 4.7.3 Bargaining Power of Suppliers
- 4.7.4 Threat of Substitutes
- 4.7.5 Intensity of Rivalry
5 MARKET SIZE and GROWTH FORECASTS (VALUE)
- 5.1 By Type
- 5.1.1 Wired
- 5.1.2 Wireless
- 5.2 By Technology
- 5.2.1 Fabry-Perot
- 5.2.2 Fiber Bragg Grating
- 5.2.3 Intensity-Based
- 5.2.4 Other Technologies
- 5.3 By Application
- 5.3.1 Oil and Gas
- 5.3.2 Industrial Automation
- 5.3.3 Healthcare and Medical Devices
- 5.3.4 Automotive and Mobility
- 5.3.5 Consumer Electronics
- 5.3.6 Petrochemical
- 5.3.7 Other Applications
- 5.4 By Installation Environment
- 5.4.1 Down-hole / Sub-surface
- 5.4.2 Industrial Surface Plants
- 5.4.3 In-vivo / Biomedical
- 5.4.4 Aerospace and UAV
- 5.4.5 Marine and Subsea Structures
- 5.5 By Geography
- 5.5.1 North America
- 5.5.1.1 United States
- 5.5.1.2 Canada
- 5.5.2 Europe
- 5.5.2.1 United Kingdom
- 5.5.2.2 Germany
- 5.5.2.3 France
- 5.5.2.4 Russia
- 5.5.2.5 Rest of Europe
- 5.5.3 Asia-Pacific
- 5.5.3.1 China
- 5.5.3.2 India
- 5.5.3.3 Japan
- 5.5.3.4 Rest of Asia-Pacific
- 5.5.4 South America
- 5.5.4.1 Brazil
- 5.5.4.2 Argentina
- 5.5.4.3 Rest of South America
- 5.5.5 Middle East and Africa
- 5.5.5.1 GCC Countries
- 5.5.5.2 Turkey
- 5.5.5.3 South Africa
- 5.5.5.4 Rest of Middle East and Africa
- 5.5.1 North America
6 COMPETITIVE LANDSCAPE
- 6.1 Market Concentration
- 6.2 Strategic Moves
- 6.3 Market Share Analysis
- 6.4 Company Profiles (includes Global level Overview, Market level overview, Core Segments, Financials as available, Strategic Information, Market Rank/Share for key companies, Products and Services, and Recent Developments)
- 6.4.1 AP Sensing GmbH
- 6.4.2 Baker Hughes Company
- 6.4.3 Halliburton Company
- 6.4.4 Honeywell International Inc.
- 6.4.5 Infineon Technologies AG
- 6.4.6 Luna Innovations Incorporated (incl. FISO Technologies)
- 6.4.7 NXP Semiconductors N.V.
- 6.4.8 Omron Corporation
- 6.4.9 Opsens Inc.
- 6.4.10 Panasonic Holdings Corporation
- 6.4.11 Pressure Profile Systems Inc.
- 6.4.12 Robert Bosch GmbH
- 6.4.13 Schlumberger Limited (SLB)
- 6.4.14 STMicroelectronics N.V.
- 6.4.15 Texas Instruments Incorporated
- 6.4.16 Yokogawa Electric Corporation
- 6.4.17 ABB Ltd.
- 6.4.18 Broadcom Inc.
- 6.4.19 Rockwell Automation Inc.
- 6.4.20 Sumitomo Electric Industries Ltd.
7 MARKET OPPORTUNITIES AND FUTURE OUTLOOK
- 7.1 White-space and Unmet-Need Assessment
 压力感测器产业:市场占有率分析、产业趋势与统计、成长预测(2026-2031)
 压力感测器市场规模、份额及成长分析(按感测器类型、连接方式、最终用途产业和地区划分)-2026-2033年产业预测
 压力感测器市场规模、占有率、成长及全球产业分析:依类型、应用和地区划分的洞察与预测(2024-2032)水压感测器市场-2025年至2030年预测
 压力测量膜:全球市场份额和排名、总销售额和需求预测(2025-2031 年)
 压力感测器市场报告(按产品、类型、技术、应用和地区)2025-2033
 2025年压力感测器全球市场报告2025年流体压力感测器全球市场报告
 压力感测器市场按产品、类型、技术、压力范围、应用和使用案例-2025-2030 年全球预测
 全球压力感测器市场(按检测方法、类型和压力范围)- 预测至2030年