


 |
市场调查报告书
商品编码
1846195
流量感测器:市场份额分析、行业趋势、统计数据和成长预测(2025-2030 年)Flow Sensors - Market Share Analysis, Industry Trends & Statistics, Growth Forecasts (2025 - 2030) |
||||||
※ 本网页内容可能与最新版本有所差异。详细情况请与我们联繫。
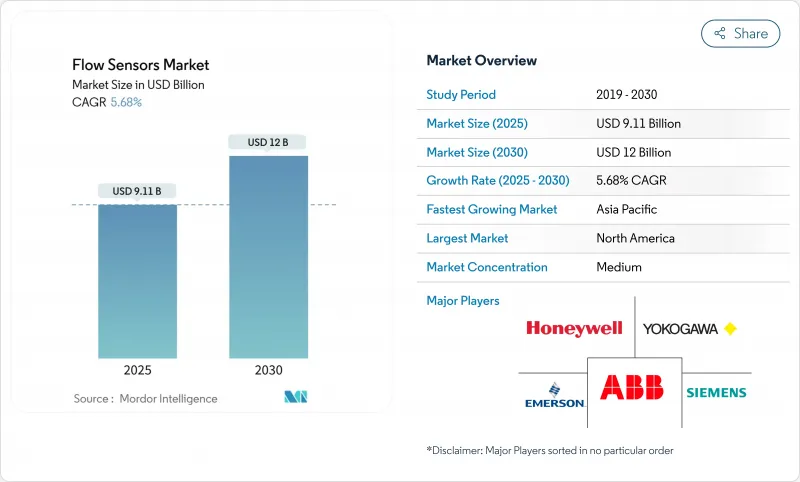
目前流量感测器市场价值为 91.1 亿美元,预计到 2030 年将达到 120 亿美元,年复合成长率为 5.68%。
流程工业数位化程度的不断提高、跨境管道强制实施的洩漏检测规则以及需要精确即时测量的大规模海水淡化投资,共同推动了成长。超音波技术创新、改装以及工业物联网 (IIoT) 连接正在缩短安装时间、提高运作,并帮助营运商遵守不断变化的贸易交接和环境标准。同时,半导体短缺和大口径科氏流量计的高昂资本投入限制了其普及速度,促使供应商围绕更容易取得的晶片组重新设计产品。
北美地区占据最大的收入份额,这主要得益于严格的管道安全法规和积极的智慧水务推广;而亚太地区则凭藉中国和印度数十亿美元的製造升级项目实现了最快增长。用水和污水处理企业是成长最快的终端用户群体,因为他们优先考虑减少无收益水和提高资产可靠性。市场竞争日趋激烈,现有企业纷纷收购专业超音波技术公司、推出工业物联网服务层并结盟,以巩固市场占有率。在资料即服务和微型化MEMS设计正在重新定义价值交付方式的市场中,各方都在积极寻求突破。
全球流量感测器市场趋势与洞察
智慧和工业物联网赋能的流量测量解决方案日益普及
来自科隆(KROHNE)等供应商的边缘运算感测器将阀门驱动与嵌入式流量、压力和温度测量功能整合在一起,使操作人员能够从被动检查转向预测性维护。部署了工业物联网(IIoT)感测器的设施,由于能够更早侦测到异常情况,计划外停机时间减少了高达30%。本地数据处理降低了网路负载,并支援即时安全措施。然而,最近在ABB TotalFlow电脑中发现的远端执行漏洞凸显了网路安全风险,并强调了加强安全框架的必要性。
维修计划中对非侵入式夹式超音波测量仪的需求激增
卡箍式装置无需切割管道,安装仅需约 30 分钟,而传统的管道内维修则可能需要数天时间。发电厂和化工厂正在采用这项技术,在不停机的情况下升级改造老旧管道。艾默生的 FLUXUS 系列产品工作温度范围为 -200 度C至 +630 度C,适用于低温和高温环境。自动计量检验可实现现场健康检查,进而缩短维护时间,进一步提高资产总利用率。
大直径贸易计量管道上的科氏流量计需要高额资本投资
大型科氏水质分析仪的单价可能超过10万美元,对计划预算造成巨大压力。业者会考虑其高昂的价格,因为相较之下,超音波和差压法等替代方案虽然价格更低,但精度也更低。儘管租赁模式和基于绩效的合约可以作为一种解决方案,但许多监管规范仍然要求达到科氏水质分析仪的精度水平,这使得市场需求即便麵临成本挑战也依然强劲。
细分市场分析
预计到2024年,液体测量将占流量感测器市场的58.2%,复合年增长率(CAGR)为6.88%。公共产业规模的智慧水务计划正在推动市场需求,例如莫尔顿尼格尔水务区部署的55,000个水錶每年可节省5亿加仑用水量(mnwd.com)。电磁感测器在导电流体领域仍占据主导地位,但超音波感测器在低导电性和浆液环境中的市场份额正在不断增长。在自然气领域,管道监测和工业燃烧控制领域的收益保持稳定,但由于成长速度较慢,其市场份额低于液体领域。
智慧城市政策迫使公用事业公司减少无收益水的使用,加速了液态水处理技术的应用。北卡罗来纳州卡里市耗资 1800 万美元建设的高级计量基础设施 (AMI) 平台每年减少了 7.1 万英里的卡车运输里程,显着降低了服务成本和排放。化学企业和啤酒厂也积极推动液态水处理系统的安装,尤其是在卫生标准要求或处理高腐蚀性介质时,需要采用全焊接不銹钢流道。
差压式流量感测器仍是最大的收益细分市场,占 31.03%,这主要得益于其数十年的装机量和良好的生命週期经济性。然而,超音波感测器将以 7.11% 的复合年增长率 (CAGR) 实现最快的成长,因为其夹装外形规格可减少停机时间,而先进的讯号演算法可将测量误差降低至 1%。到 2030 年,与超音波流量感测器相关的市场规模将在重工业改装中实现两位数成长。
科氏流量计在以密度和质量流量为关键的多参数测量领域仍保持其高端地位,而涡街感测器和热式感测器则适用于蒸气管道和低流量气体应用。磁感测器因其零压降和耐腐蚀衬里,在水务公司和纸浆厂中仍然广受欢迎。大多数技术都整合了自检验韧体,从而提高了操作人员的信心并降低了重新校准成本。
流量感测器市场报告按类型(液体、气体)、技术(科氏、差压、超音波、超音波、热式、磁式)、安装类型(线上、夹装、插入式)、最终用户产业(石油和天然气、水和用水和污水、食品和饮料、发电、纸浆和造纸、製药、其他行业)和地区对产业进行细分。
区域分析
北美地区占2024年收入的34.3%,这主要得益于PHMSA严格的洩漏检测规则和慷慨的「智慧水务」补贴。奥斯汀水务公司耗资8020万美元的计量表现代化改造项目,展现了基础设施建设方案如何促进多年感测器采购。联邦政府对甲烷减排技术的激励措施,进一步增加了管道营运商在高精度感测器上的支出,这些感测器为自动警报系统提供数据。
亚太地区以6.32%的复合年增长率领先全球。中国和印度的自动化计划年投资额超过17亿美元,刺激了汽车喷漆车间、化学联合企业和电子工厂的需求。本土供应商凭藉价格极具竞争力的线上电磁流量计和简易蜗壳式流量计,正挑战全球领导企业,迫使跨国公司加强本地支援和增值分析能力。东南亚将受益于大量电子和电池超级工厂的涌入,这些工厂对化学生产线中的超纯水和严格的流量控制有着极高的要求。
在欧洲,随着修订后的污水指令收紧排放标准并要求市政当局实施持续监测,预计监管主导的需求将保持稳定。在中东和非洲,诸如阿曼的巴尔卡5号海水淡化计画等大型企划正投入两位数的资金,这些计画依赖耐腐蚀的流体解决方案。在南美洲,感测器部署与巴西的卫生特许特许经营和阿根廷的LNG接收站扩建项目密切相关,这两个项目都需要在严苛的製程条件下进行可靠的测量。
其他福利:
- Excel格式的市场预测(ME)表
- 3个月的分析师支持
目录
第一章 引言
- 研究假设和市场定义
- 调查范围
第二章调查方法
第三章执行摘要
第四章 市场情势
- 市场概览
- 市场驱动因素
- 智慧和工业物联网流量计量解决方案的采用率不断提高
- 维修计划中对非侵入式钳形超音波测量仪的需求激增
- 跨境油气管线强制性洩漏检测法规
- 水资源匮乏经济体中海水淡化和再利用工厂的快速扩张
- 微型MEMS流量感测器为一次性生物製程设备提供动力
- 利用资料即服务(DaaS)经营模式创造经常性收益来源
- 市场限制
- 大直径贸易交接管道中科氏流量计的高额资本投资
- 新兴国家缺乏熟练的校准实验室
- 无线流量计网路中的网路安全漏洞
- 关键半导体晶片供应链的不稳定性
- 关键法规结构评估
- 价值链分析
- 技术展望
- 五力分析
- 供应商的议价能力
- 买方的议价能力
- 新进入者的威胁
- 替代品的威胁
- 竞争对手之间的竞争
- 关键相关人员影响评估
- 主要用例和案例研究
- 宏观经济因素对市场的影响
- 投资分析
第五章 市场区隔
- 按类型
- 液体
- 气体
- 依技术
- 科里奥利
- 压力差
- 超音波
- 涡流
- 热敏型
- 磁的
- 按安装类型
- 排队
- 夹式
- 插入类型
- 按最终用户产业
- 石油和天然气
- 用水和污水
- 化工/石化
- 饮食
- 发电
- 纸浆和造纸
- 製药
- 其他行业
- 按地区
- 北美洲
- 美国
- 加拿大
- 墨西哥
- 南美洲
- 巴西
- 阿根廷
- 其他南美
- 欧洲
- 英国
- 德国
- 法国
- 义大利
- 西班牙
- 北欧的
- 其他欧洲国家
- 中东和非洲
- 中东
- 沙乌地阿拉伯
- 阿拉伯聯合大公国
- 土耳其
- 其他中东地区
- 非洲
- 南非
- 埃及
- 奈及利亚
- 其他非洲国家
- 亚太地区
- 中国
- 印度
- 日本
- 韩国
- ASEAN
- 澳洲
- 纽西兰
- 其他亚太地区
- 北美洲
第六章 竞争情势
- 市场集中度
- 策略倡议
- 市占率分析
- 公司简介
- ABB Ltd.
- Endress+Hauser Group Services AG
- Siemens AG
- Emerson Electric Co.
- Honeywell International Inc.
- Yokogawa Electric Corporation
- Krohne Messtechnik GmbH
- Badger Meter, Inc.
- Christian Burkert GmbH and Co. KG
- Sensirion AG
- TSI Incorporated
- Keyence Corporation
- Brooks Instrument LLC
- TE Connectivity Ltd.
- Texas Instruments Incorporated
- Schneider Electric SE
- OMEGA Engineering Inc.
- SICK AG
- Proxitron GmbH
- Rechner Sensors
- Bronkhorst High-Tech BV
- Katronic Technologies Ltd.
- Alicat Scientific, Inc.
- Tokyo Keiki Inc.
- Fuji Electric Co., Ltd.
第七章 市场机会与未来展望
The flow sensors market is currently valued at USD 9.11 billion and is projected to reach USD 12 billion by 2030, advancing at a 5.68% CAGR.
Growth rests on rising digitalization across process industries, mandatory leak-detection rules in cross-border pipelines, and large-scale desalination investments that demand accurate, real-time measurement. Ultrasonic innovation, clamp-on retrofits, and IIoT connectivity shorten installation times, improve uptime, and help operators comply with evolving custody-transfer and environmental standards. At the same time, semiconductor shortages and high capital requirements for large-diameter Coriolis meters constrain the pace of adoption, nudging suppliers to redesign products around more readily available chipsets.
North America commands the largest revenue share because of strict pipeline safety mandates and aggressive smart-water rollouts, while Asia-Pacific records the fastest growth on the back of multi-billion-dollar manufacturing upgrades in China and India. Water and wastewater utilities represent the fastest-expanding end-user group as utilities prioritize non-revenue water reduction and asset reliability. Competition is intensifying: incumbents acquire niche ultrasonic specialists, launch IIoT service layers, and forge alliances to secure share in a market where data-as-a-service and miniaturized MEMS designs redefine value delivery.
Global Flow Sensors Market Trends and Insights
Increasing adoption of smart and IIoT-enabled flow metering solutions
Edge-ready sensors from suppliers such as KROHNE merge valve actuation with embedded flow, pressure, and temperature measurement, letting operators shift from reactive checks to predictive upkeep. Facilities that fitted IIoT-enabled sensors cut unplanned downtime by up to 30% because anomalies surfaced early. Local data processing lowers network load and empowers real-time safety actions. However, recent discoveries of remote-execution flaws in ABB TotalFlow computers spotlight cyber risks and underscore the need for hardened security frameworks.
Surging demand for non-invasive clamp-on ultrasonic meters in retrofit projects
Clamp-on units avoid pipe cutting and finish installation in roughly 30 minutes, a sharp contrast to multi-day inline retrofits. Power plants and chemical sites now favor the technology to refresh legacy lines without halts. Emerson's FLUXUS series handles -200 °C to +630 °C, proving suitability in cryogenic and high-temperature duties. Automated meter verification permits on-site health checks, trimming maintenance hours and further boosting total asset utilization.
High CapEx for Coriolis meters in large-diameter custody-transfer lines
Each large-bore Coriolis installation can exceed USD 100,000, straining project budgets. Operators weigh the premium against alternative ultrasonic or differential-pressure options that cost less but deliver lower accuracy. Leasing models and outcome-based contracts offer relief, yet many custody-transfer codes enforce Coriolis-level precision, sustaining demand despite cost hurdles.
Other drivers and restraints analyzed in the detailed report include:
- Mandatory leak-detection regulations in cross-border oil and gas pipelines
- Rapid expansion of desalination and reuse plants in water-stressed economies
- Supply-chain volatility for critical semiconductor chips
For complete list of drivers and restraints, kindly check the Table Of Contents.
Segment Analysis
Liquid measurement held 58.2% of the flow sensors market in 2024 and is projected to grow at a 6.88% CAGR. Utility-scale smart-water projects boost demand, with Moulton Niguel Water District's 55,000-meter rollout saving 500 million gallons annually mnwd.com. Electromagnetic variants remain dominant for conductive fluids, while ultrasonic sensors gain share in low-conductivity or slurry settings. On the gas side, pipeline monitoring and industrial combustion control sustain steady revenue, but lower growth keeps its contribution below the liquid segment.
Smart city mandates accelerate liquid adoption by compelling utilities to lower non-revenue water. Cary, North Carolina's USD 18 million AMI platform eliminated 71,000 truck miles each year, demonstrating service cost reductions and emissions cuts. Chemical processors and breweries also propel liquid installations, particularly where sanitary standards or aggressive media require fully welded stainless-steel flow paths.
Differential-pressure devices still represent the largest revenue block at 31.03%, anchored by decades of installed base and favorable life-cycle economics. Yet ultrasonic sensors deliver the fastest 7.11% CAGR because clamp-on form factors reduce downtime, and advanced signal algorithms trim measurement error to 1%. The flow sensors market size tied to ultrasonic devices is positioned for double-digit gains in retrofit heavy industries through 2030.
Coriolis meters maintain premium status for multi-parameter measurement where density and mass flow are critical, while vortex and thermal variants address steam lines and low-flow gas applications. Magnetic sensors stay popular in water utilities and pulp plants due to zero pressure drop and corrosion-resistant liners. Integration of self-verification firmware across most technologies boosts operator confidence and lowers recalibration spend.
The Flow Sensor Market Report Segments the Industry Into by Type (Liquid, and Gas), Technology (Coriolis, Differential Pressure, Ultrasonic, Vortex, Thermal, and Magnetic), Installation Type (Inline, Clamp-On, and Insertion), End-User Industry (Oil and Gas, Water and Wastewater, Chemical and Petrochemical, Food and Beverage, Power Generation, Pulp and Paper, Pharmaceuticals, and Other Industries), and Geography.
Geography Analysis
North America controlled 34.3% of 2024 revenue thanks to PHMSA's stringent leak-detection rules and significant smart-water grants. Austin Water's USD 80.2 million meter modernization illustrates how infrastructure packages unlock multi-year sensor procurement. Federal incentives for methane-reduction technologies further raise spending by pipeline operators on high-precision sensors that feed automated alert systems.
Asia-Pacific records a 6.32% CAGR, the highest worldwide. Annual investments topping USD 1.7 billion in Chinese and Indian automation projects spur demand across automotive paint shops, chemical complexes, and electronics fabs. Local vendors challenge global incumbents with price-competitive inline magmeters and simple vortex models, forcing multinationals to sharpen local support and value-added analytics. Southeast Asia benefits from electronics and battery gigafactory inflows that require tight flow control in ultrapure water and chemical lines.
Europe posts stable, regulation-led demand as the revised wastewater directive tightens discharge norms, compelling municipalities to fit continuous monitoring. Middle East and Africa see double-digit spending on desalination megaprojects such as Oman's Barka 5 that depend on corrosion-resistant flow solutions. In South America, sensor uptake is tied to Brazil's sanitation concessions and Argentina's LNG terminal expansions, both of which demand reliable measurement under harsh process conditions.
- ABB Ltd.
- Endress+Hauser Group Services AG
- Siemens AG
- Emerson Electric Co.
- Honeywell International Inc.
- Yokogawa Electric Corporation
- Krohne Messtechnik GmbH
- Badger Meter, Inc.
- Christian Burkert GmbH and Co. KG
- Sensirion AG
- TSI Incorporated
- Keyence Corporation
- Brooks Instrument LLC
- TE Connectivity Ltd.
- Texas Instruments Incorporated
- Schneider Electric SE
- OMEGA Engineering Inc.
- SICK AG
- Proxitron GmbH
- Rechner Sensors
- Bronkhorst High-Tech B.V.
- Katronic Technologies Ltd.
- Alicat Scientific, Inc.
- Tokyo Keiki Inc.
- Fuji Electric Co., Ltd.
Additional Benefits:
- The market estimate (ME) sheet in Excel format
- 3 months of analyst support
TABLE OF CONTENTS
1 INTRODUCTION
- 1.1 Study Assumptions and Market Definition
- 1.2 Scope of the Study
2 RESEARCH METHODOLOGY
3 EXECUTIVE SUMMARY
4 MARKET LANDSCAPE
- 4.1 Market Overview
- 4.2 Market Drivers
- 4.2.1 Increasing adoption of smart and IIoT-enabled flow metering solutions
- 4.2.2 Surging demand for non-invasive, clamp-on ultrasonic meters in retrofit projects
- 4.2.3 Mandatory leak-detection regulations in cross-border oil and gas pipelines
- 4.2.4 Rapid expansion of desalination and reuse plants in water-stressed economies
- 4.2.5 Miniaturised MEMS flow sensors powering single-use bioprocessing equipment
- 4.2.6 Data-as-a-service (DaaS) business models creating recurring revenue streams
- 4.3 Market Restraints
- 4.3.1 High CapEx for Coriolis meters in large-diameter custody-transfer lines
- 4.3.2 Scarcity of skilled calibration labs in emerging countries
- 4.3.3 Cyber-security vulnerabilities in wireless flow-meter networks
- 4.3.4 Supply-chain volatility for critical semiconductor chips
- 4.4 Evaluation of Critical Regulatory Framework
- 4.5 Value Chain Analysis
- 4.6 Technological Outlook
- 4.7 Porter's Five Forces
- 4.7.1 Bargaining Power of Suppliers
- 4.7.2 Bargaining Power of Buyers
- 4.7.3 Threat of New Entrants
- 4.7.4 Threat of Substitutes
- 4.7.5 Competitive Rivalry
- 4.8 Impact Assessment of Key Stakeholders
- 4.9 Key Use Cases and Case Studies
- 4.10 Impact on Macroeconomic Factors of the Market
- 4.11 Investment Analysis
5 MARKET SEGMENTATION
- 5.1 By Type
- 5.1.1 Liquid
- 5.1.2 Gas
- 5.2 By Technology
- 5.2.1 Coriolis
- 5.2.2 Differential Pressure
- 5.2.3 Ultrasonic
- 5.2.4 Vortex
- 5.2.5 Thermal
- 5.2.6 Magnetic
- 5.3 By Installation Type
- 5.3.1 Inline
- 5.3.2 Clamp-on
- 5.3.3 Insertion
- 5.4 By End-user Industry
- 5.4.1 Oil and Gas
- 5.4.2 Water and Wastewater
- 5.4.3 Chemical and Petrochemical
- 5.4.4 Food and Beverage
- 5.4.5 Power Generation
- 5.4.6 Pulp and Paper
- 5.4.7 Pharmaceuticals
- 5.4.8 Other Industries
- 5.5 By Geography
- 5.5.1 North America
- 5.5.1.1 United States
- 5.5.1.2 Canada
- 5.5.1.3 Mexico
- 5.5.2 South America
- 5.5.2.1 Brazil
- 5.5.2.2 Argentina
- 5.5.2.3 Rest of South America
- 5.5.3 Europe
- 5.5.3.1 United Kingdom
- 5.5.3.2 Germany
- 5.5.3.3 France
- 5.5.3.4 Italy
- 5.5.3.5 Spain
- 5.5.3.6 Nordics
- 5.5.3.7 Rest of Europe
- 5.5.4 Middle East and Africa
- 5.5.4.1 Middle East
- 5.5.4.1.1 Saudi Arabia
- 5.5.4.1.2 United Arab Emirates
- 5.5.4.1.3 Turkey
- 5.5.4.1.4 Rest of Middle East
- 5.5.4.2 Africa
- 5.5.4.2.1 South Africa
- 5.5.4.2.2 Egypt
- 5.5.4.2.3 Nigeria
- 5.5.4.2.4 Rest of Africa
- 5.5.5 Asia-Pacific
- 5.5.5.1 China
- 5.5.5.2 India
- 5.5.5.3 Japan
- 5.5.5.4 South Korea
- 5.5.5.5 ASEAN
- 5.5.5.6 Australia
- 5.5.5.7 New Zealand
- 5.5.5.8 Rest of Asia-Pacific
- 5.5.1 North America
6 COMPETITIVE LANDSCAPE
- 6.1 Market Concentration
- 6.2 Strategic Moves
- 6.3 Market Share Analysis
- 6.4 Company Profiles (includes Global level Overview, Market level overview, Core Segments, Financials as available, Strategic Information, Market Rank/Share for key companies, Products and Services, and Recent Developments)
- 6.4.1 ABB Ltd.
- 6.4.2 Endress+Hauser Group Services AG
- 6.4.3 Siemens AG
- 6.4.4 Emerson Electric Co.
- 6.4.5 Honeywell International Inc.
- 6.4.6 Yokogawa Electric Corporation
- 6.4.7 Krohne Messtechnik GmbH
- 6.4.8 Badger Meter, Inc.
- 6.4.9 Christian Burkert GmbH and Co. KG
- 6.4.10 Sensirion AG
- 6.4.11 TSI Incorporated
- 6.4.12 Keyence Corporation
- 6.4.13 Brooks Instrument LLC
- 6.4.14 TE Connectivity Ltd.
- 6.4.15 Texas Instruments Incorporated
- 6.4.16 Schneider Electric SE
- 6.4.17 OMEGA Engineering Inc.
- 6.4.18 SICK AG
- 6.4.19 Proxitron GmbH
- 6.4.20 Rechner Sensors
- 6.4.21 Bronkhorst High-Tech B.V.
- 6.4.22 Katronic Technologies Ltd.
- 6.4.23 Alicat Scientific, Inc.
- 6.4.24 Tokyo Keiki Inc.
- 6.4.25 Fuji Electric Co., Ltd.
7 MARKET OPPORTUNITIES AND FUTURE OUTLOOK
- 7.1 White-space and Unmet-need Assessment


