


 |
市场调查报告书
商品编码
1910562
石脑油:市场占有率分析、产业趋势与统计、成长预测(2026-2031)Naphtha - Market Share Analysis, Industry Trends & Statistics, Growth Forecasts (2026 - 2031) |
||||||
※ 本网页内容可能与最新版本有所差异。详细情况请与我们联繫。
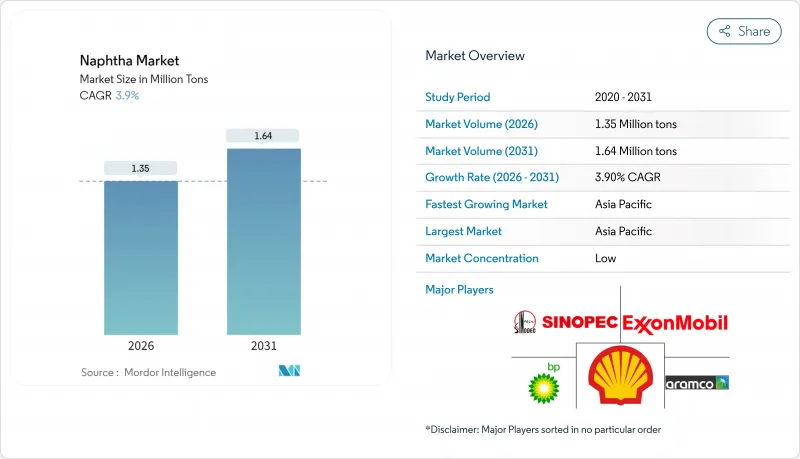
预计石脑油市场将从 2025 年的 130 万吨成长到 2026 年的 135 万吨,到 2031 年将达到 164 万吨,2026 年至 2031 年的复合年增长率为 3.9%。
石脑油作为烯烃和芳烃的主要石化原料,其需求受到支撑;而大型蒸汽裂解装置倾向于使用轻质馏分油以提高乙烯产率,进一步强化了这一需求。美国墨西哥湾沿岸冷凝油分离装置的投资以及亚洲新建一体化炼油厂正在重塑全球贸易流量,而新增的生物石脑油产能则提供了一种补充性的低碳供应来源。主要炼油企业正将上游原油供应与下游石化转化结合,以在整个价值链上创造价值。然而,原油-石脑油价差的波动、天然气液作为替代原料日益增长的吸引力以及日益严格的碳排放法规,都为利润率稳定性和资本配置决策带来了不确定性。
全球石脑油市场趋势与洞察
亚洲蒸气裂解装置推动烯烃和芳烃原料需求激增
在中国,运作大型裂解装置正在投产,以提升轻质石脑油的消费量,因为石蜡馏分能最大限度地提高乙烯产量。这些新装置到2028年的总炼油能力将达到每日80万至110万桶,其设计包含整合的冷凝油分离装置,旨在提高石脑油的收率。恆力石化和福建石化的产能扩张将维持需求的成长趋势,并导致高凝析油含量原油进口的结构性成长,使区域价格与更广泛的石脑油市场价格接轨。供应安全奖励促使中东生产商与亚洲裂解装置营运商签署了长期承购协议,进一步加强了区域价值链。净收益计算表明,每新增一套蒸汽裂解装置,区域轻质石脑油需求每年将增加150万吨,证实了这一驱动因素对整体增长的显着贡献。
中东石脑油重整装置与炼油厂升级改造计划的整合
巴林石油公司(Bapco)的现代化计画和沙特阿美投资110亿美元的阿米拉尔炼油厂项目,标誌着一种战略转变,即位置混合原料裂解装置和催化重整装置,以提高汽油辛烷值和芳烃的产量。这种模式将传统上流入车用燃料池的直馏石脑油转化为高利润的石化产品,从而提高炼油厂的整体毛利率。此外,透过共用公用设施,此一体化专案还将提高能源效率,并提供灵活的原料选择,以降低利润波动。光是阿米拉尔炼油厂每年就需要约500万吨石脑油,这将使该地区成为亚洲的重要供应地,有助于实现更紧密的区域供需平衡,并支持更强劲的石脑油市场。
原油-石脑油价差的波动对裂解利润带来压力。
地缘政治事件和炼厂运作导致石脑油裂解价差剧烈波动,对炼厂营运计画带来挑战,并迫使炼厂削减产能。 2024年初,亚丁湾成品油轮遭袭击事件将亚洲石脑油裂解价推至两年来的最高点,但随着套利货物的到来,价差迅速回落。自2019年以来,美国炼厂产能仍比尖峰时段低62万桶/日,全球供应缓衝不足,加剧了市场波动。在不利条件下,这种波动可能导致炼厂运转率下降高达8%,增加贸易商的营运资金需求,并限製石脑油市场扩张。
细分市场分析
2025年,轻质石脑油占全球石脑油市场的57.62%,主要归功于其高石蜡含量,而现代裂解装置偏好这种高石蜡含量的原料,因为它能获得更高的乙烯产率。预计到2031年,该细分市场将以4.55%的复合年增长率成长,成为各馏分油中成长最快的。美国和亚洲的冷凝油油分离器扩建计画旨在生产符合裂解装置原料要求的石蜡馏分油,这进一步巩固了该细分市场在石脑油市场的主导地位。每10万桶/日的分离器大约生产3万桶/日的轻质石脑油,这形成了供需紧张的局面,并支撑了其相对于汽油级原料的溢价。一体化业者正在将裂解液与重整装置的产出混合,以对冲利润週期波动并提高整体资产运转率。
由于重质石脑油芳烃含量高、乙烯转化率低,其市场成长较为温和,仅达个位数。然而,它仍然是催化重整装置提高辛烷值以及生产苯、甲苯和二甲苯的重要原料。对铂锡和铂铼双金属催化剂的投资提高了重整装置的重质馏分耐受性,扩大了重质原料的处理能力。随着汽油价差收窄,炼油商利用芳烃销售协议来变现重质馏分,从而维持了其对石脑油市场的支撑作用,但其贡献有减弱。
石脑油市场报告按类型(轻质石脑油和重质石脑油)、来源(炼厂来源、生物石脑油及其他)、终端用户行业(石油化工、农业、油漆涂料、航太及其他)和地区(亚太、北美、欧洲、南美以及中东和非洲)进行细分。市场预测以吨为单位。
区域分析
到2025年,亚太地区将占全球石脑油市场份额的43.65%,预计到2031年将以4.65%的复合年增长率增长,这主要得益于石化产品和化肥行业的同步增长。预计到2023年,中国原油加工量将达到创纪录的1,480万桶/日,进一步增强其原料自给能力;而印度的聚合物需求预计到2028年将达到3,500万吨。沙特阿美持有恆力石化10%的股份,加上福建计划,将进一步推动区域一体化,把中东的供应与东亚不断增长的需求连结起来。
由于对冷凝油分离装置的投资以及页岩油产量的增加,北美轻质石脑油持续面临结构性供应过剩。预计美国炼油产能将在2023年成长2%,并在2024年初达到每日1,840万桶的名义运作产能。然而,由于液态天然气(NGL)供应激增,分流了部分石化产品需求,该地区的石脑油市场扩张速度正在放缓。对拉丁美洲出口的成长以及偶尔对欧洲的套利贸易正在抵消季节性供应过剩的影响。
随着可再生燃料生产取代化石原料,欧洲对石脑油的需求将略有下降,但剩余的重整产能将继续提供芳烃和高辛烷值汽油调和成分。炼油厂正在维修现有设施以生产HVO(高纯度生物柴油)和SAF(永续航空燃料),而不是新建设施,从而腾出空间投资于旨在减少传统石脑油排放的碳捕获试点项目。中东将利用一体化重整-裂解计划,在套利机会出现时,将自己定位为亚洲和欧洲的边缘供应商。南美和非洲正透过尼日利亚的丹格特炼油厂等计划扩大其影响力,该炼油厂将生产高达8万桶/日的汽油和石脑油,逐步改变该地区的贸易平衡。
其他福利:
- Excel格式的市场预测(ME)表
- 3个月的分析师支持
目录
第一章 引言
- 研究假设和市场定义
- 调查范围
第二章调查方法
第三章执行摘要
第四章 市场情势
- 市场概览
- 市场驱动因素
- 亚洲蒸气裂解装置对烯烃和芳烃原料的需求激增
- 中东石脑油重整装置与炼油厂升级改造计划的整合
- 印度化肥需求不断成长
- 美国沿岸地区轻质石脑油生产用冷凝油油分离器投资增加
- 透过可再生燃料强制政策扩大生物石脑油的规模
- 市场限制
- 美国对液态天然气(NGL)的需求
- 原油/石脑油价格差的波动对裂解利润带来压力。
- 监管部门大力推动低碳替代材料和再生材料
- 价值链分析
- 波特五力分析
- 供应商的议价能力
- 消费者议价能力
- 新进入者的威胁
- 替代品的威胁
- 竞争对手之间的竞争
- 原料分析
第五章 市场规模及成长预测(数量与价值)
- 按类型
- 轻石脑油
- 重石脑油
- 按来源
- 炼油厂
- 生物石脑油
- 其他的
- 按最终用户行业划分
- 石油化学产品
- 农业
- 油漆和涂料
- 航太工业
- 其他行业
- 按地区
- 亚太地区
- 中国
- 印度
- 日本
- 韩国
- 亚太其他地区
- 北美洲
- 美国
- 加拿大
- 墨西哥
- 欧洲
- 德国
- 英国
- 法国
- 义大利
- 其他欧洲地区
- 南美洲
- 巴西
- 阿根廷
- 其他南美洲
- 中东和非洲
- 沙乌地阿拉伯
- 阿拉伯聯合大公国
- 南非
- 奈及利亚
- 其他中东和非洲地区
- 亚太地区
第六章 竞争情势
- 市场集中度
- 策略趋势
- 市占率分析
- 公司简介
- Alexandria Mineral Oils Company
- BP plc
- Chevron Phillips Chemical Company LLC
- China Petrochemical Corporation
- CNPC
- ENEOS Holdings Inc.
- Exxon Mobil Corporation
- Formosa Petrochemical Corporation
- Idemitsu Kosan Co.,Ltd.
- Indian Oil Corporation Ltd.
- Kuwait Petroleum Corporation
- LG Chem
- LyondellBasell Industries Holdings BV
- MGT Petroil
- PetroChina Company Limited
- Petroleos Mexicanos
- PTT Global Chemical Public Company Limited
- QatarEnergy
- Reliance Industries Limited
- SABIC
- Sasol Limited
- Saudi Arabian Oil Co.
- Shell plc
- SK Inc.
- TotalEnergies
第七章 市场机会与未来展望
The Naphtha market is expected to grow from 1.30 million tons in 2025 to 1.35 million tons in 2026 and is forecast to reach 1.64 million tons by 2031 at 3.9% CAGR over 2026-2031.
Demand is anchored by naphtha's role as the dominant petrochemical feedstock for olefins and aromatics, a position reinforced by large-scale steam crackers that prefer light fractions for higher ethylene yields. Investments in condensate splitters along the U.S. Gulf Coast and new integrated refineries in Asia are reshaping global trade flows, while bio-naphtha capacity additions provide a complementary, low-carbon supply stream. Leading refiners integrate upstream crude supply with downstream petrochemical conversion to capture value across the chain. However, volatile crude-naphtha spreads, the growing appeal of natural gas liquids as alternative feedstocks, and increasingly stringent carbon regulations inject uncertainty into margin stability and capital-allocation decisions.
Global Naphtha Market Trends and Insights
Surging Demand for Olefins and Aromatics Feedstocks from Asian Steam Crackers
China is commissioning a wave of mega-crackers that elevate consumption of light naphtha because its paraffinic composition maximizes ethylene output. New capacity totaling 0.8-1.1 million b/d of refining throughput by 2028 is designed with integrated condensate splitters that raise naphtha yield ratios. Capacity additions at Hengli Petrochemical and Fujian Petrochemical will maintain upward demand momentum, translating into structurally higher imports of condensate-rich crudes and driving regional price alignment with the broader naphtha market. Supply security incentives are prompting long-term offtake agreements between Middle-East producers and Asian crackers, further knitting regional value chains. Net-back calculations suggest that each incremental steam cracker complex boosts regional light naphtha requirements by 1.5 million tons annually, underpinning the driver's substantial contribution to overall growth.
Integration of Naphtha Reformers with Refinery Upgrading Projects in the Middle East
Bahrain's Bapco Modernization Programme and Saudi Aramco's USD 11 billion AMIRAL complex illustrate the strategic shift toward co-locating catalytic reformers with mixed-feed crackers to enhance gasoline octane and aromatic output. The model diverts straight-run naphtha that previously entered the motor-fuel pool into higher-margin petrochemical streams, improving overall refinery gross margins. Integration delivers energy-efficiency gains through shared utilities and furnishes flexible feedstock menus that dampen margin volatility. With AMIRAL alone requiring about 5 million tons of naphtha annually, the region becomes a swing supplier to Asia, tightening inter-regional balances and supporting a more robust naphtha market.
Volatile Crude-Naphtha Spreads Undermining Crack Margins
Geopolitical incidents and refining capacity outages drive sharp swings in naphtha crack spreads, challenging refinery scheduling and prompting throughput cuts. An attack on a product tanker in the Gulf of Aden sent Asian naphtha cracks to a two-year high in early 2024, yet spreads retraced swiftly as arbitrage cargoes arrived. With post-2019 U.S. refinery capacity still 620,000 b/d below the peak, global supply buffers remain thin, magnifying volatility. This instability dampens refinery utilization rates by up to 8% in adverse periods and raises working-capital requirements for traders, tempering naphtha market expansion.
Other drivers and restraints analyzed in the detailed report include:
- Rising Demand for Fertilizers in India
- Bio-Naphtha Scale-up Backed by Renewable-Fuel Mandates
- Regulatory Push for Low-Carbon Alternatives and Recycled Feedstocks
For complete list of drivers and restraints, kindly check the Table Of Contents.
Segment Analysis
Light naphtha generated 57.62% of the global naphtha market in 2025 as modern crackers favor its high paraffin content for superior ethylene yield. The segment is projected to grow at 4.55% CAGR to 2031, the briskest pace among cut types. Condensate splitter expansions in the United States and Asia are calibrated to produce paraffinic cuts that align with cracker slate requirements, reinforcing segment leadership in the naphtha market. Each 100,000 b/d splitter yields around 30,000 b/d of light naphtha, tightening balances and supporting premiums to gasoline-grade material. Integrated operators blend splitter streams with reformer output to hedge margin cycles and improve overall asset utilization.
Heavy naphtha lags with mid-single-digit growth owing to its higher aromatic content and lower ethylene productivity. Nonetheless, it remains an essential feedstock for catalytic reformers that upgrade octane and generate benzene, toluene, and xylenes. Investments in platinum-tin and platinum-rhenium bimetallic catalysts improve reformer severity tolerance, widening the processing window for heavier grades. Refiners leverage aromatics marketing agreements to monetize heavy cuts when gasoline spreads compress, preserving a supportive though less dynamic contribution to the naphtha market.
The Naphtha Market Report is Segmented by Type (Light Naphtha and Heavy Naphtha), Source (Refinery-Based, Bio-Naphtha, and Others), End-User Industry (Petrochemicals, Agriculture, Paints and Coatings, Aerospace, and Other Industries), and Geography (Asia Pacific, North America, Europe, South America, and Middle East and Africa). The Market Forecasts are Provided in Terms of Volume (tons).
Geography Analysis
Asia-Pacific led the naphtha market with 43.65% share in 2025, and its 4.65% forecast CAGR to 2031 stems from synchronized growth in petrochemicals and fertilizers. China processed a record 14.8 million b/d of crude in 2023, underpinning self-sufficiency in feedstocks, while India's polymer demand is on track to hit 35 million tons by 2028. Aramco's 10% stake in Hengli Petrochemical and the Fujian project further expand regional integration, aligning Middle-East supply with East-Asian demand growth.
North America remains structurally long light naphtha due to condensate splitter investments and rising shale liquids output. U.S. refining capacity climbed 2% in 2023, taking operable nameplate to 18.4 million b/d at the start of 2024. Yet surging NGL availability diverts petrochemical demand, moderating the regional naphtha market expansion pace. Export growth into Latin America and occasional arbitrage to Europe balances seasonal surpluses.
Europe's naphtha demand contracts modestly as renewable fuel production displaces fossil feedstocks, but residual reformer capacity supplies aromatics chains and high-octane gasoline blendstocks. Refiners retrofit existing units for HVO and SAF rather than building greenfield assets, freeing investment for carbon-capture pilots that lower the embedded emissions of conventional naphtha. The Middle East capitalizes on integration projects that couple reformers and crackers, positioning itself as the marginal supplier into Asia and Europe when arbitrage windows open. South America and Africa gain influence through projects such as Nigeria's Dangote refinery, which will produce up to 80 kbd of gasoline and naphtha, gradually transforming regional trade balances.
- Alexandria Mineral Oils Company
- BP p.l.c.
- Chevron Phillips Chemical Company LLC
- China Petrochemical Corporation
- CNPC
- ENEOS Holdings Inc.
- Exxon Mobil Corporation
- Formosa Petrochemical Corporation
- Idemitsu Kosan Co.,Ltd.
- Indian Oil Corporation Ltd.
- Kuwait Petroleum Corporation
- LG Chem
- LyondellBasell Industries Holdings B.V.
- MGT Petroil
- PetroChina Company Limited
- Petroleos Mexicanos
- PTT Global Chemical Public Company Limited
- QatarEnergy
- Reliance Industries Limited
- SABIC
- Sasol Limited
- Saudi Arabian Oil Co.
- Shell plc
- SK Inc.
- TotalEnergies
Additional Benefits:
- The market estimate (ME) sheet in Excel format
- 3 months of analyst support
TABLE OF CONTENTS
1 Introduction
- 1.1 Study Assumptions and Market Definition
- 1.2 Scope of the Study
2 Research Methodology
3 Executive Summary
4 Market Landscape
- 4.1 Market Overview
- 4.2 Market Drivers
- 4.2.1 Surging Demand for Olefins and Aromatics Feedstocks from Asian Steam Crackers
- 4.2.2 Integration of Naphtha Reformers with Refinery Upgrading Projects in the Middle East
- 4.2.3 Rising Demand for Fertilizers in India
- 4.2.4 Rising Investments in USGC Condensate Splitters Targeting Light Naphtha Output
- 4.2.5 Bio-Naphtha Scale-up Backed by Renewable-Fuel Mandates
- 4.3 Market Restraints
- 4.3.1 Natural Gas Liquid Demand in the United States
- 4.3.2 Volatile Crude-Naphtha Spreads Undermining Crack Margins
- 4.3.3 Regulatory Push for Low-Carbon Alternatives and Recycled Feedstocks
- 4.4 Value Chain Analysis
- 4.5 Porter's Five Forces Analysis
- 4.5.1 Bargaining Power of Suppliers
- 4.5.2 Bargaining Power of Consumers
- 4.5.3 Threat of New Entrants
- 4.5.4 Threat of Substitutes
- 4.5.5 Intensity of Competitive Rivalry
- 4.6 Feedstock Analysis
5 Market Size and Growth Forecasts (Volume and Value)
- 5.1 By Type
- 5.1.1 Light Naphtha
- 5.1.2 Heavy Naphtha
- 5.2 By Source
- 5.2.1 Refinery-Based
- 5.2.2 Bio-Naphtha
- 5.2.3 Others
- 5.3 By End-user Industry
- 5.3.1 Petrochemicals
- 5.3.2 Agriculture
- 5.3.3 Paints and Coatings
- 5.3.4 Aerospace
- 5.3.5 Other Industries
- 5.4 By Geography
- 5.4.1 Asia-Pacific
- 5.4.1.1 China
- 5.4.1.2 India
- 5.4.1.3 Japan
- 5.4.1.4 South Korea
- 5.4.1.5 Rest of Asia-Pacific
- 5.4.2 North America
- 5.4.2.1 United States
- 5.4.2.2 Canada
- 5.4.2.3 Mexico
- 5.4.3 Europe
- 5.4.3.1 Germany
- 5.4.3.2 United Kingdom
- 5.4.3.3 France
- 5.4.3.4 Italy
- 5.4.3.5 Rest of Europe
- 5.4.4 South America
- 5.4.4.1 Brazil
- 5.4.4.2 Argentina
- 5.4.4.3 Rest of South America
- 5.4.5 Middle East and Africa
- 5.4.5.1 Saudi Arabia
- 5.4.5.2 United Arab Emirates
- 5.4.5.3 South Africa
- 5.4.5.4 Nigeria
- 5.4.5.5 Rest of Middle East and Africa
- 5.4.1 Asia-Pacific
6 Competitive Landscape
- 6.1 Market Concentration
- 6.2 Strategic Moves
- 6.3 Market Share Analysis
- 6.4 Company Profiles {(includes Global level Overview, Market level overview, Core Segments, Financials as available, Strategic Information, Market Rank/Share for key companies, Products and Services, and Recent Developments)}
- 6.4.1 Alexandria Mineral Oils Company
- 6.4.2 BP p.l.c.
- 6.4.3 Chevron Phillips Chemical Company LLC
- 6.4.4 China Petrochemical Corporation
- 6.4.5 CNPC
- 6.4.6 ENEOS Holdings Inc.
- 6.4.7 Exxon Mobil Corporation
- 6.4.8 Formosa Petrochemical Corporation
- 6.4.9 Idemitsu Kosan Co.,Ltd.
- 6.4.10 Indian Oil Corporation Ltd.
- 6.4.11 Kuwait Petroleum Corporation
- 6.4.12 LG Chem
- 6.4.13 LyondellBasell Industries Holdings B.V.
- 6.4.14 MGT Petroil
- 6.4.15 PetroChina Company Limited
- 6.4.16 Petroleos Mexicanos
- 6.4.17 PTT Global Chemical Public Company Limited
- 6.4.18 QatarEnergy
- 6.4.19 Reliance Industries Limited
- 6.4.20 SABIC
- 6.4.21 Sasol Limited
- 6.4.22 Saudi Arabian Oil Co.
- 6.4.23 Shell plc
- 6.4.24 SK Inc.
- 6.4.25 TotalEnergies
7 Market Opportunities and Future Outlook
- 7.1 White-space and Unmet-Need Assessment
 2026-2030年全球石脑油市场
 石脑油市场分析及预测(至2035年):类型、应用、终端用户、产品、製程、技术、组件、安装类型及设施
 日本C4精製油市场规模、份额、趋势和预测:按类型、应用和地区划分,2026-2034年石脑油市场报告:按应用和地区划分 2026-2034 年
 石脑油市场-全球产业规模、份额、趋势、机会与预测:按产品、应用、地区和竞争对手划分,2021-2031年
 可再生石脑油市场依产品类型、原料、生产流程、纯度等级、通路及应用划分-2026-2032年全球预测
 生物石脑油市场规模、占有率、成长及全球产业分析:按类型、应用和地区划分的洞察与预测(2026-2034 年)
 石脑油市场规模、份额及成长分析(按类型、製造流程、应用及地区划分)-2026-2033年产业预测石脑油市场按产品类型、来源、应用、最终用途和分销管道划分-2025-2032 年全球预测
 石脑油市场规模、份额、趋势分析报告:按产品类型、应用、地区、细分市场预测,2025-2030 年