


 |
市场调查报告书
商品编码
1848017
美国拖拉机市场份额分析、行业趋势、统计数据和成长预测(2025-2030 年)United States Tractor - Market Share Analysis, Industry Trends & Statistics, Growth Forecasts (2025 - 2030) |
||||||
※ 本网页内容可能与最新版本有所差异。详细情况请与我们联繫。
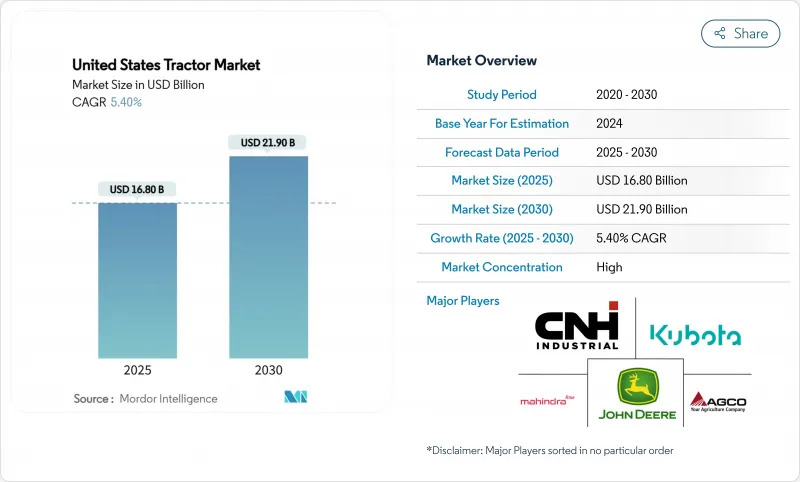
预计 2025 年美国拖拉机市场规模将达到 168 亿美元,2030 年将达到 219 亿美元,预测期内复合年增长率为 5.4%。
强劲的更换需求、40马力以下车型的快速电气化以及嵌入式自动驾驶技术正在塑造美国拖拉机市场。儘管Tier 4下线引擎成本构成阻力,但即时远端资讯处理、农业法案激励措施和碳信用收益正在共同推动投资收益。前五名供应商占据了美国拖拉机市场89.6%的份额,竞争异常激烈,这不仅强化了定价纪律,也加速了功能部署。监管、互联互通差距和经销商整合的相互作用表明,市场正在转向整合技术方案,这些方案有望在多个作物週期内实现可量化的节省。
美国拖拉机市场趋势与洞察
100匹马力以下车型继续电气化
40 马力以下的电池供电拖拉机现在提供了可观的回报,因为降低的营业成本可以在三到六个季节内抵消初始支出。约翰迪尔的 E-Power 原型机和 Solectrac 紧凑型系列表明早期产量主要集中在葡萄园、酪农和温室作业,这些地方低噪音和零废气排放至关重要。虽然研发重点是紧凑型系列,但由于电池密度仍限制了大型装置,预计零件价格自 2023 年以来将下降 14%,从而缩小柴油价格优势。经销商教育和充电基础设施奖励仍然是限制因素,但《农业法案》的气候分配正在鼓励试点采用。约翰迪尔的商业推广计画于 2026 年进行,这使得竞争对手面临越来越短的时间来吸引早期采用者。
智慧实施相容性推动更换需求
该方案有意限制了向后相容性,迫使农民不得不以旧换新,更换使用6到8年的拖拉机,而不是传统的11年周期。这种激增在40-100马力的拖拉机上最为明显,因为这类拖拉机的连作作业依赖于分段控制。因此,目标商标产品製造商 (OEM) 正在将带有导航功能的线束作为标准配置,以抢占更换的份额。一旦装置量达到临界点,这种顺风效应将在2027年达到高峰。
Tier-4 Final 引擎的初始成本和维护成本高
符合 Tier 4 Final 标准将导致标价上涨 15% 以上,并引入废气处理液收费,这将侵蚀家庭农场主的净利率。虽然颗粒物排放将减少 95%,但更长的投资回收期将导致许多生产商购买 Tier 4 之前的二手设备或推迟更换。随着零件供应商提高产量和次市场价格趋于正常化,预计这种紧张关係将在 2026 年后得到缓解。
細項分析
受电池成本下降和政府奖励的推动,40马力以下的电动拖拉机预计将以10.8%的复合年增长率增长,几乎是美国拖拉机市场整体规模的两倍。该细分市场受益于温室、酪农和城市农业,这些产业优先考虑零排放、低噪音性能。到2024年,40-100马力的电动拖拉机将维持美国拖拉机市场份额的51%。 100马力以上的电动拖拉机用于大型农场,在这些农场中,柴油的能量密度仍然最低,每英亩成本最低。
电动式农机新进者更重视的是拥有成本指标,而非环境保护,理由是燃油节省60%,维护成本降低40%。迪尔公司130马力的E-Power原型机凸显了向可扩展电气化的转变,但由于电池质量较大,大型车架的采用仍处于试验阶段。 Solectrac的销售额从2021年的180万美元成长到2022年的1,100万美元,但其净亏损显示基础建设的障碍仍然存在。如果磷酸锂铁化学技术普及,到2027年,电池组成本可能会下降20%,从而有可能削弱柴油的领先。
到2024年,多用途拖拉机将占总出货量的41%,这反映出它们适用于多种作业,包括家牛运输、干草运输和物业管理。儘管如此,果园和葡萄园拖拉机的成长速度仍将超过美国拖拉机市场的平均水平,到2030年,复合年增长率将达到11.4%。它们的高价位源自于其窄底盘、自动控制设备以及零排放动力传动系统,这些系统在窄行行距下表现优异。田间拖拉机的需求保持稳定,这与玉米和大豆种植面积息息相关,但随着原始设备製造商在高马力性能和价格敏感型种植者之间寻找平衡,其利润压力正变得越来越大。
Case IH 的 FieldOps 平台及其 Connectivity Included 功能免除了新果园拖拉机的资讯服务费,从而降低了使用寿命成本并促进了其普及。加州优质水果种植者支付高昂的价格,因为其每英亩利润率高于商品作物。随着时间的推移,像雷射雷达导引喷雾器这样的专业设备中经过验证的技术可能会逐渐融入主流实用车型,随着产量的增加和零件价格的下降,其吸引力也将进一步扩大。
其他福利:
- Excel 格式的市场预测 (ME) 表
- 3个月的分析师支持
目录
第一章 引言
- 研究假设和市场定义
- 调查范围
第二章调查方法
第三章执行摘要
第四章 市场状况
- 市场概况
- 市场驱动因素
- 100匹马力以下车型继续电气化
- 更智慧的设备正在推动更换需求的成长
- 先进的远端资讯处理技术降低整体拥有成本
- 2023年美国农业法案中的精密农业奖励措施
- 自主改装套件达到零售价格分布
- 低马力拖拉机的碳信用收益
- 市场限制
- Tier-4 Final 引擎的初始成本和维护成本高
- 山区经销商覆盖范围有限
- 缺乏配备感测器的车型的熟练技术人员
- 农村地区 5G 普及速度缓慢,限制了即时资讯服务
- 监管状况
- 技术展望
- 波特五力分析
- 新进入者的威胁
- 买方的议价能力
- 供应商的议价能力
- 替代品的威胁
- 竞争对手之间的竞争强度
第五章市场规模及成长预测
- 按马力
- 小于40马力
- 40-100马力
- 100马力或以上
- 按拖拉机类型
- 多功能拖拉机
- 旱地农用拖拉机
- 果园和葡萄园拖拉机
- 其他拖拉机
- 按驱动类型
- 两轮驱动(2WD)
- 四轮驱动(4WD)
- 自动驾驶/无人驾驶
- 按用途
- 谷物和油籽
- 水果和蔬菜
- 家畜
- 其他的
第六章 竞争态势
- 市场集中度
- 策略倡议
- 市占率分析
- 公司简介
- Deere and Company
- CNH Industrial NV
- AGCO Corporation
- Kubota Corporation
- Mahindra&Mahindra Ltd.
- CLAAS KGaA mbH
- SDF SpA(Deutz-Fahr)
- LS Mtron Ltd.
- Daedong-USA, Inc.
- Yanmar Holdings Co., Ltd.
- TYM Corporation
- Asko Holding
- JC Bamford Excavators Ltd.
- Doosan Bobcat
- Monarch Tractor
第七章 市场机会与未来展望
The United States tractor market size is valued at USD 16.8 billion in 2025 and is projected to reach USD 21.9 billion by 2030, registering a 5.4% CAGR during the forecast period.
Strong replacement demand, rapid electrification below 40 HP, and embedded autonomy are shaping the United States tractor market as growers look to offset rising labor costs and compliance spending. Real-time telematics, Farm Bill incentives, and carbon-credit monetization together lift return on investment, even as Tier-4 final engine costs add headwinds. Competitive behavior remains intense because the top five vendors control 89.6% of the United States tractor market, reinforcing price discipline while accelerating feature roll-outs. The interplay of regulation, connectivity gaps, and dealership consolidation signals a pivot toward integrated technology packages that promise quantifiable savings across multiple crop cycles.
United States Tractor Market Trends and Insights
Continuous Electrification of Sub-100 HP Models
Battery-powered tractors below 40 HP now offer meaningful payback because operating cost reductions offset up-front premiums within three to six seasons. John Deere's E-Power prototypes and Solectrac's compact lineup underline how early volume is clustering in vineyards, dairies, and greenhouse operations where low noise and zero tailpipe emissions carry premium value. Battery density still limits larger units, concentrating R&D on the compact range, yet component prices have fallen 14% since 2023, narrowing diesel price advantages. Dealer education and charging-infrastructure incentives remain gating factors, but Farm Bill climate allocations are catalyzing pilot deployments. With Deere's commercial rollout slated for 2026, rivals face a shrinking window to lock in early adopters.
Smart-Implement Compatibility Boosts Replacement Demand
Implement purposely limit on backward compatibility, pressing farmers to trade in 6-8-year-old tractors rather than the historic 11-year cycle. The surge is most visible in the 40-100 HP class, where row-crop operations depend on sectional control. Consequently, the Original Equipment Manufacturers (OEMs) bundle guidance-ready wiring harnesses as standard to capture replacement share. This tailwind should peak by 2027 once the installed base reaches critical mass.
High Upfront and Maintenance Costs of Tier-4 Final Engines
Tier-4 final compliance lifts sticker prices by more than 15% and introduces exhaust fluid expenses that erode margins for family farms. While emissions of particulate matter plunge 95%, the payback period lengthens, motivating many growers to buy used pre-Tier-4 units or delay replacements. The strain is likely to moderate after 2026 once component suppliers scale production and secondary-market prices normalize.
Other drivers and restraints analyzed in the detailed report include:
- Advanced Telematics Lower Total Cost of Ownership
- Precision-Ag Incentives in the 2023 U.S. Farm Bill
- Fragmented Dealership Coverage in Mountain States
For complete list of drivers and restraints, kindly check the Table Of Contents.
Segment Analysis
The below 40 HP electric tractor is forecast to advance at 10.8% CAGR, outpacing the broader United States tractor market by nearly twofold, due to falling battery costs and municipal incentives. This segment benefits from greenhouse, dairy, and urban farming operations that prize zero-emission, low-noise performance. The 40-100 HP range retains 51% United States tractor market share in 2024 because of its versatility across row-crop and livestock tasks, anchoring long-term volume. Above 100 HP units serve large farms where diesel energy density still delivers the lowest dollar-per-acre cost.
Electric newcomers target cost-of-ownership metrics rather than environmental altruism, citing 60% fuel savings and 40% lower maintenance. Deere & Company's 130 HP E-Power prototype underscores the manufacturer's shift toward scalable electrification, though battery mass keeps large-frame adoption in pilot mode. Solectrac's revenue rose from USD 1.8 million in 2021 to USD 11 million in 2022, yet net losses show infrastructure hurdles remain. As lithium iron phosphate chemistry gains traction, pack costs could fall 20% by 2027, narrowing diesel's upfront advantage.
The utility tractors captured 41% of 2024 shipments, reflecting broad task compatibility across cattle, hay, and property maintenance. Still, orchard and vineyard tractors are set for an 11.4% CAGR through 2030, eclipsing the United States tractor market average. Their premium pricing stems from narrow chassis, autonomy-ready controls, and zero-emission powertrains that thrive in confined rows. Row-crop tractors hold stable demand linked to corn and soybean acreage, but margin pressure is steeper as OEMs balance high-horsepower features against price-sensitive growers.
Case IH's FieldOps platform and its Connectivity Included offer removes data-service fees for new orchard tractors, trimming lifetime costs and spurring adoption. Premium fruit growers in California pay up because the margin per acre dwarfs commodity crops. Over time, technologies proven in specialty units-such as LIDAR-guided sprayers-should cascade into mainstream utility models once volumes cut component pricing, widening their appeal.
The United States Tractor Market Report is Segmented by Horsepower (Below 40 HP, 40-100 HP, and More), by Type (Utility Tractors, Row Crop Tractors, Orchard and Vineyard Tractors, and More), by Drive Type (Two-Wheel Drive (2WD), Four-Wheel Drive (4WD), and More), and by Application (Cereals and Oilseeds, Fruits and Vegetables, and More). The Market Forecasts are Provided in Terms of Value (USD).
List of Companies Covered in this Report:
- Deere and Company
- CNH Industrial N.V.
- AGCO Corporation
- Kubota Corporation
- Mahindra&Mahindra Ltd.
- CLAAS KGaA mbH
- SDF S.p.A. (Deutz-Fahr)
- LS Mtron Ltd.
- Daedong-USA, Inc.
- Yanmar Holdings Co., Ltd.
- TYM Corporation
- Asko Holding
- JC Bamford Excavators Ltd.
- Doosan Bobcat
- Monarch Tractor
Additional Benefits:
- The market estimate (ME) sheet in Excel format
- 3 months of analyst support
TABLE OF CONTENTS
1 Introduction
- 1.1 Study Assumptions and Market Definition
- 1.2 Scope of the Study
2 Research Methodology
3 Executive Summary
4 Market Landscape
- 4.1 Market Overview
- 4.2 Market Drivers
- 4.2.1 Continuous electrification of sub-100 HP models
- 4.2.2 Smart-implement compatibility boosts replacement demand
- 4.2.3 Advanced telematics lower total cost of ownership
- 4.2.4 Precision-Ag incentives in the 2023 U.S. Farm Bill
- 4.2.5 Autonomous retrofit kits reach commercial price points
- 4.2.6 Carbon-credit monetization for low-HP tractors
- 4.3 Market Restraints
- 4.3.1 High upfront and maintenance costs of Tier-4 final engines
- 4.3.2 Fragmented dealership coverage in mountain states
- 4.3.3 Shortage of skilled technicians for sensor-laden models
- 4.3.4 Slow rural 5G rollout limits real-time data services
- 4.4 Regulatory Landscape
- 4.5 Technological Outlook
- 4.6 Porter's Five Forces Analysis
- 4.6.1 Threat of New Entrants
- 4.6.2 Bargaining Power of Buyers
- 4.6.3 Bargaining Power of Suppliers
- 4.6.4 Threat of Substitute Products
- 4.6.5 Intensity of Competitive Rivalry
5 Market Size and Growth Forecasts (Value)
- 5.1 By Horsepower
- 5.1.1 Below 40 HP
- 5.1.2 40-100 HP
- 5.1.3 Above 100 HP
- 5.2 By Tractor Type
- 5.2.1 Utility Tractors
- 5.2.2 Row-Crop Tractors
- 5.2.3 Orchard and Vineyard Tractors
- 5.2.4 Other Tractor Types
- 5.3 By Drive Type
- 5.3.1 Two-Wheel Drive (2WD)
- 5.3.2 Four-Wheel Drive (4WD)
- 5.3.3 Autonomous / Driverless
- 5.4 By Application
- 5.4.1 Cereals and Oilseeds
- 5.4.2 Fruits and Vegetables
- 5.4.3 Livestock Operations
- 5.4.4 Others
6 Competitive Landscape
- 6.1 Market Concentration
- 6.2 Strategic Moves
- 6.3 Market Share Analysis
- 6.4 Company Profiles (Includes Global Level Overview, Market Level Overview, Core Segments, Financials As Available, Strategic Information, Market Rank/Share for Key Companies, Products and Services, and Recent Developments)
- 6.4.1 Deere and Company
- 6.4.2 CNH Industrial N.V.
- 6.4.3 AGCO Corporation
- 6.4.4 Kubota Corporation
- 6.4.5 Mahindra&Mahindra Ltd.
- 6.4.6 CLAAS KGaA mbH
- 6.4.7 SDF S.p.A. (Deutz-Fahr)
- 6.4.8 LS Mtron Ltd.
- 6.4.9 Daedong-USA, Inc.
- 6.4.10 Yanmar Holdings Co., Ltd.
- 6.4.11 TYM Corporation
- 6.4.12 Asko Holding
- 6.4.13 JC Bamford Excavators Ltd.
- 6.4.14 Doosan Bobcat
- 6.4.15 Monarch Tractor
7 Market Opportunities and Future Outlook
 拖拉机农具市场(按农具类型、应用、销售管道和最终用户划分)—2025-2032 年全球预测
 2025 年全球四轮驱动拖拉机市场报告
 输电绝缘子市场,按材料类型、按绝缘子类型、按电压、按应用、按最终用户、按国家/地区 - 2025 年至 2032 年全球行业分析、市场规模、市场份额和预测
 全球氢动力拖拉机市场
 2032 年电动拖拉机市场预测:按传动系统、电池、动力、应用和地区分類的全球分析2032 年二手拖拉机市场预测:按类型、驱动类型、马力、引擎、销售管道、应用和地区进行的全球分析
 曳引机的印度市场评估:马力,驱动类别,各产业,各地区,机会,预测(2019年度~2033年度)全球电动拖拉机市场
 高马力拖拉机市场-全球产业规模、份额、趋势、机会和预测,按类型、应用、地区和竞争细分,2020-2030 年
 全球拖拉机农用设备市场规模(按阶段、功率、驱动装置、区域范围和预测)