


 |
市场调查报告书
商品编码
1848122
快递、速递和小包裹(CEP):市场份额分析、行业趋势、统计数据和成长预测 (2025-2030)Courier, Express, And Parcel (CEP) - Market Share Analysis, Industry Trends & Statistics, Growth Forecasts (2025 - 2030) |
||||||
※ 本网页内容可能与最新版本有所差异。详细情况请与我们联繫。
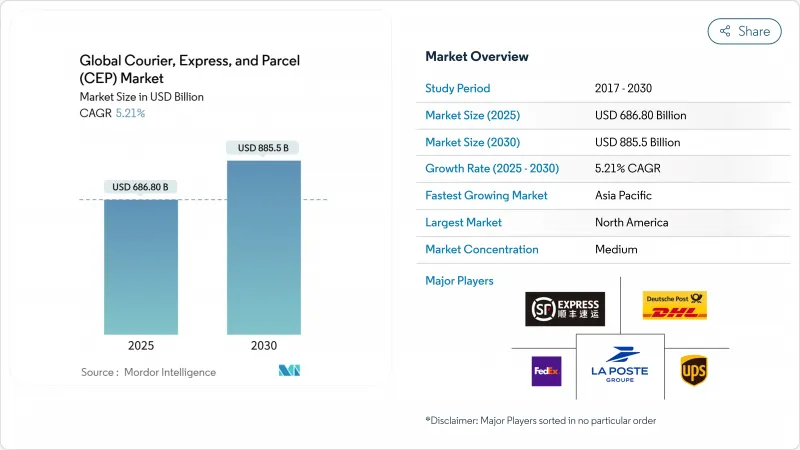
预计到 2025 年,快递、速递和小包裹(CEP) 市场规模将达到 6,868 亿美元,到 2030 年将达到 8,855 亿美元,2025 年至 2030 年的复合年增长率为 5.21%。
这一前景预示着物流业正从疫情期间的激增转向以优质服务、网路自动化和选择性运力扩张为驱动的稳步增长。儘管电子商务仍然是货运量的核心驱动力,但营运商目前正致力于透过动态定价、技术赋能的路线规划以及增值垂直服务(例如医疗物流)来保障利润率。随着越来越多的中小型出口商使用数位化市场,跨境货运量正在成长,但成熟地区的国内货运量已趋于平稳。资本持续流向能够整合航空运力、区域公路车队和宅配枢纽以优化成本和速度的数位化优先网路。诸如DSV收购DB Schenker之类的併购交易凸显了规模的战略价值,因为劳动力短缺、燃油中性车队和航空货运限制提高了营运门槛。
全球快递、速递与小包裹(CEP) 市场趋势与洞察
电子商务的兴起推动了新兴亚太地区B2C小包裹量的成长
智慧型主导购物正在推动小包裹需求成长,目前57%的网购用户使用行动装置进行购物。跨境量也不断成长,主要得益于社群电商的蓬勃发展,预计到2030年,社群电商的销售额将达到8.5兆美元。中国的跨境小包裹流量以及预计到2025年将达到21.4兆元(3.1兆美元)的数位零售市场都在不断扩大,促使营运商部署灵活的枢纽来管理各种类型的包裹。在东南亚地区,对网路建设的投资旨在扩大农村地区的覆盖范围,提高配送时间的可靠性,确保服务水准与城市市场持平。
欧洲地区中小企业利用数位市场进行跨国出口
欧洲中小企业越来越多地透过线上市场直接向全球客户发货,这推动了海关协调的需求。世界贸易组织90个成员国正在就电子商务制定通用规则进行谈判,以减少程序摩擦。自动化申报和基于区块链的文件系统可以将平均贸易成本降低11%。标准化的跨境服务将使企业能够集中货运量、降低单位成本,并扩大快递、速递和小包裹(CEP)市场。
跨太平洋航线的航空运力限制
儘管2024年货机供应量成长了8%,但预计2025年来自中国的需求将成长20%,导致舱位紧张,现货货运价格年增15%。新飞机交付有限,将使未来成长率仅4.4%。随着营运商优先运输高价商品并发展二级枢纽,成本上升将对快递、速递和小包裹(CEP)市场的复合年增长率构成压力。
细分市场分析
2025年至2030年间,医疗保健产业的复合年增长率(CAGR)将达到5.75%,成为成长最快的产业。 DHL和UPS分别计划将医疗保健领域的销售额提升至108亿美元和200亿美元,凸显了其战略重点。即时数据记录器确保了合规性,并为快递小包裹(CEP)市场定价中包含的额外费用提供了依据。
到2024年,电子商务将占销售额的36.94%,但在成熟地区成长将逐渐放缓。製造业和批发业将提供稳定的B2B交易,但随着数位化减少纸本文件的交换,金融服务业的出货量将会下降。
预计2025年至2030年,国际小包裹将以5.57%的复合年增长率成长。贸易协定和海关程序的数位化将简化清关流程,从而推动跨境快递、速递和小包裹(CEP)服务的市场规模成长。国内配送在2024年将维持69.09%的市场份额,但成熟的电子商务的兴起将抑制其成长。
百世公司推出的每公斤7元人民币(约0.98美元)的快递服务等技术赋能型服务,将东南亚消费者与中国商家连结起来,展现了出口一体化带来的成本节约。世贸组织数位贸易框架和区域全面经济伙伴关係协定(RCEP)的关税协调将进一步鼓励中小企业进行国际运输,为成熟的一体化企业拓展获利管道。
区域分析
2024年,北美将占总销售额的36.76%,这主要得益于消费者对两日达服务的期望以及完善的末端物流设施。持续的司机短缺推高了营运成本,促使企业进行自动化试验,并收购UPS-Andlauer等医疗保健领域的专业公司,以确保在细分市场中获得成长。都市区微型履约中心和当日达服务有助于稳定保费,即使货运量成长放缓。
亚太地区将成为成长最快的地区,2025年至2030年的复合年增长率将达到6.77%,主要得益于跨境电子商务和消费者收入的成长。中国21.4兆元人民币(3.1兆美元)的数位零售基础将提高小包裹密度,而RCEP关税同盟将减少贸易摩擦。大和控股的目标是到2027财年实现2兆至2.4兆日圆(2,800亿至3,300亿美元)的销售额,并承诺实现碳中和,以履行区域永续性义务。欧洲将传统的邮政基础设施与积极的脱碳政策结合。荷兰邮政(PostNL)计划到2030年在比荷卢经济联盟实现100%零排放气体配送。 DHL和Ebri的合併结合了国际和国内优势,每年处理超过10亿英国小包裹。
中东和非洲将受益于海湾合作委员会(GCC)的多元化发展计画。沙乌地阿拉伯的自动化中心就是一个例证,该中心透过投资将该地区打造成为洲际运输的桥樑。中部走廊沿线的安全风险和基础设施分散仍然是限製成长的因素,因此与拥有本地专业知识的国家邮政业者建立合作关係更为有利。南美洲虽然面积仍然较小,但正在推进的海关改革,例如巴西的「Remessa Conforme」计划,正在提高数据品质和合规性,并透过全球平台促进跨境服务的扩展。货币波动和道路网络中断使得采取灵活的、因国而异的策略势在必行。
其他福利:
- Excel格式的市场预测(ME)表
- 3个月的分析师支持
目录
第一章 引言
- 研究假设和市场定义
- 调查范围
第二章调查方法
第三章执行摘要
第四章 市场情势
- 市场概览
- 人口统计数据
- 按经济活动分類的GDP分配
- 按经济活动分類的GDP成长
- 通货膨胀
- 经济表现及概况
- 电子商务产业的趋势
- 製造业趋势
- 运输和仓储部门的GDP
- 出口趋势
- 进口趋势
- 燃油价格
- 物流绩效
- 基础设施
- 法律规范
- 价值炼和通路分析
- 市场驱动因素
- 新兴亚太地区电子商务渗透率的提高推动了B2C小包裹量的成长。
- 欧洲中小企业利用数位市场进行跨境出口
- 北美当日送达服务的优质化
- 海湾合作委员会国家政府推动邮政网路现代化
- 在北欧引进户外PUDO网络
- 日本医疗保健低温运输合规要求
- 市场限制
- 跨太平洋航空运力限制
- 美国和英国长期存在的司机短缺问题影响了最后一公里配送成本。
- 欧盟27国实施外送车辆排放法规
- 中非走廊沿线安全风险日益上升
- 市场创新
- 波特五力分析
- 竞争对手之间的竞争
- 新进入者的威胁
- 供应商的议价能力
- 买方的议价能力
- 替代品的威胁
第五章 市场规模与成长预测
- 目的地
- 国内的
- 国际的
- 配送速度
- 表达
- 非快递
- 模型
- 企业对企业 (B2B)
- 企业对消费者 (B2C)
- 消费者对消费者 (C2C)
- 运输重量
- 重型货物
- 轻量级货币
- 中等重量
- 交通途径
- 航空
- 路
- 其他的
- 终端用户产业
- 电子商务
- 金融服务(BFSI)
- 卫生保健
- 製造业
- 一级产业
- 批发零售(线下)
- 其他的
- 地区
- 亚太地区
- 澳洲
- 中国
- 印度
- 印尼
- 日本
- 马来西亚
- 巴基斯坦
- 菲律宾
- 泰国
- 越南
- 亚太其他地区
- 欧洲
- 阿尔巴尼亚
- 保加利亚
- 克罗埃西亚
- 捷克共和国
- 丹麦
- 爱沙尼亚
- 芬兰
- 法国
- 德国
- 匈牙利
- 冰岛
- 义大利
- 拉脱维亚
- 立陶宛
- 荷兰
- 挪威
- 波兰
- 罗马尼亚
- 俄罗斯
- 斯洛伐克共和国
- 斯洛维尼亚
- 西班牙
- 瑞典
- 瑞士
- 英国
- 其他欧洲地区
- 中东和非洲
- 卡达
- 沙乌地阿拉伯
- 阿拉伯聯合大公国
- 埃及
- 奈及利亚
- 南非
- 其他中东和非洲地区
- 北美洲
- 加拿大
- 墨西哥
- 美国
- 北美其他地区
- 南美洲
- 阿根廷
- 巴西
- 智利
- 其他南美洲
- 亚太地区
第六章 竞争情势
- 市场集中度
- 关键策略倡议
- 市占率分析
- 公司简介
- Aramex
- Australian Postal Corporation
- Canada Post Corporation(Including Purolator, Inc.)
- China Post
- CJ Logistics
- Deppon Logistics Co., Ltd.
- DHL Group
- Empresa Brasileira de Correios e Telegrafos
- FedEx
- InPost Sp. z oo
- International Distribution Services PLC
- JD.com, Inc.(Including JD Logistics, Inc.)
- La Poste Group(Including DPD Group)
- LX International Corp.(Including LX Pantos Co., Ltd.)
- Osterreichische Post AG(Austrian Post)
- Poste Italiane
- PostNL NV
- PostNord AB
- SF Express(KEX-SF)
- SG Holdings Co., Ltd.
- STO Express Co., Ltd.(Shentong Express)
- Swiss Post, Ltd.
- United Parcel Service of America, Inc.(UPS)
- Yamato Holdings Co., Ltd.
- ZTO Express(Cayman), Inc.
第七章 市场机会与未来展望
The courier express parcel market size is valued at USD 686.8 billion in 2025 and is forecast to reach USD 885.5 billion by 2030, advancing at a 5.21% CAGR between 2025-2030.
This outlook signals a transition from the pandemic-era surge toward steadier expansion led by premium services, network automation, and selective capacity additions. E-commerce remains the core volume engine, yet operators now emphasize margin protection through dynamic pricing, technology-enabled routing, and value-added verticals such as healthcare logistics. Cross-border flows are expanding as more small and medium exporters rely on digital marketplaces, while domestic volumes plateau in mature regions. Capital continues gravitating to digital-first networks able to integrate air capacity, regional road fleets, and out-of-home delivery points to optimize cost and speed. Consolidation, highlighted by DSV's purchase of DB Schenker, underlines the strategic value of scale as labor shortages, fuel-neutral fleets, and air-freight constraints raise operating thresholds.
Global Courier, Express, And Parcel (CEP) Market Trends and Insights
E-commerce Penetration Driving B2C Parcel Volumes in Emerging Asia-Pacific Region
Smartphone-led shopping now drives parcel demand as 57% of online buyers purchase via mobile devices. Cross-border volumes climb in tandem with social-commerce sales, projected at USD 8.5 trillion by 2030. China's cross-border parcel flows grew alongside a RMB 21.4 trillion (USD 3.01 trillion) digital-retail sector in 2025, prompting operators to deploy flexible hubs that manage varied package profiles. Network investments across Southeast Asia target wider rural reach and delivery-time certainty, ensuring service parity with urban markets.
Cross-Border SME Exports Leveraging Digital Marketplaces in Europe Region
European SMEs increasingly ship direct to global customers through online marketplaces, intensifying demand for harmonized customs clearance. Negotiations among 90 WTO members seek common e-commerce rules to reduce procedural friction. Automated declarations and blockchain-backed documents can cut average trade costs by 11%. Standardized cross-border services enable operators to pool volumes, lower unit costs, and enlarge the courier express parcel market.
Air-Capacity Constraints on the Trans-Pacific Lanes
Freighter supply rose 8% in 2024, yet demand from China is set to climb 20% in 2025, tightening space and lifting spot rates 15% year-on-year. Limited new-aircraft deliveries cap future growth near 4.4%. Operators prioritize high-value goods and explore secondary hubs, but elevated costs weigh on the courier express parcel market CAGR.
Other drivers and restraints analyzed in the detailed report include:
- Same-Day Delivery Premiumization in Urban North America
- Government Push for Postal Network Modernization in GCC Countries
- Chronic Driver Shortage
For complete list of drivers and restraints, kindly check the Table Of Contents.
Segment Analysis
Healthcare recorded the fastest 5.75% CAGR between 2025-2030 as aging populations lift demand for temperature-controlled deliveries. DHL and UPS aim to grow healthcare revenues to USD 10.8 billion and USD 20 billion, respectively, underscoring strategic focus. Real-time data loggers ensure compliance, justifying premium fees embedded within the overall courier express parcel market pricing.
E-commerce still represented 36.94% of 2024 revenue but shows a gradual deceleration in mature regions. Manufacturing and wholesale trade offer steady B2B flows, while financial services shipments decline as digitization reduces physical document exchange.
International parcels are projected to expand at a 5.57% CAGR between 2025-2030. The courier express parcel market size tied to cross-border flows is set to widen as trade agreements and electronic customs procedures simplify clearance. Domestic deliveries keep a 69.09% share in 2024, but mature e-commerce penetration caps growth.
Technology-enabled services such as BEST Inc.'s CNY 7 (USD 0.98) per-kilogram offering connect Southeast Asian shoppers to Chinese merchants, illustrating cost reductions through consolidated exports. WTO digital-trade frameworks and RCEP customs harmonization further encourage SMEs to ship internationally, expanding high-margin lanes for established integrators.
The Global Courier, Express, and Parcel (CEP) Market Report is Segmented by Destination (Domestic and International), by Speed of Delivery (Express and More), by Model (Business-To-Business and More), by Shipment Weight (Heavy Weight Shipments and More), Mode of Transport (Air and More), by End User Industry (E-Commerce and More), and by Geography (Asia-Pacific and More). The Market Forecasts are Provided in Terms of Value (USD).
Geography Analysis
North America commanded 36.76% of 2024 revenue, anchored by consumer expectations for two-day delivery and developed last-mile assets. Persistent driver shortages magnify operating costs, prompting automation pilots and the acquisition of healthcare specialists such as UPS-Andlauer to secure growth niches. Urban micro-fulfillment centers and same-day offerings support premium-rate stability even as volume growth moderates.
Asia-Pacific is the fastest-growing region at 6.77% CAGR between 2025-2030, propelled by cross-border e-commerce and rising consumer incomes. China's RMB 21.4 trillion (USD 3.01 trillion) digital retail base drives parcel density, while RCEP customs alignment lowers friction. Yamato Holdings targets JPY 2-2.4 trillion (USD 0.28-0.33 trillion) revenue by FY2027, embedding carbon-neutral pledges to align with regional sustainability mandates. Europe combines legacy postal infrastructure with aggressive decarbonization policies. The ban on new combustion vans by 2035 accelerates fleet electrification; PostNL plans 100% emission-free Benelux delivery by 2030. DHL's merger with Evri pools international and domestic strengths to handle more than 1 billion UK parcels per year.
Middle East and Africa benefit from GCC diversification programs. Saudi Arabia's automated hub exemplifies investments positioning the region as an intercontinental transit bridge. Security risks on central corridors and fragmented infrastructure still temper growth, favoring partnerships with national postal operators that bring local expertise. South America remains smaller but developing customs reforms, such as Brazil's Remessa Conforme program, improve data quality and compliance, encouraging global platforms to expand cross-border offerings. Currency volatility and patchy road networks require flexible, country-specific approaches.
- Aramex
- Australian Postal Corporation
- Canada Post Corporation (Including Purolator, Inc.)
- China Post
- CJ Logistics
- Deppon Logistics Co., Ltd.
- DHL Group
- Empresa Brasileira de Correios e Telegrafos
- FedEx
- InPost Sp. z o.o.
- International Distribution Services PLC
- JD.com, Inc. (Including JD Logistics, Inc.)
- La Poste Group (Including DPD Group)
- LX International Corp. (Including LX Pantos Co., Ltd.)
- Osterreichische Post AG (Austrian Post)
- Poste Italiane
- PostNL N.V.
- PostNord AB
- SF Express (KEX-SF)
- SG Holdings Co., Ltd.
- STO Express Co., Ltd. (Shentong Express)
- Swiss Post, Ltd.
- United Parcel Service of America, Inc. (UPS)
- Yamato Holdings Co., Ltd.
- ZTO Express (Cayman), Inc.
Additional Benefits:
- The market estimate (ME) sheet in Excel format
- 3 months of analyst support
TABLE OF CONTENTS
1 Introduction
- 1.1 Study Assumptions and Market Definition
- 1.2 Scope of the Study
2 Research Methodology
3 Executive Summary
4 Market Landscape
- 4.1 Market Overview
- 4.2 Demographics
- 4.3 GDP Distribution by Economic Activity
- 4.4 GDP Growth by Economic Activity
- 4.5 Inflation
- 4.6 Economic Performance and Profile
- 4.6.1 Trends in E-Commerce Industry
- 4.6.2 Trends in Manufacturing Industry
- 4.7 Transport and Storage Sector GDP
- 4.8 Export Trends
- 4.9 Import Trends
- 4.10 Fuel Price
- 4.11 Logistics Performance
- 4.12 Infrastructure
- 4.13 Regulatory Framework
- 4.14 Value Chain and Distribution Channel Analysis
- 4.15 Market Drivers
- 4.15.1 E-commerce Penetration Driving B2C Parcel Volumes in Emerging Asia-Pacific Region
- 4.15.2 Cross-Border SME Exports Leveraging Digital Marketplaces in Europe Region
- 4.15.3 Same-Day Delivery Premiumization in Urban North America
- 4.15.4 Government Push for Postal Network Modernization in GCC Countries
- 4.15.5 Adoption of Out-of-Home PUDO Networks in Nordics
- 4.15.6 Cold-Chain Compliance Requirements for Healthcare CEP in Japan
- 4.16 Market Restraints
- 4.16.1 Air Capacity Constraints Witnessed on the Trans-Pacific Lanes
- 4.16.2 Chronic Driver Shortage Impacting Last-Mile Costs in the US and UK
- 4.16.3 Regulatory Caps Implementation on Delivery Fleet Emissions in EU27
- 4.16.4 Rising Security Risks on Africa's Central Corridor Routes
- 4.17 Technology Innovations in the Market
- 4.18 Porter's Five Forces Analysis
- 4.18.1 Competitive Rivalry
- 4.18.2 Threat of New Entrants
- 4.18.3 Bargaining Power of Suppliers
- 4.18.4 Bargaining Power of Buyers
- 4.18.5 Threat of Substitutes
5 Market Size and Growth Forecasts (Value, USD)
- 5.1 Destination
- 5.1.1 Domestic
- 5.1.2 International
- 5.2 Speed of Delivery
- 5.2.1 Express
- 5.2.2 Non-Express
- 5.3 Model
- 5.3.1 Business-to-Business (B2B)
- 5.3.2 Business-to-Consumer (B2C)
- 5.3.3 Consumer-to-Consumer (C2C)
- 5.4 Shipment Weight
- 5.4.1 Heavy Weight Shipments
- 5.4.2 Light Weight Shipments
- 5.4.3 Medium Weight Shipments
- 5.5 Mode of Transport
- 5.5.1 Air
- 5.5.2 Road
- 5.5.3 Others
- 5.6 End User Industry
- 5.6.1 E-Commerce
- 5.6.2 Financial Services (BFSI)
- 5.6.3 Healthcare
- 5.6.4 Manufacturing
- 5.6.5 Primary Industry
- 5.6.6 Wholesale and Retail Trade (Offline)
- 5.6.7 Others
- 5.7 Geography
- 5.7.1 Asia-Pacific
- 5.7.1.1 Australia
- 5.7.1.2 China
- 5.7.1.3 India
- 5.7.1.4 Indonesia
- 5.7.1.5 Japan
- 5.7.1.6 Malaysia
- 5.7.1.7 Pakistan
- 5.7.1.8 Philippines
- 5.7.1.9 Thailand
- 5.7.1.10 Vietnam
- 5.7.1.11 Rest of Asia-Pacific
- 5.7.2 Europe
- 5.7.2.1 Albania
- 5.7.2.2 Bulgaria
- 5.7.2.3 Croatia
- 5.7.2.4 Czech Republic
- 5.7.2.5 Denmark
- 5.7.2.6 Estonia
- 5.7.2.7 Finland
- 5.7.2.8 France
- 5.7.2.9 Germany
- 5.7.2.10 Hungary
- 5.7.2.11 Iceland
- 5.7.2.12 Italy
- 5.7.2.13 Latvia
- 5.7.2.14 Lithuania
- 5.7.2.15 Netherlands
- 5.7.2.16 Norway
- 5.7.2.17 Poland
- 5.7.2.18 Romania
- 5.7.2.19 Russia
- 5.7.2.20 Slovak Republic
- 5.7.2.21 Slovenia
- 5.7.2.22 Spain
- 5.7.2.23 Sweden
- 5.7.2.24 Switzerland
- 5.7.2.25 United Kingdom
- 5.7.2.26 Rest of Europe
- 5.7.3 Middle East and Africa
- 5.7.3.1 Qatar
- 5.7.3.2 Saudi Arabia
- 5.7.3.3 UAE
- 5.7.3.4 Egypt
- 5.7.3.5 Nigeria
- 5.7.3.6 South Africa
- 5.7.3.7 Rest of Middle East and Africa
- 5.7.4 North America
- 5.7.4.1 Canada
- 5.7.4.2 Mexico
- 5.7.4.3 United States
- 5.7.4.4 Rest of North America
- 5.7.5 South America
- 5.7.5.1 Argentina
- 5.7.5.2 Brazil
- 5.7.5.3 Chile
- 5.7.5.4 Rest of South America
- 5.7.1 Asia-Pacific
6 Competitive Landscape
- 6.1 Market Concentration
- 6.2 Key Strategic Moves
- 6.3 Market Share Analysis
- 6.4 Company Profiles (Includes Global Level Overview, Market Level Overview, Core Segments, Financials as Available, Strategic Information, Market Rank/Share for Key Companies, Products and Services, and Recent Developments)
- 6.4.1 Aramex
- 6.4.2 Australian Postal Corporation
- 6.4.3 Canada Post Corporation (Including Purolator, Inc.)
- 6.4.4 China Post
- 6.4.5 CJ Logistics
- 6.4.6 Deppon Logistics Co., Ltd.
- 6.4.7 DHL Group
- 6.4.8 Empresa Brasileira de Correios e Telegrafos
- 6.4.9 FedEx
- 6.4.10 InPost Sp. z o.o.
- 6.4.11 International Distribution Services PLC
- 6.4.12 JD.com, Inc. (Including JD Logistics, Inc.)
- 6.4.13 La Poste Group (Including DPD Group)
- 6.4.14 LX International Corp. (Including LX Pantos Co., Ltd.)
- 6.4.15 Osterreichische Post AG (Austrian Post)
- 6.4.16 Poste Italiane
- 6.4.17 PostNL N.V.
- 6.4.18 PostNord AB
- 6.4.19 SF Express (KEX-SF)
- 6.4.20 SG Holdings Co., Ltd.
- 6.4.21 STO Express Co., Ltd. (Shentong Express)
- 6.4.22 Swiss Post, Ltd.
- 6.4.23 United Parcel Service of America, Inc. (UPS)
- 6.4.24 Yamato Holdings Co., Ltd.
- 6.4.25 ZTO Express (Cayman), Inc.
7 Market Opportunities and Future Outlook
- 7.1 White-Space and Unmet-Need Assessment
 2026年全球超当地语系化配送应用市场报告
 2026-2030年全球宅配包裹(CEP)市场
 宅配、包裹及小包裹市场报告:按服务类型、目的地、物品、最终用途行业和地区划分(2026-2034 年)2026年全球宅配车辆市场报告
 超当地语系化配送应用市场分析及预测(至2035年):按类型、产品、服务、技术、组件、应用、设备、流程、部署类型及最终用户划分
 亚太地区快递、速递和小包裹(CEP):市场份额分析、行业趋势和统计数据、成长预测(2026-2031)泰国快递、速递和小包裹(CEP) 市场份额分析、行业趋势和统计数据、成长预测 (2026-2031)美国快递、速递和小包裹(CEP):市场份额分析、行业趋势和统计数据、成长预测 (2026-2031)英国快递、速递和小包裹(CEP) 市场份额分析、行业趋势和统计数据、成长预测 (2026-2031)越南快递、速递和小包裹(CEP):市场份额分析、行业趋势和统计数据、成长预测(2026-2031)