


 |
市场调查报告书
商品编码
1849814
虚拟实境 (VR):市场占有率分析、产业趋势、统计数据和成长预测(2025-2030 年)Virtual Reality (VR) - Market Share Analysis, Industry Trends & Statistics, Growth Forecasts (2025 - 2030) |
||||||
※ 本网页内容可能与最新版本有所差异。详细情况请与我们联繫。
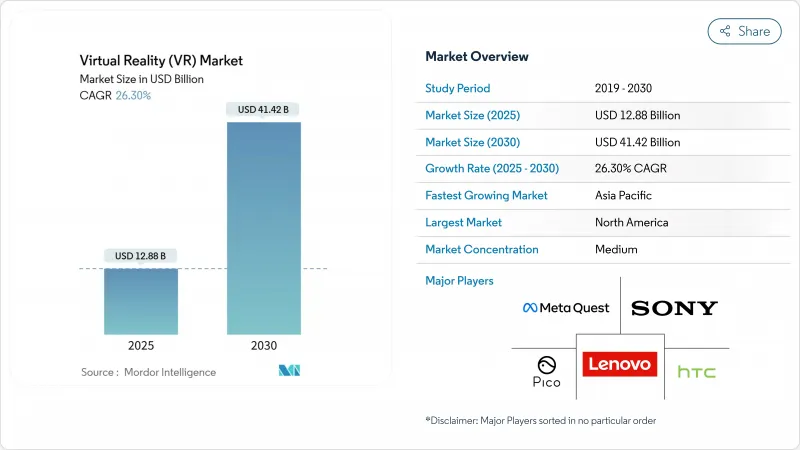
虚拟实境市场规模预计在 2025 年达到 128.8 亿美元,预计到 2030 年将达到 414.2 亿美元,复合年增长率为 26.30%。
企业快速采用身临其境型训练平台、混合实境处理器日益普及以及5G边缘基础设施日趋成熟,这些因素共同支撑着这项扩张。企业净零排放承诺正在加速对线上优先活动的需求,而监管部门对治疗应用的批准则正在拓展该技术的覆盖范围,使其超越娱乐领域。虽然硬体创新仍然至关重要,但随着企业优先考虑客製化内容、强大的分析能力以及与学习管理系统的无缝集成,软体和服务也正在蓬勃发展。
全球虚拟实境 (VR) 市场趋势与洞察
企业越来越多地采用 VR 培训
试办成功后,各公司纷纷全面推广VR培训项目,并表示与传统方法相比,VR训练时间缩短了75%,学员信心提升了275%。波音公司将训练时间缩短了75%,Delta航空将技术人员的熟练度评估提高了5000%。培训人数达375人即可达到收支平衡,而一旦培训人数超过3000人,成本效益将提升52%。超过75%的《财富》500强企业现已将VR纳入其学习策略,包括沃尔玛的零售模拟和美国的心理健康模组,而日本Sompo等保险公司也在实施VR危险模拟,以减少职场事故。结果是,员工的知识保留率更高,在职表现更安全,从而牢固确立了培训作为企业进入虚拟实境市场的重要切入点的地位。
混合实境GPU 和 SoC 成为主流
高通骁龙 XR2+ Gen 2 等下一代晶片组将实现单眼 4.3K 分辨率,并协调 12 个摄影机进行空间映射,为中阶头显带来旗舰级性能。苹果 Vision Pro 采用双晶片驱动 2,300 万像素微型 OLED 面板,展现出处理需求曲线。仅显示组件一项就使单价增加 530 美元,因此动态注视点渲染和眼动追踪技术对于提升效率至关重要。三星-谷歌-高通的合作标誌着这些硅片技术进步的商业化,将逐步降低价格分布并拓宽虚拟实境市场的准入。
晕屏症和长期前庭问题
运动与光线不匹配会导致噁心、头痛和方向感丧失,进而影响长时间的体验。感官不匹配的研究表明,视觉-前庭不匹配是一个关键因素,而设备抖动导致的行动VR复杂性加剧了这个问题。 FDA医用头戴式耳机指南要求在显着位置标註噁心警告,以强调其临床意义。儘管硬体製造商追求更高的刷新率和更短的延迟,但生理限制仍然存在。一些公司为了降低风险,选择使用更短的模组,这推高了内容设计成本,并减缓了虚拟实境市场近期的成长。
其他福利:
- Excel 格式的市场预测 (ME) 表
- 3个月的分析师支持
目录
第一章 引言
- 研究假设和市场定义
- 调查范围
第二章调查方法
第三章执行摘要
第四章 市场状况
- 市场概况
- 市场驱动因素
- 企业越来越多地采用 VR 培训
- 「混合实境」 GPU 和 SoC 的普及
- 使用 5G/Edge 进行 VR 内容的无线传输
- 企业净零承诺推动「虚拟优先」活动
- VR 心理健康治疗获得监管部门核准
- 超音波触觉技术可实现无需控制器的互动
- 市场限制
- 晕动症和长期前庭功能障碍
- 眼罩内的热量累积限制了连续使用
- 游戏以外缺乏 AAA VR 内容
- 眼动追踪分析中的资料隐私合规成本
- 供应链分析
- 监管格局
- 技术展望
- 波特五力分析
- 供应商的议价能力
- 买方的议价能力
- 新进入者的威胁
- 替代品的威胁
- 竞争的激烈程度
- 宏观经济因素评估
第五章市场规模及成长预测
- 按报价
- 硬体
- 软体
- 服务
- 按设备外形尺寸
- 系留式 HMD
- 独立式 HMD
- 无萤幕检视器
- CAVE/身临其境型房间
- 依沉浸程度
- 非身临其境型
- 半身临其境型
- 完全身临其境型
- 按最终用户产业
- 游戏
- 媒体和娱乐
- 卫生保健
- 教育和培训
- 军事和国防
- 零售与电子商务
- 房地产和建筑
- 按地区
- 北美洲
- 美国
- 加拿大
- 墨西哥
- 南美洲
- 巴西
- 阿根廷
- 南美洲其他地区
- 欧洲
- 德国
- 英国
- 法国
- 义大利
- 西班牙
- 其他欧洲地区
- 亚太地区
- 中国
- 日本
- 印度
- 韩国
- 澳洲
- 其他亚太地区
- 中东和非洲
- 中东
- 沙乌地阿拉伯
- 阿拉伯聯合大公国
- 土耳其
- 其他中东地区
- 非洲
- 南非
- 奈及利亚
- 埃及
- 其他非洲国家
- 北美洲
第六章 竞争态势
- 市场集中度
- 策略趋势
- 市占率分析
- 公司简介
- Meta Platforms(Meta Quest)
- Sony Corporation
- HTC Corporation
- Samsung Electronics Co. Ltd
- Apple Inc.
- Qualcomm Technologies Inc.
- Lenovo Group Ltd
- Pico Interactive Inc.
- Valve Corporation
- Varjo Technologies Oy
- Microsoft Corporation
- Magic Leap Inc.
- Vuzix Corporation
- FOVE Inc.
- DPVR(Lexiang Tech Co. Ltd)
- Unity Technologies Inc.
- Unreal Engine(Epic Games Inc.)
- Autodesk Inc.
- Dassault Systemes SE
- 3D Systems Corporation
第七章 市场机会与未来展望
The Virtual Reality market size is estimated at USD 12.88 billion in 2025 and is projected to reach USD 41.42 billion by 2030, advancing at a 26.30% CAGR.
Rapid enterprise adoption of immersive training platforms, rising availability of mixed-reality-ready processors, and maturing 5G edge infrastructure underpin this expansion. Corporate net-zero pledges accelerate demand for virtual-first events, while regulatory clearances for therapeutic applications extend the technology's reach beyond entertainment. Hardware innovation remains vital, yet software and services gain momentum as organizations prioritize tailored content, robust analytics, and seamless integration with learning-management systems.
Global Virtual Reality (VR) Market Trends and Insights
Rising Enterprise-Wide VR Training Adoption
Organizations roll out full-scale VR training programs after pilot success, citing a 75% reduction in training time and a 275% jump in learner confidence versus conventional methods. Boeing recorded a 75% cut in training hours, and Delta Air Lines raised technician proficiency checks by 5,000%. Break-even arrives at 375 learners and becomes 52% more cost-effective once cohorts exceed 3,000. Over 75% of Fortune 500 companies now embed VR in learning strategies, including Walmart's retail simulations and the U.S. Army's mental-health modules, while Japanese insurers such as SOMPO deploy VR hazard simulations to curb workplace incidents. The outcome is stronger knowledge retention and safer on-the-job performance, cementing training as the principal enterprise gateway into the Virtual Reality market.
Mainstreaming of Mixed-Reality-Ready GPUs and SoCs
Next-generation chipsets like Qualcomm's Snapdragon XR2+ Gen 2 deliver 4.3 K-per-eye resolution and orchestrate a dozen cameras for spatial mapping, bringing flagship performance to mid-range headsets. Apple's Vision Pro employs dual chips to drive 23 million-pixel micro-OLED panels, illustrating processing demand curves. Display components alone add USD 530 to unit costs, so dynamic foveated rendering and eye-tracking become essential for efficiency. Samsung's three-way alliance with Google and Qualcomm signals mainstream commercialisation of these silicon advances, progressively lowering price points and broadening access to the Virtual Reality market.
Cybersickness and Long-Term Vestibular Concerns
Motion-to-photon discrepancies trigger nausea, headache, and disorientation, discouraging extended sessions. Sensory-conflict research pinpoints combined visual-vestibular mismatch as the main cause, intensified in mobile VR where device sway adds complexity. FDA guidelines for medical-grade headsets mandate prominent nausea warnings, highlighting clinical gravity. Hardware makers pursue higher refresh rates and latency cuts, yet physiological limits persist. Enterprises mitigate risk through shorter modules, raising content design costs and dampening near-term Virtual Reality market growth.
Other drivers and restraints analyzed in the detailed report include:
- 5G/Edge-Powered Untethered Streaming of VR Content
- Corporate Net-Zero Pledges Driving Virtual-First Events
- Eye-Box Heat Build-Up Limiting Continuous Usage
For complete list of drivers and restraints, kindly check the Table Of Contents.
List of Companies Covered in this Report:
- Meta Platforms (Meta Quest)
- Sony Corporation
- HTC Corporation
- Samsung Electronics Co. Ltd
- Apple Inc.
- Qualcomm Technologies Inc.
- Lenovo Group Ltd
- Pico Interactive Inc.
- Valve Corporation
- Varjo Technologies Oy
- Microsoft Corporation
- Magic Leap Inc.
- Vuzix Corporation
- FOVE Inc.
- DPVR (Lexiang Tech Co. Ltd)
- Unity Technologies Inc.
- Unreal Engine (Epic Games Inc.)
- Autodesk Inc.
- Dassault Systemes SE
- 3D Systems Corporation
Additional Benefits:
- The market estimate (ME) sheet in Excel format
- 3 months of analyst support
TABLE OF CONTENTS
1 INTRODUCTION
- 1.1 Study Assumptions and Market Definition
- 1.2 Scope of the Study
2 RESEARCH METHODOLOGY
3 EXECUTIVE SUMMARY
4 MARKET LANDSCAPE
- 4.1 Market Overview
- 4.2 Market Drivers
- 4.2.1 Rising enterprise-wide VR training adoption
- 4.2.2 Mainstreaming of "mixed reality-ready" GPUs and SoCs
- 4.2.3 5G/Edge-powered untethered streaming of VR content
- 4.2.4 Corporate Net-Zero pledges driving 'virtual-first' events
- 4.2.5 Regulatory approvals for VR-based mental-health therapies
- 4.2.6 Ultrasound-haptics enabling controller-free interaction
- 4.3 Market Restraints
- 4.3.1 Cybersickness and long-term vestibular concerns
- 4.3.2 Eye-box heat build-up limiting continuous usage
- 4.3.3 Scarcity of AAA-grade VR content outside gaming
- 4.3.4 Data-privacy compliance costs for eye-tracking analytics
- 4.4 Supply-Chain Analysis
- 4.5 Regulatory Landscape
- 4.6 Technological Outlook
- 4.7 Porter's Five Force Analysis
- 4.7.1 Bargaining Power of Suppliers
- 4.7.2 Bargaining Power of Buyers
- 4.7.3 Threat of New Entrants
- 4.7.4 Threat of Substitutes
- 4.7.5 Intensity of Rivalry
- 4.8 Assessment of Macroeconomic Factors
5 MARKET SIZE AND GROWTH FORECASTS (VALUE)
- 5.1 By Offering
- 5.1.1 Hardware
- 5.1.2 Software
- 5.1.3 Services
- 5.2 By Device Form Factor
- 5.2.1 Tethered HMD
- 5.2.2 Stand-alone HMD
- 5.2.3 Screenless Viewer
- 5.2.4 CAVE / Immersive Rooms
- 5.3 By Immersion Level
- 5.3.1 Non-Immersive
- 5.3.2 Semi-Immersive
- 5.3.3 Fully-Immersive
- 5.4 By End-User Industry
- 5.4.1 Gaming
- 5.4.2 Media and Entertainment
- 5.4.3 Healthcare
- 5.4.4 Education and Training
- 5.4.5 Military and Defense
- 5.4.6 Retail and eCommerce
- 5.4.7 Real Estate and Architecture
- 5.5 By Geography
- 5.5.1 North America
- 5.5.1.1 United States
- 5.5.1.2 Canada
- 5.5.1.3 Mexico
- 5.5.2 South America
- 5.5.2.1 Brazil
- 5.5.2.2 Argentina
- 5.5.2.3 Rest of South America
- 5.5.3 Europe
- 5.5.3.1 Germany
- 5.5.3.2 United Kingdom
- 5.5.3.3 France
- 5.5.3.4 Italy
- 5.5.3.5 Spain
- 5.5.3.6 Rest of Europe
- 5.5.4 Asia-Pacific
- 5.5.4.1 China
- 5.5.4.2 Japan
- 5.5.4.3 India
- 5.5.4.4 South Korea
- 5.5.4.5 Australia
- 5.5.4.6 Rest of Asia-Pacific
- 5.5.5 Middle East and Africa
- 5.5.5.1 Middle East
- 5.5.5.1.1 Saudi Arabia
- 5.5.5.1.2 United Arab Emirates
- 5.5.5.1.3 Turkey
- 5.5.5.1.4 Rest of Middle East
- 5.5.5.2 Africa
- 5.5.5.2.1 South Africa
- 5.5.5.2.2 Nigeria
- 5.5.5.2.3 Egypt
- 5.5.5.2.4 Rest of Africa
- 5.5.1 North America
6 COMPETITIVE LANDSCAPE
- 6.1 Market Concentration
- 6.2 Strategic Moves
- 6.3 Market Share Analysis
- 6.4 Company Profiles (includes Global level Overview, Market level overview, Core Segments, Financials as available, Strategic Information, Market Rank/Share, Products and Services, Recent Developments)
- 6.4.1 Meta Platforms (Meta Quest)
- 6.4.2 Sony Corporation
- 6.4.3 HTC Corporation
- 6.4.4 Samsung Electronics Co. Ltd
- 6.4.5 Apple Inc.
- 6.4.6 Qualcomm Technologies Inc.
- 6.4.7 Lenovo Group Ltd
- 6.4.8 Pico Interactive Inc.
- 6.4.9 Valve Corporation
- 6.4.10 Varjo Technologies Oy
- 6.4.11 Microsoft Corporation
- 6.4.12 Magic Leap Inc.
- 6.4.13 Vuzix Corporation
- 6.4.14 FOVE Inc.
- 6.4.15 DPVR (Lexiang Tech Co. Ltd)
- 6.4.16 Unity Technologies Inc.
- 6.4.17 Unreal Engine (Epic Games Inc.)
- 6.4.18 Autodesk Inc.
- 6.4.19 Dassault Systemes SE
- 6.4.20 3D Systems Corporation
7 MARKET OPPORTUNITIES AND FUTURE OUTLOOK
- 7.1 White-space and Unmet-Need Assessment
 2026年全球虚拟实境市场报告2026年全球虚拟实境地球仪市场报告2026年全球虚拟实境服务市场报告2026年全球虚拟实境(VR)社交平臺市场报告2026年5G虚拟实境(VR)全球市场报告2026年全球皮质触觉虚拟实境手套市场报告2026年全球虚拟实境治疗硬体市场报告
 虚拟实境 (VR) 市场分析及预测(至 2035 年):按类型、产品类型、服务、技术、组件、应用、设备、最终用户、部署类型和解决方案划分
 教育领域的虚拟实境:市场占有率分析、产业趋势与统计、成长预测(2026-2031)
 虚拟实境(VR)全球市场规模、份额、趋势和成长分析报告(2026-2034)