


 |
市场调查报告书
商品编码
1849864
防爆设备:市场占有率分析、产业趋势、统计数据和成长预测(2025-2030 年)Explosion Proof Equipment - Market Share Analysis, Industry Trends & Statistics, Growth Forecasts (2025 - 2030) |
||||||
※ 本网页内容可能与最新版本有所差异。详细情况请与我们联繫。
预计到 2025 年,防爆设备市场规模将达到 99.6 亿美元,到 2030 年将达到 135.1 亿美元,年复合成长率为 6.29%。
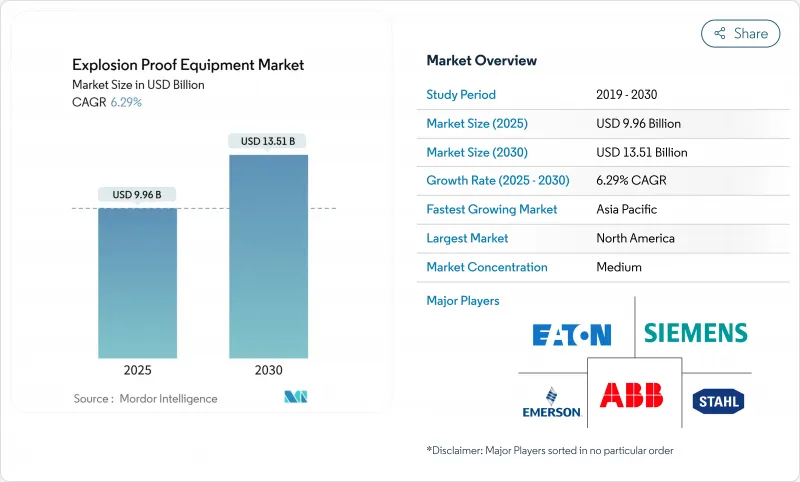
ATEX 和 IECEx 法规的普遍实施、绿色氢能工厂的快速建设以及对工业物联网 (IIoT) 赋能改造的持续资本投入,推动了危险区域的预测性维修,从而促进了市场扩张。此外,海上和陆上设施大规模采用 LED 照明以及亚太地区锂离子超级工厂的推出也推动了需求成长,这些项目都需要用于防尘区域的防护设备。北美地区凭藉 OSHA 法规和老旧设备的现代化改造,保持了其市场主导;而亚太地区则凭藉新兴的氢能走廊、电池供应炼和化工产业丛集,实现了最快的市场成长。 ABB、西门子和伊顿等公司正将其资产负债表优势重新配置到本地製造能力,而新参与企业则填补了细分认证领域的空白,因此市场竞争格局仍保持适度分散。近期面临的不利因素包括铸件短缺和对中国製造外壳征收关税,这些因素正在挤压利润空间并促使企业采用多元化采购模式。
全球防爆设备市场趋势与洞察
全球加强ATEX/IECEx执法力度
监理机关于2024年4月加强了ATEX防爆指南,收紧了合格评定标准,并将测试量年增了40%。土耳其和韩国也采取了类似倡议,颁布了符合IECEx标准的法规,迫使供应商升级通常已运作20年的老旧生产线。跨国公司欢迎这种协调统一的做法,因为单一认证能够实现跨区域销售,缩短週期时间,并减少工程差异。这些日益严格的法规正在加速炼油厂、化工园区、液化天然气出口中心等场所的设备更新换代需求。
更多绿色氢能计划需要一级设备
氢气在空气中的可燃性为4%至75%,极易引发火灾,因此需要复杂的密闭、侦测和通风系统。中国、澳洲和墨西哥湾沿岸的吉瓦级电解槽正在采购客製化的防火开关设备和本质安全型感测器,从而在防爆设备市场中建立起专属的采购管道。拥有氢气专业认证的供应商正在获得先发优势,这促进了价值链上的产品组合细分和研发合作。
高昂的认证和再认证成本
完整的ATEX和IECEx认证流程会消耗15%至25%的研发预算,而对于复杂的组件,实验室的等待时间长达6至12个月。小型公司难以融资多次认证申请的费用,因此纷纷透过併购和合资来分担风险。随着标准的不断演变,重新认证的周期性变化会侵蚀毛利率,并导致下游产品价格的调整。
细分市场分析
到2024年,防火存储将占总营收的46%,巩固其在防爆设备市场的核心地位。设计坚固耐用的机壳和良好的服务记录,使其在高功率泵、压缩机和MCC控制柜等领域中广泛应用,尤其是在成熟的油气盆地。然而,本质安全型设计正以7.9%的复合年增长率成长,采用低功耗设计、微型感测器和现场汇流排拓扑结构,运作能量低于点火能量阈值。随着资产管理方不断提升数位化诊断能力,本质安全型设计的普及率将稳定下降,但随着新型感测器节点在危险区域的部署,整个防爆设备市场规模仍将持续成长。
对于大型变频器和PLC套件而言,加压吹扫机柜仍然必不可少;而防爆衬里和隔离模组则适用于电池工厂中特殊的粉尘处理工艺。向能量受限路径的转变标誌着市场正从“遏制”转向“预防”,这体现了全球安全理念,并为长期发展提供了支持。
2024年,1区将占防爆设备市场收入的32%,反映出工业流程在日常运作中普遍产生蒸气。操作员倾向于选择经过认证的照明灯具、电缆固定头和接线盒,以确保维护週期内的连续性。然而,预计年复合成长率为8.5%的0区,由于绿色氢能和深水钻井等持续存在的爆炸性环境需要最高等级的硬件,因此吸引了资本投资的优先考虑。这将导致即使总销量下降,产品组合的盈利也将受到更多关注。
2区计划将产生大量低规格设备,尤其是在食品、饮料和饮品工厂从传统设备过渡到新设备的过程中。随着电池正负极粉尘在多次火灾事故后变得更加明显,21区和22区的粉尘需求将加速成长,迫使原始设备製造商(OEM)在设计时考虑颗粒物威胁,并推动防爆设备在防尘产品市场份额的不断攀升。
防爆设备市场依防护方法(防爆隔离、防爆及其他)、区域(0区、20区、1区及其他)、最终用户(製药、化学、石化及其他)、系统(电力系统、物料输送及其他)及地区进行细分。市场规模和预测以美元计价。
区域分析
2024年,北美将占全球销售额的35%,这主要得益于美国国家电气规范(NEC)第500-516条以及墨西哥湾沿岸石化中心持续进行的检修项目。美国炼油商将继续推动中期维修,而加拿大将为冬季防爆装置配备低温认证外壳。工业物联网(IIoT)的广泛应用和LED维修将推高该地区的平均售价,从而在防爆设备市场中保持强劲的息税前利润率。
亚太地区正以7.6%的复合年增长率成长,锂离子电池超级工厂、陆上化工综合体和海上液化天然气装置的建设推动了防爆设备市场的发展。中国正在其电池园区内设置防尘区,印度为製药和特种化学品行业提供生产关联激励措施,日本正在开发氢能谷,需要客製化的I类气动设备。区域供应商正在快速开发IECEx生产线,缩短前置作业时间并建立区域服务中心。
欧洲市场依然强劲,这得益于德国在ATEX防爆技术和碳中和投资方面的投入,这些投入不仅延长了工厂的使用寿命,也符合欧盟指令2014/34/EU的要求。英国脱欧后政策的延续性推动了ABB在研发和工厂升级方面投入3500万美元,这表明市场对区域能力持乐观态度。中东和非洲依赖待开发区的石化和液化天然气大型企划,而南美洲则凭藉巴西的乙醇和石化走廊项目正蓬勃发展。
其他福利:
- Excel格式的市场预测(ME)表
- 3个月的分析师支持
目录
第一章 引言
- 研究假设和市场定义
- 调查范围
第二章调查方法
第三章执行摘要
第四章 市场情势
- 市场概览
- 市场驱动因素
- 全球ATEX/IECEx法规执行力道加大
- 越来越多的绿色氢能计划需要一级设备
- 相容工业物联网的防爆维修
- 危险照明中的快速LED转换
- 锂离子超级工厂对粉尘区设备的需求
- 太空产业试验设施对防爆系统的需求
- 市场限制
- 高昂的认证和再认证成本
- 分区标准因地区而异
- 耐火材料铸造供应链延误
- 对中国製造的进口商品征收反倾销税
- 价值/供应链分析
- 监管环境
- 技术展望
- 五力分析
- 新进入者的威胁
- 买方的议价能力
- 供应商的议价能力
- 替代品的威胁
- 竞争对手之间的竞争
第五章 市场规模与成长预测
- 透过保护方法
- 爆炸防护(防火)
- 本质安全
- 加压/吹扫
- 防爆措施
- 爆炸分离
- 按区域
- 0区
- 1区
- 2区
- 20区
- 21区
- 22区
- 按最终用户行业划分
- 石油和天然气
- 化工和石油化工产品
- 采矿和金属
- 能源与电力
- 製药
- 食品/饮料加工
- 污水处理
- 氢气生产和燃料电池
- 其他行业
- 按系统
- 电力供应与分配
- 马达和驱动器
- 自动化和控制系统
- 照明系统
- 物料输送设备
- 监测与检测
- 暖气和空调
- 其他系统
- 按地区
- 北美洲
- 美国
- 加拿大
- 墨西哥
- 南美洲
- 巴西
- 阿根廷
- 其他南美洲
- 欧洲
- 德国
- 英国
- 法国
- 俄罗斯
- 其他欧洲地区
- 亚太地区
- 中国
- 日本
- 印度
- 韩国
- 亚太其他地区
- 中东和非洲
- GCC
- 土耳其
- 南非
- 其他中东和非洲地区
- 北美洲
第六章 竞争情势
- 市场集中度
- 策略趋势
- 市占率分析
- 公司简介
- ABB Ltd
- Eaton Corporation plc
- Siemens AG
- Honeywell International Inc.
- R. STAHL AG
- Pepperl+Fuchs GmbH
- Emerson Electric Co.
- Bartec GmbH
- Rockwell Automation Inc.
- Intertek Group plc
- Marechal Electric Group
- Adalet Inc.
- CZ Electric Co. Ltd
- MAM Explosion-proof Technology(Shanghai)Co. Ltd
- GM International SRL
- Alloy Industry Co. Ltd
- Hawke International
- Cooper Crouse-Hinds(Eaton)
- WEG Industries
- Advantech Co. Ltd
第七章 市场机会与未来展望
The explosion proof equipment market is valued at USD 9.96 billion in 2025 and is forecast to reach USD 13.51 billion by 2030, advancing at a 6.29% CAGR.
Expansion is underpinned by the universal enforcement of ATEX and IECEx rules, a quick build-out of green-hydrogen plants, and sustained capital spending on IIoT-ready retrofits that boost predictive maintenance in hazardous areas. Demand also benefits from the mass conversion to LED lighting in offshore and on-shore facilities and the ramp-up of lithium-ion gigafactories across Asia-Pacific, each requiring dust-zone-rated gear . North America preserves scale leadership through OSHA rules and ageing-asset modernization, whereas Asia-Pacific generates the fastest incremental volumes thanks to emerging hydrogen corridors, battery supply chains, and chemical processing clusters. The competitive landscape remains moderately fragmented as ABB, Siemens, and Eaton redeploy balance-sheet strength into local capacity while newcomers fill niche certification gaps. Near-term headwinds include casting shortages and tariffs on Chinese enclosures, which compress margins and encourage multi-sourcing
Global Explosion Proof Equipment Market Trends and Insights
Stricter Global ATEX/IECEx Enforcement
Regulators tightened ATEX guidelines in April 2024, intensifying conformity assessments and escalating testing volumes by 40% year-on-year. Turkey and South Korea mirrored the move through IECEx-aligned statutes, forcing suppliers to upgrade legacy lines that often run for 20 years. Multinationals welcome harmonization because one certificate now unlocks multi-region sales, compressing cycle times and lowering engineering variance. This regulatory rigor accelerates replacement demand across refineries, chemical parks, and LNG export hubs as managers rush to stay audit-ready.
Rising Green-Hydrogen Projects Needing Class I Equipment
Hydrogen's flammability range of 4-75% in air heightens ignition risk, mandating advanced containment, detection, and ventilation systems. Gigawatt-scale electrolyzer farms in China, Australia, and the Gulf are sourcing bespoke flame-proof switchgear and intrinsically safe sensors, creating a dedicated procurement channel inside the explosion proof equipment market. Suppliers with hydrogen-specific certificates secure early-mover margins, prompting portfolio carve-outs and R&D alliances across the value chain.
High Certification & Recertification Cost
End-to-end ATEX and IECEx validation can consume 15-25% of development budgets, while lab queues stretch to 6-12 months for sophisticated assemblies. Smaller firms struggle to finance multiple dossiers, spurring M&A and joint-venture formations as a risk-sharing tactic. As standards evolve, recertification cycles shave gross margins, nudging price adjustments downstream.
Other drivers and restraints analyzed in the detailed report include:
- Mainstream IIoT-Ready Explosion-Proof Retrofits
- Rapid LED Migration in Hazardous Lighting
- Divergent Regional Zoning Standards
For complete list of drivers and restraints, kindly check the Table Of Contents.
Segment Analysis
Flame-proof containment captured 46% of 2024 revenue, confirming its anchor role in the explosion proof equipment market. The design's rugged housings and service record underpin uptake in high-power pumps, compressors, and MCC panels, especially in mature oil & gas basins. However, intrinsic safety, growing 7.9% CAGR, exploits lower-power electronics, micro-sensors, and field-bus topologies that operate below ignition energy thresholds. As asset managers elevate digital diagnostics, intrinsic-safety designs will steadily dilute containment's percentage but enlarge the overall explosion proof equipment market size by funneling new sensor nodes into hazardous areas.
Pressurized and purged cabinets remain essential for large-frame VFDs and PLC suites, while explosion prevention linings and segregation modules serve specialty dust processes in battery plants. The shift towards energy-limiting pathways illustrates the market's pivot from 'contain' to 'prevent,' mirroring global safety philosophies and supporting long-term expansion.
Zone 1 retained 32% of 2024 revenue in the explosion proof equipment market, reflecting widespread industrial processes where vapors appear in routine operation. Operators favour certified luminaires, cable glands, and junction boxes to secure continuity during maintenance cycles. Yet Zone 0, forecast at 8.5% CAGR, garners capex priority within green hydrogen and deep-sea drilling where continuous explosive atmospheres demand the highest-grade hardware. This re-weights product-mix profitability even if total unit counts remain thinner.
Zone 2 projects generate high volumes for lower-spec gear, particularly across food, feed, and beverage plants transitioning from legacy setups. Dust Zones 21 and 22 accelerate as battery cathode and anode powders gain visibility after widely publicized fire events, compelling OEMs to design for fine particulate threats and escalating the explosion proof equipment market share for dust-rated products.
The Explosion Proof Equipment Market Segmented by Method of Protection (Explosion Segregation, Explosion Prevention, and More), by Zone (Zone 0, Zone 20, Zone 1, and More), by End-User (Pharmaceutical, Chemical and Petrochemical, and More), by System (Power Supply System, Material Handling, and More), and by Geography. The Market Size and Forecasts are Provided in Terms of Value (USD).
Geography Analysis
North America controlled 35% revenue in 2024, galvanized by NEC Articles 500-516 and recurring turnaround programs in petrochemical hubs along the Gulf Coast . United States refiners push mid-cycle revamps, while Canada outfits winterized SAGD units with low-temperature certified enclosures. High IIoT uptake plus LED retrofits elevate the regional average selling price, preserving robust EBIT margins within the explosion proof equipment market.
Asia-Pacific advances at 7.6% CAGR, building lithium-ion gigafactories, onshore chemical complexes, and offshore LNG trains that collectively swell the explosion proof equipment market size . China spearheads dust-zone deployments across battery parks, India channels PLI incentives into pharma and specialty chemicals, and Japan scales hydrogen valleys requiring bespoke Class I pneumatics. Regional suppliers fast-track IECEx lines, compressing lead times and embedding local service nodes.
Europe remains steady, anchored by Germany's ATEX expertise and the bloc's carbon-neutrality investments that extend plant life while aligning with Directive 2014/34/EU. The United Kingdom's policy continuity post-Brexit encourages ABB's USD 35 million R&D and factory upgrade, signalling positive sentiment for regional capabilities. Middle East and Africa rely on greenfield petrochemical and LNG megaprojects, whereas South America's momentum clusters around Brazil's ethanol and petrochemical corridor, together extending the global footprint of the explosion proof equipment market.
- ABB Ltd
- Eaton Corporation plc
- Siemens AG
- Honeywell International Inc.
- R. STAHL AG
- Pepperl+Fuchs GmbH
- Emerson Electric Co.
- Bartec GmbH
- Rockwell Automation Inc.
- Intertek Group plc
- Marechal Electric Group
- Adalet Inc.
- CZ Electric Co. Ltd
- MAM Explosion-proof Technology (Shanghai) Co. Ltd
- G.M. International SRL
- Alloy Industry Co. Ltd
- Hawke International
- Cooper Crouse-Hinds (Eaton)
- WEG Industries
- Advantech Co. Ltd
Additional Benefits:
- The market estimate (ME) sheet in Excel format
- 3 months of analyst support
TABLE OF CONTENTS
1 INTRODUCTION
- 1.1 Study Assumptions & Market Definition
- 1.2 Scope of the Study
2 RESEARCH METHODOLOGY
3 EXECUTIVE SUMMARY
4 MARKET LANDSCAPE
- 4.1 Market Overview
- 4.2 Market Drivers
- 4.2.1 Stricter global ATEX/IECEx enforcement
- 4.2.2 Rising green-hydrogen projects needing Class I equipment
- 4.2.3 IIoT-ready explosion-proof retrofits (mainstream)
- 4.2.4 Rapid LED migration in hazardous lighting
- 4.2.5 Lithium-ion gigafactories demand for dust-zone gear (under-radar)
- 4.2.6 Space-industry test stands requiring Ex-rated systems (under-radar)
- 4.3 Market Restraints
- 4.3.1 High certification and recertification cost
- 4.3.2 Divergent regional zoning standards
- 4.3.3 Supply-chain delays for flame-proof castings (under-radar)
- 4.3.4 Anti-dumping tariffs on Chinese Ex enclosures (under-radar)
- 4.4 Value / Supply-Chain Analysis
- 4.5 Regulatory Landscape
- 4.6 Technological Outlook
- 4.7 Porters Five Forces
- 4.7.1 Threat of New Entrants
- 4.7.2 Bargaining Power of Buyers
- 4.7.3 Bargaining Power of Suppliers
- 4.7.4 Threat of Substitutes
- 4.7.5 Competitive Rivalry
5 MARKET SIZE & GROWTH FORECASTS (VALUE)
- 5.1 By Method of Protection
- 5.1.1 Explosion Containment (Flame-proof)
- 5.1.2 Intrinsic Safety
- 5.1.3 Pressurization / Purged
- 5.1.4 Explosion Prevention
- 5.1.5 Explosion Segregation
- 5.2 By Zone
- 5.2.1 Zone 0
- 5.2.2 Zone 1
- 5.2.3 Zone 2
- 5.2.4 Zone 20
- 5.2.5 Zone 21
- 5.2.6 Zone 22
- 5.3 By End-user Industry
- 5.3.1 Oil and Gas
- 5.3.2 Chemicals and Petrochemicals
- 5.3.3 Mining and Metals
- 5.3.4 Energy and Power
- 5.3.5 Pharmaceuticals
- 5.3.6 Food and Beverage Processing
- 5.3.7 Waste-water Treatment
- 5.3.8 Hydrogen Production and Fuel Cells
- 5.3.9 Other Industries
- 5.4 By System
- 5.4.1 Power Supply and Distribution
- 5.4.2 Motors and Drives
- 5.4.3 Automation and Control Systems
- 5.4.4 Lighting Systems
- 5.4.5 Material Handling Equipment
- 5.4.6 Surveillance and Detection
- 5.4.7 Heating and HVAC
- 5.4.8 Other Systems
- 5.5 By Geography
- 5.5.1 North America
- 5.5.1.1 United States
- 5.5.1.2 Canada
- 5.5.1.3 Mexico
- 5.5.2 South America
- 5.5.2.1 Brazil
- 5.5.2.2 Argentina
- 5.5.2.3 Rest of South America
- 5.5.3 Europe
- 5.5.3.1 Germany
- 5.5.3.2 United Kingdom
- 5.5.3.3 France
- 5.5.3.4 Russia
- 5.5.3.5 Rest of Europe
- 5.5.4 Asia Pacific
- 5.5.4.1 China
- 5.5.4.2 Japan
- 5.5.4.3 India
- 5.5.4.4 South Korea
- 5.5.4.5 Rest of Asia Pacific
- 5.5.5 Middle East and Africa
- 5.5.5.1 GCC
- 5.5.5.2 Turkey
- 5.5.5.3 South Africa
- 5.5.5.4 Rest of Middle East and Africa
- 5.5.1 North America
6 COMPETITIVE LANDSCAPE
- 6.1 Market Concentration
- 6.2 Strategic Moves
- 6.3 Market Share Analysis
- 6.4 Company Profiles (includes Global Overview, Market overview, Core Segments, Financials, Strategic Info, Rank/Share, Products & Services, Recent Developments)
- 6.4.1 ABB Ltd
- 6.4.2 Eaton Corporation plc
- 6.4.3 Siemens AG
- 6.4.4 Honeywell International Inc.
- 6.4.5 R. STAHL AG
- 6.4.6 Pepperl+Fuchs GmbH
- 6.4.7 Emerson Electric Co.
- 6.4.8 Bartec GmbH
- 6.4.9 Rockwell Automation Inc.
- 6.4.10 Intertek Group plc
- 6.4.11 Marechal Electric Group
- 6.4.12 Adalet Inc.
- 6.4.13 CZ Electric Co. Ltd
- 6.4.14 MAM Explosion-proof Technology (Shanghai) Co. Ltd
- 6.4.15 G.M. International SRL
- 6.4.16 Alloy Industry Co. Ltd
- 6.4.17 Hawke International
- 6.4.18 Cooper Crouse-Hinds (Eaton)
- 6.4.19 WEG Industries
- 6.4.20 Advantech Co. Ltd
7 MARKET OPPORTUNITIES AND FUTURE OUTLOOK
- 7.1 White-space and Unmet Needs Assessment
 防爆加湿器市场按类型、湿度输出、应用、最终用户和分销管道划分,全球预测(2026-2032)
 防爆设备市场分析及预测(至2035年):依类型、产品类型、服务、技术、组件、应用、材质、设备、最终用户、安装类型划分
 2026-2034年按防护方法、应用系统、产业及地区分類的防爆设备市场规模、份额、趋势及预测
 2026年全球防爆电梯市场报告
 防爆设备市场规模、份额及成长分析(依产品、区域分类、连结系列、产业及地区划分)-2026-2033年产业预测防爆设备市场:依产品类型、区域类型、防护方式、连接方式、安装环境、最终用户产业和销售管道划分-2025-2032年全球预测
 防爆:全球市占率及排名、总收入及需求预测(2025-2031年)
 全球防爆液压阀市场(按阀门类型、工作压力、最终用途行业和地区划分)- 预测至 2030 年2025年全球绝缘和防尘系统市场报告
 防爆设备市场-全球产业规模、份额、趋势、机会和预测,按保护方法、按系统、按应用、按地区和竞争细分,2020-2030 年