


 |
市场调查报告书
商品编码
1849877
稀土元素:市场占有率分析、产业趋势、统计数据和成长预测(2025-2030 年)Rare Earth Elements - Market Share Analysis, Industry Trends & Statistics, Growth Forecasts (2025 - 2030) |
||||||
※ 本网页内容可能与最新版本有所差异。详细情况请与我们联繫。
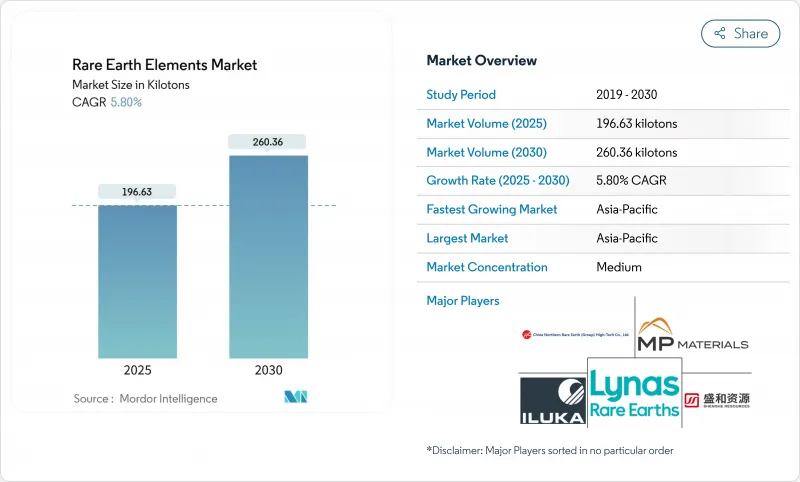
2025 年稀土元素市场价值为 196.63 千吨,预计到 2030 年将达到 260.36 千吨,预测期内复合年增长率为 5.80%。
清洁能源技术、消费性电子产品和国防平台的强劲需求将继续推动钕铁硼磁铁的生产,而电动车的快速普及如果没有新的产能和大规模回收利用,到2036年,其产量可能会超过目前的钕铁硼磁铁产量。由于中国的主导地位,亚太地区仍然是钕铁硼磁体的生产和加工中心,但来自美国、加拿大和欧盟的政策支持正在开闢投资管道,从而降低市场集中风险。高性能钕铁硼磁铁是电动车牵引马达和直驱风力发电机的关键元件,因此磁体应用领域将迎来最强劲的成长,预计复合年增长率将达到8.02%。日益加剧的地缘政治摩擦正促使西方国家政府补贴国内计划。光是美国国防部自2020年以来就已拨款超过4.39亿美元用于加强其供应链。
全球稀土元素市场趋势及洞察
新兴国家需求旺盛
随着各国政府加快工业化进程和可再生能源部署,新兴市场消费量正在成长。儘管国内消费放缓,中国仍计划在2024年增加出口,掩盖了长期供应限制。印度透过印度稀土有限公司计划在2032年将其精炼产量提高两倍,从而降低进口依赖,增强区域自主能力。非洲国家的目标是2029年提供全球9%的稀土供应,新增低成本产能将有助于缓解物价上涨。这些供应侧倡议与该地区电动车、电子产品和风力发电机组装厂不断增长的需求相辅相成。其结果是降低了国家集中度,但下游用户面临更高的整合门槛。
绿色科技对稀土元素的依赖
风力发电机、电动车牵引马达和节能照明设备都需要大量的钕、镨、镝和铽。欧盟委员会预测,到2030年和2050年,这些稀土元素的需求量将分别成长4.5倍和5.5倍。离岸风力发电机每台都使用数公斤的钕磁铁,在低转速下即可产生高扭力。在微软气候创新基金的投资下, 封闭式 Materials公司开发了一种工艺,可以从废弃硬碟中回收高达85%的稀土元素。这项闭环製程的成功商业化将降低原物料风险,并从长远来看,有助于中国更好地控制稀土供应。
分离设施和放射性废弃物管理的高资本投入
建造独立的氧化物分离纯化设施需要专门的溶剂萃取迴路和用于处理含钍铀残渣的密封系统。这些要求会使营运成本增加15-20%,阻碍了中国以外的先行者。广州的一个研究团队已展示了一种电动力采矿技术,其回收率高达95%,氨排放减少了95%,为符合西方更严格的环境法规提供了一条可行的途径。然而,对于中国以外的营运商而言,筹集足够的资金并降低该技术商业化应用的风险是目前面临的直接挑战。
细分市场分析
由于轻稀土稀土元素相对丰富且开采成本低廉,预计到2024年将占全球稀土总量的80%。受磨料粉末、FCC催化剂和钕铁硼磁体原料等需求的推动,预计到2030年,轻稀土元素市场规模将以5.98%的复合年增长率成长。欧洲和北美的回收利用计画正逐步将废弃物分流,生产出可抑制原生矿开采成长的再生材料。重稀土元素,例如镝、铽和钇,虽然单位价值高,但地质储量稀少。正在进行的电动力浸出初步试验表明,该方法回收率高达95%,能源消耗降低60%,预计将缩小不同类型产品之间的生产成本差距,并重塑长期供应经济格局。
电动车需求、风电部署和国防采购等次要因素持续为两种稀土矿的价格提供强劲讯号。然而,计划资金筹措更倾向于轻稀土元素矿床,因为轻稀土矿床更容易冶金,且投产週期更短。预计重稀土的生产将主要受高温磁铁、雷射晶体和磷光体特殊用途需求的驱动,从而维持稀土市场收入结构的平衡。
到2024年,铈将占据40%的市场份额,这主要得益于其在玻璃抛光粉和汽车催化剂的应用。高等经济大学(HSE University)的实验产生了可调谐的黄色发光,为照明和显示领域的应用开闢了道路,并有望扩大铈的潜在市场。钕将以9.20%的复合年增长率实现最快成长,因为电动车牵引马达和涡轮发电机需要消耗大量的磁性合金。 MP Materials公司于2025年1月在其位于德克萨斯的工厂开始商业化生产钕镨(NdPr),这是重建美国从矿山到磁性材料供应链的关键里程碑。
铽和镝因其在离岸风力发电和国防装备领域对高矫顽力磁体的需求稳定,但冶金製程的复杂性限制了其产量。钪正日益受到关注,卢萨尔公司预计将于2025年开始生产氧化钪,这将降低航太级铝钪合金的原料成本,并加速其在民航机的应用。整体而言,多种元素的融合支撑着稀土元素市场稳健的利润结构。
区域分析
亚太地区依託中国集采矿、分离及磁体製造于一体的综合体系,预计2024年将占全球总产量的86%。受电动车和家用电子电器产能持续扩张的推动,该地区预计到2030年将以5.92%的复合年增长率成长。日本和韩国计画在2025年前深化电池和磁铁供应链共用资料平台的合作,以增强供应链的韧性。
北美是关键区域,拥有旨在加速新矿、炼油厂和磁选厂建设进度的政策奖励。自2020年以来,美国国防部已投入超过4.39亿美元用于加强国内能力建设,其中MP Materials公司的Mountain Pass综合设施为德克萨斯州的下游业务提供原材料。加拿大的「关键矿产蓝图」透过资助勘探和试点分离中心,并建立一体化的北美大陆价值链,与美国的目标相辅相成。
《欧洲关键材料法案》设定了2030年开采、加工和回收的量化目标,鼓励投资挪威、瑞典和法国的矿床以及英国的回收业务。然而,授权障碍和当地民众的反对仍然阻碍待开发区的核准。随着布隆迪、坦尚尼亚和南非计划的推进,非洲的贡献正在不断增长。 2029年,非洲大陆预计将满足全球9%的需求,从而实现贸易流向多元化并降低单一供应商风险。
其他福利:
- Excel格式的市场预测(ME)表
- 3个月的分析师支持
目录
第一章 引言
- 研究假设和市场定义
- 调查范围
第二章调查方法
第三章执行摘要
第四章 市场情势
- 市场概览
- 市场驱动因素
- 新兴国家需求旺盛
- 「绿色技术」对稀土元素的依赖
- 永磁电动汽车马达在亚洲正迅速普及。
- 航太製造中的钪铝合金
- 家用电器需求旺盛
- 市场限制
- 分离设施和放射性废弃物管理方面的高额资本投入成本
- 中国政策变动引发的价格波动
- 稀土元素供应不稳定
- 价值链分析
- 波特五力模型
- 供应商的议价能力
- 消费者议价能力
- 新进入者的威胁
- 替代品的威胁
- 竞争程度
第五章 市场规模与成长预测
- 依产品类型
- 轻稀土元素
- 重稀土元素
- 按元素
- 铈
- 氧化物
- 硫化物
- 其他化合物
- 钕
- 合金
- 镧
- 合金
- 氧化物
- 其他化合物
- 鎝
- 铽
- 钇
- 钪
- 其他元素
- 铈
- 透过使用
- 催化剂
- 陶瓷
- 磷光体
- 玻璃和抛光
- 冶金
- 磁铁
- 其他用途
- 按最终用途行业划分
- 清洁能源
- 家用电器
- 航太与国防
- 工业自动化
- 卫生保健
- 其他的
- 按地区
- 亚太地区
- 中国
- 印度
- 日本
- 韩国
- 澳洲
- 亚太其他地区
- 北美洲
- 美国
- 加拿大
- 墨西哥
- 欧洲
- 德国
- 英国
- 法国
- 义大利
- 北欧国家
- 其他欧洲地区
- 南美洲
- 巴西
- 阿根廷
- 其他南美洲
- 中东和非洲
- 沙乌地阿拉伯
- 阿拉伯聯合大公国
- 南非
- 其他中东和非洲地区
- 亚太地区
第六章 竞争情势
- 市场集中度
- 策略趋势
- 市占率分析
- 公司简介
- Appia REU
- China Rare Earth Group Resources Technology Co., Ltd.
- China Rare Earth Holdings Limited
- ChinaTungsten
- Energy Fuels Inc.
- Iluka Resources Limited
- Jiangxi Copper Corporation
- Lynas Rare Earths Ltd
- Mitsubishi Corporation RtM Japan Ltd.
- MP Materials
- Northern Minerals
- Northern Rare Earth
- Rio Tinto
- Shenghe Resources Holding Co., Ltd.
- Ucore Rare Metals Inc.
- Yuyan Rare Earth New Materials Co., Ltd.
第七章 市场机会与未来展望
The rare earth metals market stood at 196.63 kilotons in 2025 and is projected to reach 260.36 kilotons by 2030, expanding at a 5.80% CAGR over the forecast period.
Robust demand from clean-energy technologies, consumer devices, and defense platforms continues to lift volumes, while the rapid scale-up of electric vehicles (EVs) threatens to outstrip current neodymium and praseodymium production by 2036 if new capacity or large-scale recycling fails to materialize. Asia-Pacific remains the production and processing hub, anchored by China's dominant position, yet policy support in the United States, Canada, and the European Union is opening investment pathways that could reduce concentration risk. Magnet applications post the strongest growth because high-performance NdFeB magnets are indispensable in EV traction motors and direct-drive wind turbines, giving this segment an 8.02% forecast CAGR. Mounting geopolitical friction is prompting Western governments to subsidize domestic projects; the U.S. Department of Defense alone has committed more than USD 439 million since 2020 to shore up supply chains.
Global Rare Earth Elements Market Trends and Insights
High Demand from Emerging Economies
Emerging markets are lifting consumption as governments accelerate industrialization and renewable-energy deployment. China increased export volumes in 2024 despite slower domestic use, masking tightening long-term supply. India intends to triple refined output by 2032 through Indian Rare Earths Limited, lowering import dependency and bolstering regional self-reliance. African nations collectively aim to deliver 9% of global supply by 2029, adding new low-cost tonnage that could temper price spikes. These supply-side moves are coupled with demand growth from regional EV, electronics, and wind-turbine assembly plants. The resulting realignment lessens single-country concentration yet raises integration hurdles for downstream users.
Dependency of Green Technology on Rare Earth Elements
Wind turbines, EV traction motors, and energy-efficient lighting require large volumes of neodymium, praseodymium, dysprosium, and terbium. The European Commission projects demand to rise 4.5 to 5.5 times by 2030 and 2050, respectively. Each offshore wind turbine contains kilograms of NdFeB magnets that deliver high torque at low rotational speeds. Recycling breakthroughs are gaining traction; Cyclic Materials attracted investment from Microsoft's Climate Innovation Fund to scale a process that recovers up to 85% of rare earths from discarded hard drives. Successful commercialization of closed-loop flows will cushion raw-material risk and loosen China's grip on supply over the long term.
High Capex & Radioactive Waste-Management Costs for Separation Facilities
Building a standalone separation and oxide refinery demands specialized solvent-extraction circuits and containment systems for thorium- and uranium-bearing residues. These requirements raise operating costs by 15-20%, deterring first-movers outside China. Research groups in Guangzhou demonstrated an electrokinetic mining technique that delivers 95% recovery and cuts ammonia emissions by 95%, offering a viable pathway to comply with stricter Western environmental rules. Mobilizing sufficient funding and de-risking the technology at commercial scale remain near-term hurdles for non-Chinese operators.
Other drivers and restraints analyzed in the detailed report include:
- Rapid Penetration of Permanent-Magnet EV Motors across Asia
- Scandium-Aluminum Alloys Adoption in Aerospace Manufacturing
- Price Volatility Linked to Chinese Policy Shifts
For complete list of drivers and restraints, kindly check the Table Of Contents.
Segment Analysis
Light rare earths, supplied 80% of global tonnage in 2024 because of their relative abundance and lower mining costs. The rare earth metals market size for light REEs is projected to expand at 5.98% CAGR to 2030, driven by polishing powders, FCC catalysts, and NdFeB magnet feedstock. Recycling programs in Europe and North America are beginning to divert waste streams, creating secondary feed that mildly tempers virgin-ore growth. Heavy rare earths such as dysprosium, terbium, and yttrium deliver higher unit value but face geological scarcity. Ongoing pilot trials in electrokinetic leaching show 95% recovery with 60% lower power use, potentially narrowing production-cost gaps between product types and reshaping long-term supply economics.
Second-order effects from EV demand, wind-energy roll-outs, and defense procurement maintain strong price signals for both classes. Yet project financing remains skewed toward light REE deposits because of easier metallurgy and shorter ramp-up timelines. Heavy-REE output is expected to track specialty demand in high-temperature magnets, laser crystals, and phosphors, supporting a balanced revenue mix across the rare earth metals market.
Cerium controlled a 40% share in 2024 on the back of glass-polishing powders and autocatalyst use. Experimentation at HSE University produced tunable yellow luminescence, opening potential lighting and display applications that could broaden cerium's addressable market. Neodymium registers the fastest growth at 9.20% CAGR as EV traction motors and turbo-generators soak up magnet alloy feed. MP Materials began commercial NdPr metal pours at its Texas facility in January 2025, an essential milestone in rebuilding the United States' mine-to-magnet supply chain.
Terbium and dysprosium enjoy stable demand in high-coercivity magnets for offshore wind and defense gear, yet output is constrained by metallurgical complexity. Scandium's profile is rising; Rusal expects to initiate scandium oxide production in 2025, lowering the input cost of aerospace-grade Al-Sc alloys and accelerating adoption in commercial aircraft. Altogether, diversified element uptake underpins a resilient revenue structure for the rare earth metals market.
The Rare Earth Metals Market Report Segments the Industry by Product Type (Light Rare Earth Elements and Heavy Rare Earth Elements), Element (Cerium, Neodymium, and More), Application (Catalysts, Ceramics, and More), End-Use Industry (Clean Energy, Consumer Electronics, and More), and Geography (Asia-Pacific, North America, Europe, South America, Middle East and Africa). The Market Forecasts are Provided in Terms of Volume (tons).
Geography Analysis
Asia-Pacific produced 86% of global output in 2024, anchored by China's integrated mining, separation, and magnet manufacturing complex. The region is forecast to grow at 5.92% CAGR to 2030 on relentless EV and consumer-electronics capacity expansions. Japan and South Korea deepen collaboration on shared data platforms for battery and magnet supply chains to increase resilience by 2025.
North America is the significant region as policy incentives compress timelines for new mines, refineries, and magnet plants. The U.S. Department of Defense has dispersed more than USD 439 million since 2020 to strengthen domestic capabilities, and MP Materials' Mountain Pass complex feeds downstream operations in Texas. Canada's critical-minerals roadmap complements U.S. goals by funding exploration and pilot separation hubs, creating an integrated continental value chain.
Europe's Critical Raw Materials Act sets quantitative targets for mining, processing, and recycling by 2030, catalyzing investment in Norwegian, Swedish, and French deposits alongside UK-based recycling ventures. However, greenfield mine approvals remain slow because of permitting hurdles and local opposition. Africa's contribution grows as projects in Burundi, Tanzania, and South Africa progress; the continent could supply 9% of global demand by 2029, diversifying trade flows and reducing single-supplier risk.
- Appia REU
- China Rare Earth Group Resources Technology Co., Ltd.
- China Rare Earth Holdings Limited
- ChinaTungsten
- Energy Fuels Inc.
- Iluka Resources Limited
- Jiangxi Copper Corporation
- Lynas Rare Earths Ltd
- Mitsubishi Corporation RtM Japan Ltd.
- MP Materials
- Northern Minerals
- Northern Rare Earth
- Rio Tinto
- Shenghe Resources Holding Co., Ltd.
- Ucore Rare Metals Inc.
- Yuyan Rare Earth New Materials Co., Ltd.
Additional Benefits:
- The market estimate (ME) sheet in Excel format
- 3 months of analyst support
TABLE OF CONTENTS
1 Introduction
- 1.1 Study Assumptions and Market Definition
- 1.2 Scope of the Study
2 Research Methodology
3 Executive Summary
4 Market Landscape
- 4.1 Market Overview
- 4.2 Market Drivers
- 4.2.1 High Demand from Emerging Economies
- 4.2.2 Dependency of 'Green Technology' on Rare Earth Elements
- 4.2.3 Rapid Penetration of Permanent-Magnet EV Motors across Asia
- 4.2.4 Scandium-Aluminum Alloys Adoption in Aerospace Manufacturing
- 4.2.5 High Demand in Consumer Electronics
- 4.3 Market Restraints
- 4.3.1 High Capex and Radioactive Waste Management Costs for Separation Facilities
- 4.3.2 Price Volatility Linked to Chinese Policy Shifts
- 4.3.3 Inconsistent Supply of Rare Earth Elements
- 4.4 Value Chain Analysis
- 4.5 Porter's Five Forces
- 4.5.1 Bargaining Power of Suppliers
- 4.5.2 Bargaining Power of Consumers
- 4.5.3 Threat of New Entrants
- 4.5.4 Threat of Substitutes
- 4.5.5 Degree of Competition
5 Market Size and Growth Forecasts (Volume)
- 5.1 By Product Type
- 5.1.1 Light Rare Earth Elements
- 5.1.2 Heavy Rare Earth Elements
- 5.2 By Element
- 5.2.1 Cerium
- 5.2.1.1 Oxide
- 5.2.1.2 Sulfide
- 5.2.1.3 Other Compounds
- 5.2.2 Neodymium
- 5.2.2.1 Alloy
- 5.2.3 Lanthanum
- 5.2.3.1 Alloy
- 5.2.3.2 Oxide
- 5.2.3.3 Other Compounds
- 5.2.4 Dysprosium
- 5.2.5 Terbium
- 5.2.6 Yttrium
- 5.2.7 Scandium
- 5.2.8 Other Elements
- 5.2.1 Cerium
- 5.3 By Application
- 5.3.1 Catalysts
- 5.3.2 Ceramics
- 5.3.3 Phosphors
- 5.3.4 Glass and Polishing
- 5.3.5 Metallurgy
- 5.3.6 Magnets
- 5.3.7 Other Applications
- 5.4 By End-use Industry
- 5.4.1 Clean Energy
- 5.4.2 Consumer Electronics
- 5.4.3 Aerospace and Defense
- 5.4.4 Industrial Automation
- 5.4.5 Healthcare
- 5.4.6 Others
- 5.5 By Geography
- 5.5.1 Asia-Pacific
- 5.5.1.1 China
- 5.5.1.2 India
- 5.5.1.3 Japan
- 5.5.1.4 South Korea
- 5.5.1.5 Australia
- 5.5.1.6 Rest of Asia-Pacific
- 5.5.2 North America
- 5.5.2.1 United States
- 5.5.2.2 Canada
- 5.5.2.3 Mexico
- 5.5.3 Europe
- 5.5.3.1 Germany
- 5.5.3.2 United Kingdom
- 5.5.3.3 France
- 5.5.3.4 Italy
- 5.5.3.5 Nordics
- 5.5.3.6 Rest of Europe
- 5.5.4 South America
- 5.5.4.1 Brazil
- 5.5.4.2 Argentina
- 5.5.4.3 Rest of South America
- 5.5.5 Middle East and Africa
- 5.5.5.1 Saudi Arabia
- 5.5.5.2 United Arab Emirates
- 5.5.5.3 South Africa
- 5.5.5.4 Rest of Middle East and Africa
- 5.5.1 Asia-Pacific
6 Competitive Landscape
- 6.1 Market Concentration
- 6.2 Strategic Moves
- 6.3 Market Share Analysis
- 6.4 Company Profiles (includes Global level Overview, Market level overview, Core Segments, Financials as available, Strategic Information, Market Rank/Share for key companies, Products and Services, and Recent Developments)
- 6.4.1 Appia REU
- 6.4.2 China Rare Earth Group Resources Technology Co., Ltd.
- 6.4.3 China Rare Earth Holdings Limited
- 6.4.4 ChinaTungsten
- 6.4.5 Energy Fuels Inc.
- 6.4.6 Iluka Resources Limited
- 6.4.7 Jiangxi Copper Corporation
- 6.4.8 Lynas Rare Earths Ltd
- 6.4.9 Mitsubishi Corporation RtM Japan Ltd.
- 6.4.10 MP Materials
- 6.4.11 Northern Minerals
- 6.4.12 Northern Rare Earth
- 6.4.13 Rio Tinto
- 6.4.14 Shenghe Resources Holding Co., Ltd.
- 6.4.15 Ucore Rare Metals Inc.
- 6.4.16 Yuyan Rare Earth New Materials Co., Ltd.
7 Market Opportunities and Future Outlook
- 7.1 White-space and Unmet-need Assessment
 稀土 (REE) 回收市场预测(至 2032 年):按来源、元素类型、技术、应用和地区分類的全球分析
 高科技产业稀土:中国贸易禁令下的市场分析与预测
 稀土元素市场按元素类型、产品类型、形态、分离技术、来源、加工阶段、纯度等级、应用和最终用途产业划分-2025-2030 年全球预测钇箔市场(按产品类型、厚度、形状、纯度、最终用途产业和分销管道)—2025-2030 年全球预测铒箔市场(按厚度、纯度、应用和销售管道)——2025-2030 年全球预测镏箔市场按产品类型、形状、纯度等级、厚度、製造技术、应用和最终用途产业划分-2025-2030 年全球预测
 稀土元素市场-全球产业规模、份额、趋势、机会及预测(细分、按类型、按应用、按地区、按竞争,2020-2030 年预测)
 2025年稀土元素全球市场报告
 稀土产业趋势:中国对美国及2025年的全球展望钇金属市场-全球产业规模、份额、趋势、机会及预测(按销售管道、最终用途、地区和竞争细分,2020-2030 年)