


 |
市场调查报告书
商品编码
1849893
行动 3D - 市场占有率分析、产业趋势、统计数据、成长预测(2025-2030 年)Mobile 3D - Market Share Analysis, Industry Trends & Statistics, Growth Forecasts (2025 - 2030) |
||||||
※ 本网页内容可能与最新版本有所差异。详细情况请与我们联繫。
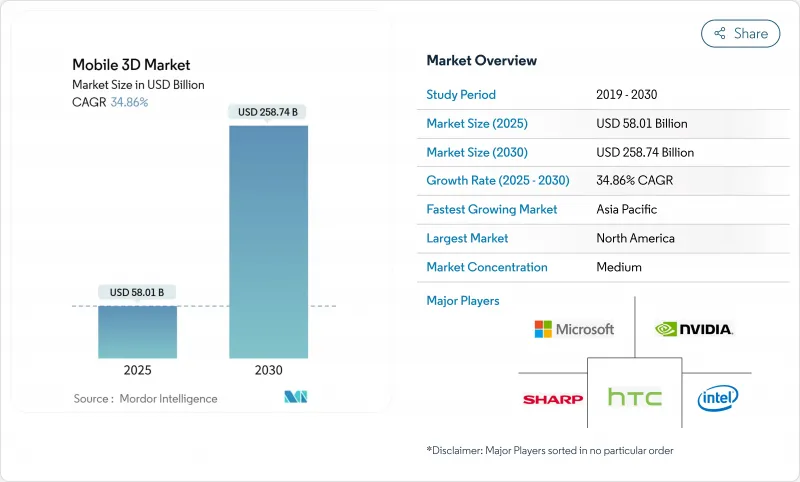
预计2025年移动3D市场规模将达580.1亿美元,2030年将达2,587.4亿美元,复合年增长率为34.86%。
强劲成长反映了边缘人工智慧处理与先进深度感知模组的结合,将日常行动装置转变为空间运算工具。 OLED 微型显示器成本的下降正在扩大智慧型手机、折迭式和穿戴式装置对高解析度空间内容的存取。飞行时间(ToF) 感测器为移动成像提供动力,而光场处理器则以 30 fps 的速度达到 4K 全像影像质量,预示着下一波深度捕捉创新浪潮的到来。企业生产力的提高、扩增实境游戏的普及以及 5G 网路的推出进一步推动了用户需求。围绕 VCSEL 发射器和 SPAD 感测器的供应链重组正在重塑零件製造商之间的议价能力,而温度控管和电池续航力仍然是设计限制因素。
全球行动 3D 市场趋势与洞察
3D感测相机模组(ToF/结构光)快速普及
飞行时间和结构化光源阵列支援人像影像和扩增实境(AR) 迭加的精确深度捕捉。三星的 ISOCELL Vizion 3D 提高了测距精度,而苹果的 iPhone 15 Pro 的空间视讯功能则证实了消费者对原生 3D 捕捉的需求。 Meta 的间接 ToF 专利在紧凑的外形规格下改善了运动模糊缓解、电源效率和响应速度。工业领域受益于支援机器人和自动化的物件测量精度。
行动 AR 游戏和社群媒体滤镜的激增
Instagram 上流行的 AR 游戏和人脸滤镜正在推动 3D 功能的习惯性使用。一项针对 42,000 个 Instagram 特效的学术研究发现,美颜滤镜占上传内容的 20%,这表明对即时脸部增强的需求。爱立信报告称,5G用户的稳定频宽正在推动 AR 应用的显着成长。高通的装置稳定扩散技术可在 15 秒内产生逼真的场景,并将创作工具交付给数百万台装置。这些进展降低了用户生成 3D 内容的门槛,并扩大了社群平台的网路效应。
3D硬体和内容创作高成本
Vision Pro 的製造成本高达 1,519 美元,这暴露了微型 OLED 和感测器组装的高昂成本。此外,它还为内容团队带来了陡峭的学习曲线,限制了其在小型工作室的推广。然而,Howden 报告称,儘管前期投资较大,但其客製化 AR 工作流程仍显着节省了维护成本。虽然随着组件规模的扩大,价格正在下降,但主流用户的可负担性仍然是一个中期挑战,尤其是在功能手机日益被取代的新兴市场。
細項分析
到2024年,智慧型手机将占据行动3D市场的72%,这反映了其主导的装置量和年度硬体更新周期。旗舰设备目前配备了ToF阵列、AI加速器和OLED显示屏,构成了空间运算蓝图的基准。三星Galaxy S25系列就体现了这一点,它以AI驱动的ProVisual Imaging技术将日常照片转换为深度映射的3D素材。可折迭设备引入了分层介面,加深了使用者的沉浸感,而平板电脑和笔记型电脑则将3D协作扩展到更大的空间。
AR/VR眼镜产品虽然目前市场规模较小,但却是成长最快的领域,复合年增长率高达 36.10%。 Meta 的 Reality Labs 儘管营运亏损 44 亿美元,但累计了创纪录的收益,凸显了消费者的潜在接受度。 Google和三星将于 2026 年推出 Android XR 眼镜,彰显其在平台层面的投入。这些设备将弥合娱乐和企业之间的差距,从身临其境型游戏到现场维护覆盖范围。随着市场规模的扩大,预计在预测期内,穿戴式行动 3D 市场规模将缩小与智慧型手机的差距。
到2024年,3D影像感测器将占行动3D市场规模的46.30%,成为智慧型手机、平板电脑和头戴式耳机深度捕捉的支柱。SONY在泰国的扩张将确保汽车光达和移动飞行时间(ToF)模组的二极体产能,缓解短期瓶颈。 VCSEL发送器的供应仍然受限,促使OEM尽可能采用双源采购。
OLED 微型显示器发展势头强劲,年增长率高达 35%。随着 LG Display 和中国参与企业纷纷增加沉积生产线并缩短前置作业时间,其成本曲线正在向下弯曲。显示器创新也推动了对专用 3D GPU 和 ISP 的需求,这些 GPU 和 ISP 能够处理高像素密度,且不会出现指数级延迟。组件成本的下降推动了应用的普及,进而为进一步的製程改进提供资金,从而推动了市场区隔蓬勃发展的创新週期。
行动 3D 市场报告按支援 3D 的行动装置(智慧型手机、平板电脑等)、装置组件(3D 影像感测器、3D GPU/ISP 等)、3D 技术(ToF(飞行时间)、结构光等)、3D 应用程式(行动游戏、地图和导航、动画和 3D 内容创建等)和地区进行细分。
区域分析
受商业投资和高额可支配收入的推动,到2024年,北美将占据40%的行动3D市场份额,占据领先地位。 Meta的累积AR/VR支出超过1000亿美元,加速了该地区的研发动能。工业公司报告称,AR工作流程提高了生产力,消费者也乐于接受配备尖端3D功能的高阶智慧型手机。
亚太地区是成长的领跑者,到2030年复合年增长率将达到41.02%。受机器人需求的推动,中国3D工业相机销售额将在2024年达到23.62亿元人民币(约3.34亿美元)。该地区行动端增加价值对GDP的贡献高达8,800亿美元,使其成为供应中心和需求中心。韩国和日本的企业正在推进显示器和全像处理器的研究,而越南和印度的委託製造将吸收新的AR穿戴式装置组装订单。
在汽车和航太工业的工业 4.0计划的推动下,欧洲的采用率将稳步提升。相关法规支援安全资料处理,并鼓励企业尝试边缘 AI 3D 工具。中东/非洲和拉丁美洲仍处于起步阶段,但随着 5G 的普及和都市化进程的加快,硬体成本将降低,采用率可能会加速。
其他福利:
- Excel 格式的市场预测 (ME) 表
- 3个月的分析师支持
目录
第一章 引言
- 研究假设和市场定义
- 调查范围
第二章调查方法
第三章执行摘要
第四章 市场状况
- 市场概况
- 市场驱动因素
- 智慧型手机普及率上升和向 5G 升级
- 3D感测相机模组(ToF/结构光)快速普及
- 行动 AR 游戏和社群媒体滤镜的激增
- 降低成本的OLED微型显示器可实现空间内容
- 边缘人工智慧 (Edge-AI) 离线 AR 设备上 3D 重建
- 折迭式和双萤幕外形推动分层 3D UI
- 市场限制
- 3D硬体和内容创作高成本
- 密集 3D 处理期间的电池消耗和热限制
- VCSEL供应链瓶颈限制感测器输出
- 缺乏开放、跨平台的 3D 檔案标准
- 价值链分析
- 监管格局
- 技术展望
- 波特五力分析
- 供应商的议价能力
- 买家/消费者的议价能力
- 新进入者的威胁
- 替代品的威胁
- 竞争对手之间的竞争
第五章市场规模及成长预测
- 支援 3D 的行动设备
- 智慧型手机
- 折迭式和双行动电话
- 药片
- 笔记本
- AR/VR眼镜产品和头戴式显示器
- 其他支援 3D 的设备
- 按设备组件
- 3D影像感测器(ToF、结构光)
- 3D显示器和OLED微型显示器
- 深度感测模组和VCSEL
- 3D GPU/ISP
- 软体 SDK 和中介软体
- 3D技术
- 飞行时间(ToF)
- 结构光
- 立体视觉
- 光场/全像
- 其他新兴技术
- 3D应用
- 手机游戏
- 地图和导航
- 动画和 3D 内容创作
- 广告和社群媒体过滤器
- 工业和企业 AR
- 其他用途
- 按地区
- 北美洲
- 美国
- 加拿大
- 墨西哥
- 南美洲
- 巴西
- 阿根廷
- 南美洲其他地区
- 欧洲
- 英国
- 德国
- 法国
- 义大利
- 俄罗斯
- 其他欧洲地区
- 亚太地区
- 中国
- 印度
- 日本
- 韩国
- ASEAN
- 其他亚太地区
- 中东和非洲
- 中东
- 沙乌地阿拉伯
- 阿拉伯聯合大公国
- 土耳其
- 其他中东地区
- 非洲
- 南非
- 奈及利亚
- 其他非洲国家
- 北美洲
第六章 竞争态势
- 市场集中度
- 策略趋势
- 市占率分析
- 公司简介{包括全球概况、市场层级、核心细分市场、可用财务资讯、策略资讯、主要企业的市场排名/份额、产品和服务、最新发展等}
- Apple Inc.
- Samsung Electronics Co. Ltd.
- Qualcomm Inc.
- LG Electronics Inc.
- Sony Corporation
- Google LLC
- Huawei Technologies Co. Ltd.
- Intel Corporation
- Nvidia Corporation
- AMS OSRAM AG
- Infineon Technologies AG
- STMicroelectronics NV
- pmdtechnologies ag
- MediaTek Inc.
- Xreal Technology(Formerly Nreal)
- Meta Platforms Inc.
- Xiaomi Corporation
- Oppo Mobile Telecommunications Corp.
- Vivo Communication Technology Co.
- Lenovo Group Limited
- Sharp Corporation
- HTC Corporation
- Hitachi Ltd.
- The 3M Company
第七章 市场机会与未来展望
The Mobile 3D market generated USD 58.01 billion in 2025 and is forecast to reach USD 258.74 billion by 2030, advancing at a 34.86% CAGR.
Robust growth reflects the pairing of edge-AI processing with advanced depth-sensing modules that turn everyday handsets into spatial-computing tools. Declining OLED micro-display costs widen access to high-resolution spatial content across smartphones, foldables, and wearables. Time-of-Flight (ToF) sensors strengthen mobile imaging while Light-Field processors reach 4K hologram quality at 30 fps, signaling the next wave of depth-capture innovation. Enterprise productivity gains, AR gaming uptake, and 5G network rollouts further elevate user demand. Supply-chain reshuffles around VCSEL emitters and SPAD sensors reshape bargaining power among component makers, while thermal management and battery endurance remain design constraints.
Global Mobile 3D Market Trends and Insights
Rapid Adoption of 3D Sensing Camera Modules (ToF / Structured-Light)
Time-of-Flight and structured-light arrays now underpin precise depth capture for portrait imaging and augmented-reality overlays. Sony expanded its Thai laser-diode plant in 2024 to meet surging demand, adding 2,000 jobs to scale VCSEL output.Samsung's ISOCELL Vizion 33D boosts range accuracy, and Apple's spatial-video feature on iPhone 15 Pro underlines consumer appetite for native 3D capture. Meta's indirect-ToF patent improves motion-blur mitigation and power efficiency, enhancing responsiveness in compact form factors. Industrial sectors gain from object measurement precision that supports robotics and automation.
Surge in Mobile AR Gaming and Social-Media Filters
AR games and face filters popularized by Instagram drive habitual use of 3D features. Academic review of 42,000 Instagram effects found beautification filters represented 20% of uploads, illustrating demand for real-time facial augmentation. Ericsson reports that 5G subscribers show materially higher AR engagement due to stable bandwidth. Qualcomm's on-device Stable Diffusion generates photorealistic scenes under 15 seconds, opening creator tools to millions of handsets. These developments lower barriers for user-generated 3D content and amplify network effects across social platforms.
High Cost of 3D Hardware and Content Creation
Vision Pro's manufacturing cost of USD 1,519 exposes the premium burden of micro-OLED and sensor assemblies. Content teams also face steep learning curves, limiting smaller studios. Howden nonetheless reports measurable maintenance savings from custom AR workflows despite upfront spend. Component scale-up is pushing prices lower, yet mainstream affordability remains a mid-term challenge, especially in emerging markets where feature-phone transitions still play out.
Other drivers and restraints analyzed in the detailed report include:
- Edge-AI on-Device 3D Reconstruction for Offline AR
- Cost Decline of OLED Micro-Displays Enabling Spatial Content
- Battery Drain and Thermal Limits in Intensive 3D Processing
For complete list of drivers and restraints, kindly check the Table Of Contents.
Segment Analysis
Smartphones captured 72% of the Mobile 3D market in 2024, reflecting the installed base advantage and annual hardware refresh cycles. Flagship handsets now bundle ToF arrays, AI accelerators, and OLED displays, forming the baseline for spatial computing roadmaps. Samsung's Galaxy S25 series exemplifies this with AI-powered ProVisual imaging that turns everyday photos into depth-mapped 3D assets. Foldables introduce layered interfaces that deepen user immersion, while tablets and notebooks extend 3D collaboration to larger canvases.
AR/VR eyewear commands a smaller numerator today but posts the fastest ascent at 36.10% CAGR. Meta's Reality Labs, despite USD 4.4 billion operating losses, booked record revenue, underscoring latent consumer pull. Google and Samsung will debut Android XR glasses in 2026, signaling platform-level commitment. These devices bridge entertainment and enterprise, from immersive games to on-site maintenance overlays. As volumes scale, the Mobile 3D market size for wearables will close the gap with smartphones over the forecast window.
3D image sensors held 46.30% of the Mobile 3D market size in 2024, serving as the cornerstone for depth capture across phones, tablets, and headsets. Sony's Thai expansion secures diode capacity for both automotive LiDAR and mobile ToF modules, easing short-term bottlenecks. VCSEL emitters remain supply-constrained, prompting OEMs to dual-source where possible.
OLED micro-displays are the momentum story, growing 35% annually. Cost curves bend downward as LG Display and Chinese entrants ramp deposition lines, shortening lead times. Display innovation also spurs demand for dedicated 3D GPUs and ISPs that manage higher pixel densities without latency spikes. The components segment illustrates a virtuous loop: lower part costs lift adoption, which in turn funds further process improvements, keeping the Mobile 3D market innovation cycle brisk.
The Mobile 3D Market Report is Segmented by 3D Enabled Mobile Devices (Smartphones, Tablets, and More), Device Components (3D Image Sensors, 3D GPUs/ISPs, and More), 3D Technology (Time-Of-Flight (ToF), Structured-Light, and More), 3D Applications (Mobile Gaming, Maps and Navigation, Animations and 3D Content Creation, and More), and Geography.
Geography Analysis
North America led with a 40% Mobile 3D market share in 2024, buoyed by enterprise investments and high discretionary income. Meta's cumulative AR/VR outlay topping USD 100 billion amplifies regional R&D momentum. Industrial firms report productivity gains from AR-enabled workflows, while consumers readily adopt premium smartphones that showcase bleeding-edge 3D features.
Asia Pacific is the growth pacesetter at a 41.02% CAGR through 2030. China's 3D industrial camera revenue reached CNY 2.362 billion (USD 334 million) in 2024 on the back of robotics demand. The region contributes USD 880 billion of mobile value-added to GDP, positioning it as both supplier and demand center. Korean and Japanese firms push display and holo-processor research, while contract manufacturers in Vietnam and India absorb new assembly mandates for AR wearables.
Europe records steady take-up driven by Industry 4.0 projects in automotive and aerospace. Regulation supports secure data handling, encouraging enterprises to trial edge-AI 3D tools. Middle East and Africa and Latin America remain nascent Mobile 3D markets, yet rising 5G penetration and urbanization lay groundwork for accelerated adoption once hardware costs dip.
- Apple Inc.
- Samsung Electronics Co. Ltd.
- Qualcomm Inc.
- LG Electronics Inc.
- Sony Corporation
- Google LLC
- Huawei Technologies Co. Ltd.
- Intel Corporation
- Nvidia Corporation
- AMS OSRAM AG
- Infineon Technologies AG
- STMicroelectronics N.V.
- pmdtechnologies ag
- MediaTek Inc.
- Xreal Technology (Formerly Nreal)
- Meta Platforms Inc.
- Xiaomi Corporation
- Oppo Mobile Telecommunications Corp.
- Vivo Communication Technology Co.
- Lenovo Group Limited
- Sharp Corporation
- HTC Corporation
- Hitachi Ltd.
- The 3M Company
Additional Benefits:
- The market estimate (ME) sheet in Excel format
- 3 months of analyst support
TABLE OF CONTENTS
1 INTRODUCTION
- 1.1 Study Assumptions and Market Definition
- 1.2 Scope of the Study
2 RESEARCH METHODOLOGY
3 EXECUTIVE SUMMARY
4 MARKET LANDSCAPE
- 4.1 Market Overview
- 4.2 Market Drivers
- 4.2.1 Rise in smartphone penetration and 5G upgrades
- 4.2.2 Rapid adoption of 3D sensing camera modules (ToF / Structured-Light)
- 4.2.3 Surge in mobile AR gaming and social-media filters
- 4.2.4 Cost decline of OLED micro-displays enabling spatial content
- 4.2.5 Edge-AI on-device 3D reconstruction for offline AR
- 4.2.6 Foldable and dual-screen form-factors driving layered 3D UI
- 4.3 Market Restraints
- 4.3.1 High cost of 3D hardware and content creation
- 4.3.2 Battery drain and thermal limits in intensive 3D processing
- 4.3.3 VCSEL supply-chain bottlenecks limiting sensor output
- 4.3.4 Lack of open, cross-platform 3D file standards
- 4.4 Value Chain Analysis
- 4.5 Regulatory Landscape
- 4.6 Technological Outlook
- 4.7 Porter's Five Forces Analysis
- 4.7.1 Bargaining Power of Suppliers
- 4.7.2 Bargaining Power of Buyers/Consumers
- 4.7.3 Threat of New Entrants
- 4.7.4 Threat of Substitute Products
- 4.7.5 Intensity of Competitive Rivalry
5 MARKET SIZE AND GROWTH FORECASTS (VALUE)
- 5.1 By 3D Enabled Mobile Devices
- 5.1.1 Smartphones
- 5.1.2 Foldable and Dual-Screen Phones
- 5.1.3 Tablets
- 5.1.4 Notebooks
- 5.1.5 AR/VR Eyewear and Head-Mounted Displays
- 5.1.6 Other 3D-Enabled Devices
- 5.2 By Device Components
- 5.2.1 3D Image Sensors (ToF, Structured-Light)
- 5.2.2 3D Displays and OLED Micro-Displays
- 5.2.3 Depth-Sensing Modules and VCSELs
- 5.2.4 3D GPUs / ISPs
- 5.2.5 Software SDKs and Middleware
- 5.3 By 3D Technology
- 5.3.1 Time-of-Flight (ToF)
- 5.3.2 Structured-Light
- 5.3.3 Stereo Vision
- 5.3.4 Light-Field / Holographic
- 5.3.5 Other Emerging Technologies
- 5.4 By 3D Applications
- 5.4.1 Mobile Gaming
- 5.4.2 Maps and Navigation
- 5.4.3 Animations and 3D Content Creation
- 5.4.4 Advertising and Social-Media Filters
- 5.4.5 Industrial and Enterprise AR
- 5.4.6 Other Applications
- 5.5 By Geography
- 5.5.1 North America
- 5.5.1.1 United States
- 5.5.1.2 Canada
- 5.5.1.3 Mexico
- 5.5.2 South America
- 5.5.2.1 Brazil
- 5.5.2.2 Argentina
- 5.5.2.3 Rest of South America
- 5.5.3 Europe
- 5.5.3.1 United Kingdom
- 5.5.3.2 Germany
- 5.5.3.3 France
- 5.5.3.4 Italy
- 5.5.3.5 Russia
- 5.5.3.6 Rest of Europe
- 5.5.4 Asia Pacific
- 5.5.4.1 China
- 5.5.4.2 India
- 5.5.4.3 Japan
- 5.5.4.4 South Korea
- 5.5.4.5 ASEAN
- 5.5.4.6 Rest of Asia Pacific
- 5.5.5 Middle East and Africa
- 5.5.5.1 Middle East
- 5.5.5.1.1 Saudi Arabia
- 5.5.5.1.2 United Arab Emirates
- 5.5.5.1.3 Turkey
- 5.5.5.1.4 Rest of Middle East
- 5.5.5.2 Africa
- 5.5.5.2.1 South Africa
- 5.5.5.2.2 Nigeria
- 5.5.5.2.3 Rest of Africa
- 5.5.1 North America
6 COMPETITIVE LANDSCAPE
- 6.1 Market Concentration
- 6.2 Strategic Moves
- 6.3 Market Share Analysis
- 6.4 Company Profiles {includes Global level Overview, Market level overview, Core Segments, Financials as available, Strategic Information, Market Rank/Share for key companies, Products and Services, and Recent Developments}
- 6.4.1 Apple Inc.
- 6.4.2 Samsung Electronics Co. Ltd.
- 6.4.3 Qualcomm Inc.
- 6.4.4 LG Electronics Inc.
- 6.4.5 Sony Corporation
- 6.4.6 Google LLC
- 6.4.7 Huawei Technologies Co. Ltd.
- 6.4.8 Intel Corporation
- 6.4.9 Nvidia Corporation
- 6.4.10 AMS OSRAM AG
- 6.4.11 Infineon Technologies AG
- 6.4.12 STMicroelectronics N.V.
- 6.4.13 pmdtechnologies ag
- 6.4.14 MediaTek Inc.
- 6.4.15 Xreal Technology (Formerly Nreal)
- 6.4.16 Meta Platforms Inc.
- 6.4.17 Xiaomi Corporation
- 6.4.18 Oppo Mobile Telecommunications Corp.
- 6.4.19 Vivo Communication Technology Co.
- 6.4.20 Lenovo Group Limited
- 6.4.21 Sharp Corporation
- 6.4.22 HTC Corporation
- 6.4.23 Hitachi Ltd.
- 6.4.24 The 3M Company
7 MARKET OPPORTUNITIES AND FUTURE OUTLOOK
- 7.1 White-space and Unmet-need Assessment
 游戏领域3D地图和建模市场规模、份额和成长分析:按组件、技术、部署模式、平台、应用、企业规模和地区划分 - 产业预测 2026-2033
 2026-2030年全球3D地图绘製与建模市场
 2035年三维地图绘製与建模市场分析及预测:按类型、产品类型、服务、技术、组件、应用、部署类型、最终用户和功能划分
 3D地图绘製和3D建模:市场份额分析、行业趋势和统计数据、成长预测(2026-2031年)
 全球3D地图绘製与建模市场规模、份额、趋势及成长分析报告(2026-2034年)全球3D建模、3D视觉化和3D资料撷取市场规模、份额、趋势和成长分析报告(2026-2034年)全球移动3D市场规模、份额、趋势和成长分析报告(2026-2034年)3D地图和3D建模市场规模、占有率、成长及全球产业分析:依类型、应用和地区划分的洞察与预测(2026-2034)
 行动电话3D相机模组市场:按技术、相机数量、感测器类型、解析度、应用和最终用户划分,全球预测(2026-2032年)
 3D地图绘製与建模市场规模、份额及成长分析(按产品、技术、部署模式、最终用户和地区划分)-产业预测(2026-2033年)