


 |
市场调查报告书
商品编码
1849914
资料中心建置:市场占有率分析、产业趋势、统计资料和成长预测(2025-2030 年)Data Center Construction - Market Share Analysis, Industry Trends & Statistics, Growth Forecasts (2025 - 2030) |
||||||
※ 本网页内容可能与最新版本有所差异。详细情况请与我们联繫。
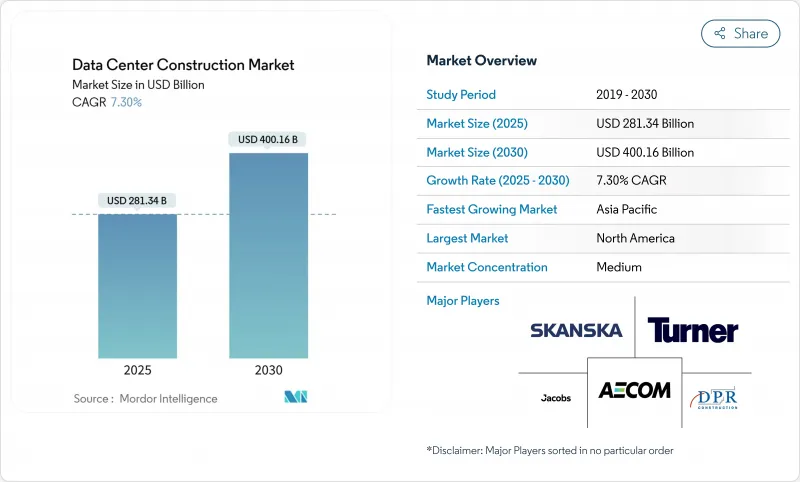
预计2025年资料中心建设市场规模将达2,813.4亿美元,2030年将达4,001.6亿美元,2025年至2030年的复合年增长率为7.30%。
这一扩张反映了对人工智慧赋能容量、广泛的云端迁移以及边缘部署的激增需求,这些需求使数位基础设施更贴近用户。超大规模营运商的资本支出大幅飙升,转化为强大的全球建设管道,该管道倾向于标准化、可重复的建设模式。然而,变压器和配电盘供应链的中断导致交货前置作业时间延长至120週以上,威胁到进度确定性并增加了计划风险。加上能源效率的监管压力,业主被迫从计划的早期阶段就整合现场可再生能源和热回收系统,这增加了设计的复杂性,同时也对获得蓬勃发展的绿色债券融资构成了挑战。
全球资料中心建立市场趋势与洞察
云端应用、人工智慧和巨量资料工作负载的扩展
高密度人工智慧机架每机架将需要 50-100 千瓦的功率,这将从根本上改变设计概念,并更倾向于采用液体冷却而非传统的风冷系统。光是微软一家公司就已为 2025 年人工智慧基础设施累计了800 亿美元的资本支出,促使建筑商设计配备 400 千伏冗余供电和现场变电站的千兆瓦级园区。此类设施对铜的需求已经是传统云端设施的六倍,从而支持了越来越多从事先进温度控管设施的专业承包商。像 Crusoe 公司位于德克萨斯州的 1.2 吉瓦园区这样的计划表明,资料中心建设市场正在挑战传统的施工方法,需要模组化模组、兆瓦级浸没式水箱以及与人工智慧计算蓝图同步的快速授权策略。
加速引进超大规模设施
预计到2030年,超大规模资料中心设施的容量将成长两倍,占全球新增资料中心容量的很大一部分。特纳建筑公司位于俄亥俄州的Vantage资料中心设施耗资20亿美元,拥有192兆瓦的IT电力,体现了标准化、重复建造的模式,透过批量采购和预製滑轨降低了单位成本。这种模式在确保规模经济的同时,也使活动集中在电力充足的市场,造成劳动力供应紧张,并导致北维吉尼亚和都柏林等地区的薪资溢价超过20%。融资结构依赖数十亿美元的购电协议,而公用事业互联队列和清洁能源目标通常决定建设阶段。
房地产、安装和维护成本不断上涨
劳动力短缺导致北维吉尼亚3.5吉瓦风电丛集的电工和水管工工资上涨20%,限制了承包商的运转率,并延长了计划工期。开发商正在寻求像凤凰城和马德里这样的二线城市,这些城市的土地和电力价格相对较低。钢骨托樑和开关设备的批量采购协议以及长期铜套期保值策略支持了DPR建筑公司等公司的成本控制策略。钢骨框架仍具有成本效益,其20年的生命週期成本为35万美元,而传统的混凝土框架则为67万至110万美元。
細項分析
到 2024 年,Tier 3 资产将占据资料中心建设市场份额的 58.2%,凭藉其均衡的冗余度和资本支出状况,其作为事实上的企业标准的地位将得到加强。同时,预计到 2030 年,Tier 4 需求的复合年增长率将达到 7.8%,因为银行、证券交易所和公共部门组织的云端运算要求为 99.995% 的执行时间支付溢价。 Tier 4计划通常会使建设复杂度翻倍,包括双重公用设施、2N动力传动系统和分隔的防火区,与 Tier 2 蓝图相比,预算最多可增加 70%。 Turner Construction 在北卡罗来纳州的模组化 Tier 4计划透过使用经过工厂测试的电源舱将试运行时间缩短了 15%。
开发商也非常重视生命週期经济性,因此资料中心建设市场中越来越多设计-建造联盟将机电、控制和设备整合在一起,并在首次通电时即可获得 Tier 4 认证。预製冷水机组和货柜式 UPS 可以在不牺牲 Tier 4 合规性的情况下进行扩展,支援多阶段部署,使支出能够满足不断增长的需求。
到2024年,主机託管业务将保持54.3%的收入占比,凸显了其多租户灵活性和快速上市的提案主张。然而,到2030年,本土超大规模资料中心的复合年增长率将达到8.5%,这反映了云端运算巨头们寻求拥有核心基础设施的策略倡议。斥资100亿美元的路易斯安那州梅塔资料中心园区,占地400万平方英尺,专门用于人工智慧训练丛集,并由600兆瓦的太阳能电力采购协议(PPA)提供支援。主机代管业者正积极回应,提供客製化的机房和液冷地板,在超大规模资料中心扩张的浪潮中保持竞争力。
建设模式正在多样化。主机託管大厅需要灵活的机柜布局、热通道封闭和共用的接入机房,以适应不同的租户密度。超大规模资料中心业者倾向于千篇一律地复製12MW的容量,以将每MW的资本支出降低20%。工厂组装的结构钢骨在现场进行预焊接,将30MW建筑的施工时间缩短至三週。因此,资料中心建设市场正日益将EPC供应商细分为面向超大规模资料中心营运商的数十亿美元的全球框架合同,以及超大规模资料中心业者边缘和企业需求的区域框架合约。
资料中心建设市场按层级类型(一级和二级、三级和四级)、资料中心类型(主机託管、自建超大规模资料中心 (CSP)、企业级、边缘运算)、基础设施(电力基础设施、机械基础设施)和地区细分。市场预测以美元计算。
区域分析
德国是欧洲资料中心建设市场的重要参与者,预计2024年将占全球资料中心建设市场的约6%。其强大的数位基础设施,尤其集中在法兰克福、柏林和汉堡等关键地区,持续吸引全球科技巨头的大量投资。德国致力于资料中心的永续发展,这体现在严格的能源效率法规和日益普及的可再生能源上。法兰克福凭藉其位于欧洲中部的位置和广泛的光纤连接,正逐渐成为重要的数位枢纽。先进的技术生态系统、熟练的劳动力和稳定的政治环境进一步增强了德国资料中心的实力。德国资料中心越来越注重创新的冷却技术和永续的建设方法,为业界的环境责任树立了新的标准。
其他福利
- Excel 格式的市场预测 (ME) 表
- 3个月的分析师支持
目录
第一章 引言
- 研究假设和市场定义
- 调查范围
第二章调查方法
第三章执行摘要
第四章 市场状况
- 市场概况
- 市场驱动因素
- 云端应用、人工智慧和巨量资料工作负载的增加
- 加速超大规模设施的采用
- 增加人口密集地区附近的边缘运算部署
- 可再生能源法规影响设施设计
- 预製/模组化结构加快上市时间
- ESG相关绿色债券融资刺激资本投资
- 市场限制
- 房地产、安装和维护成本不断上涨
- 更严格的能源消耗和碳排放监管限制
- 先进液体冷却技术纯熟劳工短缺
- 大容量动力设备供应链不稳定
- 供应链分析
- 监管格局
- 技术展望
- 波特五力模型
- 供应商的议价能力
- 消费者议价能力
- 新进入者的威胁
- 替代品的威胁
- 竞争对手之间的竞争
- 关键资料中心统计数据
- 区域级综合资料中心营运商(单位:MW)
- 各地区即将启动的重大资料中心计划清单(2025-2030年)
- 资料中心建置的CAPEX和OPEX
- 2023 年及 2024 年各地区资料中心电力吸收容量(MW)
- 各地区将人工智慧(AI)融入资料中心建设
- 监理与合规框架
第五章市场规模及成长预测
- 按等级类型
- 1级和2级
- 第 3 层
- 第 4 层
- 依资料中心类型
- 搭配
- 自建超大规模资料中心业者(CSP)
- 企业和边缘
- 按基础设施
- 电力基础设施
- 配电解决方案
- 电源备援解决方案
- 机械基础设施
- 冷却系统
- 机架和橱柜
- 伺服器和储存
- 其他机械基础设施
- 一般建筑
- 服务——设计、咨询、整合、支援、维护
- 按地区
- 北美洲
- 美国
- 加拿大
- 墨西哥
- 南美洲
- 巴西
- 阿根廷
- 南美洲其他地区
- 欧洲
- 德国
- 英国
- 法国
- 义大利
- 西班牙
- 俄罗斯
- 其他欧洲地区
- 亚太地区
- 中国
- 日本
- 印度
- 韩国
- 澳洲和纽西兰
- 其他亚太地区
- 中东和非洲
- 中东
- 波湾合作理事会国家
- 土耳其
- 以色列
- 其他中东地区
- 非洲
- 南非
- 埃及
- 奈及利亚
- 其他非洲国家
- 1级和2级
第六章 竞争态势
- 市场集中度
- 策略趋势
- 市占率分析
- Data Center Infrastructure Investment Based on Megawatt(MW)Capacity, 2024 vs 2030
- Data Center Construction Landscape(Key Vendors Listings)
- 公司简介
- AECOM
- Turner Construction Co.
- DPR Construction
- Jacobs Solutions Inc.
- Skanska AB
- Balfour Beatty plc
- Whiting-Turner Contracting Co.
- Hensel Phelps
- Fortis Construction Inc.
- Goodman Group
- PT Jaya Obayashi
- Hibiya Engineering Ltd.
- Fluor Corporation
- Keppel Data Centres Holding
- NTT Global Data Centers
- Equinix Inc.
- Digital Realty Trust Inc.
- QTS Realty Trust LLC
- China State Construction Engineering Corp.
- Larsen and Toubro Ltd.(LandT Construction)
- Bouygues Construction SA
- Vinci Energies(Actemium)
- Samsung CandT Corporation
- Collen Construction Ltd.
- Corgan
- List of Data Center Construction Companies
第七章 市场机会与未来展望
The data center construction market size is expected to be valued at USD 281.34 billion in 2025 and is forecast to reach USD 400.16 billion by 2030, advancing at a 7.30% CAGR during 2025-2030.
The expansion reflects surging demand for AI-ready capacity, widespread cloud migration, and edge deployments that place digital infrastructure closer to users. Capital spending by hyperscale operators has surged significantly, translating into a robust global construction pipeline that favors standardized, repeatable build models. Yet supply-chain disruptions in transformers and switchgear lengthen delivery lead times to more than 120 weeks, threatening schedule certainty and elevating project risk. Parallel regulatory pressure on energy efficiency pushes owners to integrate on-site renewables and heat-recovery systems from project inception, adding design complexity but also unlocking access to fast-growing pools of green-bond financing.
Global Data Center Construction Market Trends and Insights
Growing Cloud Applications, AI and Big Data Workloads
High-density AI racks now demand 50-100 kW per rack, fundamentally changing design briefs and favoring liquid cooling over legacy air systems. Microsoft alone has earmarked USD 80 billion in 2025 CAPEX for AI infrastructure, spurring builders to engineer gigawatt-scale campuses with redundant 400 kV feeds and on-site substations. Copper demand for these builds is already six times the level of conventional cloud facilities, which supports a growing specialty trade segment for advanced thermal-management installation. Projects such as Crusoe's 1.2 GW campus in Texas illustrate how the data center construction market is stretching traditional construction practices, requiring modular blocks, megawatt-class immersion tanks, and rapid permitting strategies that keep pace with AI compute roadmaps.
Accelerating Adoption of Hyperscale Facilities
Hyperscale capacity is forecast to triple by 2030, accounting for most incremental square footage added worldwide. Turner Construction's USD 2 billion Vantage facility in Ohio, with 192 MW of IT power, typifies the standardized, repeat-build approach that lowers unit costs via bulk procurement and prefabricated skids. While the model secures economies of scale, it concentrates activity in power-rich markets, tightening labor availability and driving wage premiums above 20% in regions such as Northern Virginia and Dublin. Financial structures depend on multibillion-dollar power-purchase agreements, meaning utility interconnection queues and clean-energy targets often dictate construction phasing.
Escalating Real-Estate, Installation and Maintenance Costs
Labor shortages layered on a 20% wage premium for electricians and pipefitters across Northern Virginia's 3.5 GW cluster, constraining contractor availability and extending project schedules. Developers increasingly scout secondary metros such as Phoenix and Madrid, where land and power remain comparatively inexpensive. Bulk-buy agreements for steel joists and switchgear plus long-term hedges on copper now underpin cost-control strategies at firms like DPR Construction, which completed a 100 MW campus in Texas on a fixed-price basis despite volatile commodity inputs. Steel framing remains cost-advantaged, with 20-year lifecycle outlays of USD 350,000 compared to USD 670,000-1.1 million for traditional concrete shells.
Other drivers and restraints analyzed in the detailed report include:
- Rising Edge-Computing Build-outs Near Population Hubs
- Renewable-Energy Mandates Shaping Facility Design
- Supply-Chain Volatility in High-Capacity Power Gear
For complete list of drivers and restraints, kindly check the Table Of Contents.
Segment Analysis
Tier 3 assets retained 58.2% of the data center construction market share in 2024, reinforcing their role as the de facto enterprise standard thanks to balanced redundancy and capex profiles. Meanwhile, Tier 4 demand is projected to grow at 7.8% CAGR through 2030 as banks, stock exchanges, and public-sector cloud mandates pay premiums for 99.995% uptime. Tier 4 projects often double construction complexity: dual utility feeds, 2N power trains, and compartmentalized fire zones inflate budgets by up to 70% over Tier 2 blueprints. Turner Construction's modular Tier 4 build in North Carolina cut commissioning time by 15% using factory-tested power pods, illustrating how innovation tempers cost escalation.
Developers also weigh lifecycle economics. The data center construction market therefore, sees rising design-build consortiums that integrate mechanical, electrical, and controls to certify Tier 4 on first power-up. Prefabricated chillers and containerized UPS segments enable scale without sacrificing Tier 4 compliance, supporting multi-phase rollouts that align spend with demand growth.
Colocation retained 54.3% of 2024 revenue, underlining its value proposition of multi-tenant flexibility and speed-to-market. However, self-built hyperscalers will widen at 8.5% CAGR through 2030, reflecting strategic moves by cloud giants to own core infrastructure. The USD 10 billion Meta Louisiana campus uses a 4 million-square-foot layout dedicated to AI training clusters and backed by a 600 MW solar PPA, underscoring how scale economics tilt toward owner-operator models. Colocation operators respond by offering build-to-suit halls and liquid-cooling-ready floors, preserving relevance amid hyperscale expansion.
Construction modalities diverge. Colocation halls require flexible cage layouts, hot-aisle containment, and shared meet-me rooms that accommodate diverse tenant densities. Hyperscalers instead prefer 12 MW blocks replicated in cookie-cutter fashion to cut capex per MW by 20%. Factory-assembled structural steel frames arrive on site pre-welded, slashing erection times to three weeks for a 30-MW building. As a result, the data center construction market is increasingly segmenting EPC suppliers into multi-billion-dollar global framework agreements for hyperscalers and regional frameworks for edge and enterprise demand.
Data Center Construction Market is Segmented by Tier Type (Tier 1 and 2, Tier 3 and Tier 4), Data Center Type(Colocation, Self-Built Hyperscalers (CSPs), Enterprise, and Edge), and Infrastructure (Electrical Infrastructure, Mechanical Infrastructure), and by Geography. The Market Forecasts are Provided in Terms of Value (USD).
Geography Analysis
Germany stands as the cornerstone of Europe's data center construction market, commanding approximately 6% of the global data center construction market size in 2024. The country's robust digital infrastructure, particularly concentrated in major hubs like Frankfurt, Berlin, and Hamburg, continues to attract significant investments from global technology giants. The nation's commitment to sustainable data center development is evident through strict energy efficiency regulations and the increasing adoption of renewable energy sources. Frankfurt, in particular, has emerged as a critical digital hub, benefiting from its central European location and extensive fiber connectivity. The country's data center landscape is further strengthened by its advanced technological ecosystem, skilled workforce, and stable political environment. German data centers are increasingly focusing on innovative cooling technologies and sustainable construction practices, setting new standards for environmental responsibility in the industry.
- AECOM
- Turner Construction Co.
- DPR Construction
- Jacobs Solutions Inc.
- Skanska AB
- Balfour Beatty plc
- Whiting-Turner Contracting Co.
- Hensel Phelps
- Fortis Construction Inc.
- Goodman Group
- PT Jaya Obayashi
- Hibiya Engineering Ltd.
- Fluor Corporation
- Keppel Data Centres Holding
- NTT Global Data Centers
- Equinix Inc.
- Digital Realty Trust Inc.
- QTS Realty Trust LLC
- China State Construction Engineering Corp.
- Larsen and Toubro Ltd. (LandT Construction)
- Bouygues Construction SA
- Vinci Energies (Actemium)
- Samsung CandT Corporation
- Collen Construction Ltd.
- Corgan
Additional Benefits:
- The market estimate (ME) sheet in Excel format
- 3 months of analyst support
TABLE OF CONTENTS
1 INTRODUCTION
- 1.1 Study Assumptions and Market Definition
- 1.2 Scope of the Study
2 RESEARCH METHODOLOGY
3 EXECUTIVE SUMMARY
4 MARKET LANDSCAPE
- 4.1 Market Overview
- 4.2 Market Drivers
- 4.2.1 Growing cloud applications, AI and big data workloads
- 4.2.2 Accelerating adoption of hyperscale facilities
- 4.2.3 Rising edge-computing build-outs near population hubs
- 4.2.4 Renewable-energy mandates shaping facility design
- 4.2.5 Prefabricated / modular builds shrinking time-to-market
- 4.2.6 ESG-linked green-bond financing unlocking capex
- 4.3 Market Restraints
- 4.3.1 Escalating real-estate, installation and maintenance cost
- 4.3.2 Stricter energy-consumption and carbon-compliance limits
- 4.3.3 Shortage of skilled labor for advanced liquid cooling
- 4.3.4 Supply-chain volatility in high-capacity power gear
- 4.4 Supply-Chain Analysis
- 4.5 Regulatory Landscape
- 4.6 Technological Outlook
- 4.7 Porter's Five Forces
- 4.7.1 Bargaining Power of Suppliers
- 4.7.2 Bargaining Power of Consumers
- 4.7.3 Threat of New Entrants
- 4.7.4 Threat of Substitutes
- 4.7.5 Intensity of Competitive Rivalry
- 4.8 Key Data Center Statistics
- 4.8.1 Exhaustive Data Center Operators on Regional Level (in MW)
- 4.8.2 List of Major Upcoming Data Center Projects across various regions(2025-2030)
- 4.8.3 CAPEX and OPEX For Data Center Construction
- 4.8.4 Data Center Power Capacity Absorption In MW, regions, 2023 and 2024
- 4.9 Artificial Intelligence (AI) Inclusion in Data Center Construction across Various Regions
- 4.10 Regulatory and Compliance Framework
5 MARKET SIZE AND GROWTH FORECASTS (VALUE)
- 5.1 By Tier Type
- 5.1.1 Tier 1 and 2
- 5.1.1.1 Tier 3
- 5.1.1.2 Tier 4
- 5.1.2 By Data Center Type
- 5.1.2.1 Colocation
- 5.1.2.2 Self-build Hyperscalers (CSPs)
- 5.1.2.3 Enterprise and Edge
- 5.1.3 By Infrastructure
- 5.1.3.1 By Electrical Infrastructure
- 5.1.3.1.1 Power Distribution Solution
- 5.1.3.1.2 Power Backup Solutions
- 5.1.3.2 By Mechanical Infrastructure
- 5.1.3.2.1 Cooling Systems
- 5.1.3.2.2 Racks and Cabinets
- 5.1.3.2.3 Servers and Storage
- 5.1.3.2.4 Other Mechanical Infrastructure
- 5.1.3.3 General Construction
- 5.1.3.4 Service - Design and Consulting, Integration, Support and Maintenance
- 5.1.4 By Geography
- 5.1.4.1 North America
- 5.1.4.1.1 United States
- 5.1.4.1.2 Canada
- 5.1.4.1.3 Mexico
- 5.1.4.2 South America
- 5.1.4.2.1 Brazil
- 5.1.4.2.2 Argentina
- 5.1.4.2.3 Rest of South America
- 5.1.4.3 Europe
- 5.1.4.3.1 Germany
- 5.1.4.3.2 United Kingdom
- 5.1.4.3.3 France
- 5.1.4.3.4 Italy
- 5.1.4.3.5 Spain
- 5.1.4.3.6 Russia
- 5.1.4.3.7 Rest of Europe
- 5.1.4.4 Asia-Pacific
- 5.1.4.4.1 China
- 5.1.4.4.2 Japan
- 5.1.4.4.3 India
- 5.1.4.4.4 South Korea
- 5.1.4.4.5 Australia and New Zealand
- 5.1.4.4.6 Rest of Asia-Pacific
- 5.1.4.5 Middle East and Africa
- 5.1.4.5.1 Middle East
- 5.1.4.5.1.1 Gulf Corporation Countries
- 5.1.4.5.1.2 Turkey
- 5.1.4.5.1.3 Israel
- 5.1.4.5.1.4 Rest of Middle East
- 5.1.4.5.2 Africa
- 5.1.4.5.2.1 South Africa
- 5.1.4.5.2.2 Egypt
- 5.1.4.5.2.3 Nigeria
- 5.1.4.5.2.4 Rest of Africa
- 5.1.1 Tier 1 and 2
6 COMPETITIVE LANDSCAPE
- 6.1 Market Concentration
- 6.2 Strategic Moves
- 6.3 Market Share Analysis
- 6.4 Data Center Infrastructure Investment Based on Megawatt (MW) Capacity, 2024 vs 2030
- 6.5 Data Center Construction Landscape (Key Vendors Listings)
- 6.6 Company Profiles (includes Global level Overview, Market level overview, Core Segments, Financials as available, Strategic Information, Market Rank/Share for key companies, Products and Services, Recent Developments)
- 6.6.1 AECOM
- 6.6.2 Turner Construction Co.
- 6.6.3 DPR Construction
- 6.6.4 Jacobs Solutions Inc.
- 6.6.5 Skanska AB
- 6.6.6 Balfour Beatty plc
- 6.6.7 Whiting-Turner Contracting Co.
- 6.6.8 Hensel Phelps
- 6.6.9 Fortis Construction Inc.
- 6.6.10 Goodman Group
- 6.6.11 PT Jaya Obayashi
- 6.6.12 Hibiya Engineering Ltd.
- 6.6.13 Fluor Corporation
- 6.6.14 Keppel Data Centres Holding
- 6.6.15 NTT Global Data Centers
- 6.6.16 Equinix Inc.
- 6.6.17 Digital Realty Trust Inc.
- 6.6.18 QTS Realty Trust LLC
- 6.6.19 China State Construction Engineering Corp.
- 6.6.20 Larsen and Toubro Ltd. (LandT Construction)
- 6.6.21 Bouygues Construction SA
- 6.6.22 Vinci Energies (Actemium)
- 6.6.23 Samsung CandT Corporation
- 6.6.24 Collen Construction Ltd.
- 6.6.25 Corgan
- 6.7 List of Data Center Construction Companies
7 MARKET OPPORTUNITIES and FUTURE OUTLOOK
- 7.1 White-space and Unmet-need Assessment
 资料中心建置市场分析及预测(至2035年):类型、产品、服务、技术、组件、应用、材料类型、部署模式、最终用户、设备
 2026-2030年全球资料中心建置市场
 新加坡资料中心建置:市场占有率分析、产业趋势与统计、成长预测(2026-2031)
 资料中心建置市场报告:按建设类型、资料中心类型、等级标准、产业垂直领域和地区划分(2026-2034 年)
 资料中心建置市场-全球产业规模、份额、趋势、机会及预测(依基础设施类型、层级、资料中心规模、最终用户产业、地区及竞争格局划分,2021-2031)
 资料中心机械设备建置市场(依组件类型、液冷系统、建置类型、等级及计划类型划分)-2026-2032年全球预测拉丁美洲资料中心建置:市场占有率分析、产业趋势与统计、成长预测(2026-2031 年)
 资料中心监控市场:按组件、按监控方式、按最终用户、按地区划分日本资料中心建置市场报告(按建设类型、资料中心类型、等级标准、垂直产业和地区划分,2026-2034年)
 资料中心建置市场机会、成长要素、产业趋势分析及2026年至2035年预测