


 |
市场调查报告书
商品编码
1849931
智慧交通:市场份额分析、行业趋势、统计数据和成长预测(2025-2030 年)Smart Transportation - Market Share Analysis, Industry Trends & Statistics, Growth Forecasts (2025 - 2030) |
||||||
※ 本网页内容可能与最新版本有所差异。详细情况请与我们联繫。
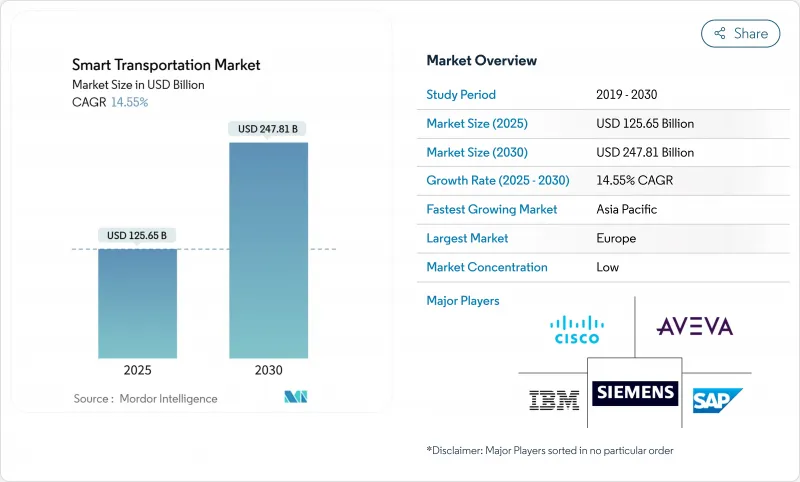
预计到 2025 年,智慧交通市场规模将达到 1,256.5 亿美元,到 2030 年将达到 2,478.1 亿美元,复合年增长率为 14.55%。
在强有力的政策推动和不断增长的城市人口的驱动下,各国政府正转向以数据为中心的交通系统,以在不增加车道的情况下提升通行能力。云端原生分析、5G赋能的车辆互联和数数位双胞胎建模正在融合,以减少拥塞、缩短行程时间并提高安全性。 2024年10月,美国核准了42亿美元用于44个下一代旅游计划。欧洲以其永续和智慧出行策略引领潮流,该策略提倡500公里以下的零排放出行,并强制要求所有交通途径开放资料。亚太地区发展最为迅速,特大城市正在部署智慧高速公路和出行即服务(MaaS)平台,以应对史上规模最大的都市化浪潮。
全球智慧交通市场趋势与洞察
城市人口的快速成长给原有道路网络带来了压力。
预计2030年,全球60%的人口将居住在都市区,都市区进程导致前所未有的交通密度。交通壅塞已使许多经济体损失2%至4%的GDP,迫使交通部门采用人工智慧驱动的交通优化方案,而非耗资庞大的道路扩建。北京的智慧交通号誌网路预计到2024年将平均延误时间减少23%,孟买和雅加达也正在部署类似的系统。数位双胞胎交通市场将直接受益于城市密度的增加。
政府对智慧城市和智慧交通系统计画的资金投入
立法支持正体现在数十亿美元的智慧出行计画储备中。美国《基础设施投资与就业法案》拨款912亿美元用于公共交通现代化,而ATTAIN计画每年拨出6,000万美元用于先进技术的试点。欧盟的类似倡议要求实现互通资料共用和碳中和走廊,确保智慧交通市场供应商的需求稳定。资金筹措条款通常要求在农村地区部署,从而将潜在需求扩展到一线城市之外,并促进低成本感测器组件和云端编配方面的创新。
全市范围内推广ATM机需要高额初始投资
部署先进的交通管理骨干网,每个路口的成本可能高达6000至7000美元,在大城市,资本支出甚至超过7000万美元。预算週期和采购规则阻碍了系统的推广应用,尤其是在税基较小的地区。儘管官民合作关係和基于使用量的定价模式正在兴起,以延缓资本投资,但资金摩擦仍然是智慧交通市场面临的最紧迫的阻力。
细分市场分析
预计到2024年,交通管理将占智慧交通市场的32.30%,成长速度超过整体成长,因为各城市都在寻求透过人工智慧整合实现两位数的交通拥堵缓解。即时自适应交通号誌控制已在佛罗里达州的试点路段实现了35%的出行时间缩短,这为采购交叉路口分析、事件侦测和路径优化等解决方案奠定了基础。市政采购者青睐模组化的云端控制面板,这种面板无需进行大规模升级即可接入现有控制器,这项设计原则也拓展了供应商的灵活性。
停车管理技术正以13.2%的复合年增长率快速发展,将停车位资源转化为数位化资产,并有效减少环城交通,而环城交通量可占市中心交通量的30%。随着乘客从车辆所有权转向按使用量付费的模式,公共交通也蓬勃发展。在货运领域,协同主动式车距维持定速系统已展现出5-6%的燃油节省和平均速度提升,这为物流智慧交通系统(ITS)的部署提供了商业依据,并进一步推动了智慧交通市场的发展。
到2024年,先进的交通管理系统将占据智慧交通市场32%的份额,成为多模态网路的数位化作业系统。各机构正以云端原生编排系统取代孤立的本地伺服器,以支援预测分析、工作区自动化和温室气体排放仪錶板等功能。加州采购将20个旧有系统整合到一个商用现成(COTS)平台上的编配,正是这种整合趋势的典型例证。
协作车辆系统(Cooperative Vehicle Systems)的复合年增长率高达17.2%,它将5G与边缘人工智慧结合,实现了车队行驶、高级危险预警和优先紧急路线规划等功能。 5G汽车协会在巴黎进行的2025年非地面电波网路试验检验了混合卫星-蜂窝V2X技术,扩大了农村高速公路的覆盖范围。随着拥塞收费重塑定价来源并鼓励模式转换,智慧型运输定价系统(ITPS)正蓬勃发展。
区域分析
在严格的排放目标和统一的资金筹措模式的支持下,欧洲将占2024年全球销售量的39.5%。永续与智慧交通策略提出,到2030年,零排放汽车数量将达到3,000万辆,高速铁路运力将增加一倍。公共资料空间和开放原始码模拟平台的投资将加速供应商创新,并帮助各城市在全部区域内进行绩效基准比较。北欧成熟的通讯基础设施和早期实施的拥堵收费制度,为其他北欧国家提供了可复製的模式。
北美位居第二。联邦政府的「智慧交通技术补助金」(SMART Grant,每年1亿美元)和「大型补助金走廊」等计画为试点计画扩展和农村地区推广。硅谷的云端运算和半导体产业丛集了丰富的供应商生态系统,推动了智慧交通市场所需的雷射雷达模组、地图API和中介软体的快速商业化。美国联邦通信委员会(FCC)批准使用商用蜂窝频谱进行补充卫星通讯,将把车联网(V2X)覆盖范围扩展到人口较少的地区,并增强紧急服务的韧性。
亚太地区以13.6%的复合年增长率 (CAGR) 创下最高增速。中国各省正积极推动路侧车联网 (C-V2X) 技术建设,以满足国家指令要求;印度的高速公路和港口项目则正在整合物联网感测器,以保障行程时间。东协各大城市正在引入与国民身分证系统关联的非接触式票务系统,以缩短出行即服务 (MaaS) 的普及引进週期。同时,中东国家正将「2030愿景」资金投入自动驾驶地铁线路建设中,目标是到2030年实现区域智慧交通系统 (ITS) 支出70亿美元。综上所述,这些倡议巩固了亚太地区作为智慧交通市场重要成长引擎的地位。
其他福利:
- Excel格式的市场预测(ME)表
- 3个月的分析师支持
目录
第一章 引言
- 研究假设和市场定义
- 调查范围
第二章调查方法
第三章执行摘要
第四章 市场情势
- 市场概览
- 市场驱动因素
- 城市人口的快速成长给现有道路网络带来了压力。
- 政府智慧城市资金与智慧交通系统指令
- 人工智慧边缘感测器的成本大幅下降
- MaaS订阅平台的成长
- 将收费公路过渡到基于区块链的小额支付轨道
- 为密集的城市峡谷提供航空级GNSS冗余
- 市场限制
- 全市范围内的自动柜员机系统部署需要大量的前期投资。
- 缺乏V2X跨厂商数据标准
- 公共机构的网路安全合规责任
- 主要城市5.9GHz专用频谱短缺
- 价值/供应链分析
- 监管环境
- 技术展望
- 波特五力分析
- 供应商的议价能力
- 买方的议价能力
- 新进入者的威胁
- 竞争对手之间的竞争
- 替代品的威胁
- 宏观经济趋势的影响
- 产业价值链分析
第五章 市场规模与成长预测
- 透过使用
- 交通管理
- 道路安全保障
- 停车场管理
- 公共运输智慧交通系统
- 车用通讯系统
- 货运/物流资讯科技服务
- 依产品类型
- 高阶旅客资讯系统(ATIS)
- 高阶运输管理系统(ATMS)
- 高级运输定价系统(ATPS)
- 先进公共运输系统(APTS)
- 合作式多式联运系统(C-ITS)
- 透过服务
- 部署与集成
- 云端和託管服务
- 专业咨询
- 透过交通工具
- 路
- 铁路
- 空气
- 海路
- 透过连接技术
- DSRC/C-V2X
- 5G 和 LTE-M
- 卫星(GNSS, L波段)
- 按地区
- 北美洲
- 美国
- 加拿大
- 墨西哥
- 南美洲
- 巴西
- 阿根廷
- 欧洲
- 德国
- 英国
- 法国
- 俄罗斯
- 其他欧洲地区
- 亚太地区
- 中国
- 日本
- 印度
- 亚太其他地区
- 中东和非洲
- 沙乌地阿拉伯
- 阿拉伯聯合大公国
- 南非
- 其他中东和非洲地区
- 北美洲
第六章 竞争情势
- 市场集中度
- 策略性措施与併购
- 市占率分析
- 公司简介
- Siemens Corporation
- Cisco Systems Inc.
- IBM Corporation
- SAP SE
- AVEVA Group PLC
- Thales Group
- Huawei Technologies Co. Ltd.
- Alstom SA
- Kapsch TrafficCom AG
- Hitachi Ltd.
- Oracle Corporation
- Advantech Co. Ltd.
- Orange SA
- TransCore LP
- Cubic Transportation Systems
- TomTom NV
- Panasonic Holdings Corp.
- Ericsson AB
- Qualcomm Inc.
- Continental AG
- Iteris Inc.
- PTV Group
第七章 市场机会与未来展望
The smart transportation market size is valued at USD 125.65 billion in 2025 and is forecast to reach USD 247.81 billion by 2030, registering a 14.55% CAGR.
Strong policy backing and rising urban populations are steering governments toward data-centric traffic systems that deliver more capacity without paving additional lanes. Cloud-native analytics, 5G-enabled vehicle connectivity, and digital twin modeling are converging to cut congestion, shorten travel times, and improve safety. Public capital is flowing into deployment: in October 2024, the United States approved USD 4.2 billion for 44 next-generation mobility projects.Europe leads adoption through its Sustainable and Smart Mobility Strategy that promotes zero-emission travel under 500 km and mandates open data across modes of transport. Asia-Pacific is scaling fastest as megacities roll out intelligent highways and MaaS platforms to manage the largest wave of urbanisation in history.
Global Smart Transportation Market Trends and Insights
Rapid Urban-Population Growth Stressing Legacy Road Networks
The migration of people toward cities is creating unprecedented traffic density, with urban areas forecast to host 60% of the global population by 2030. Congestion already erodes 2-4% of GDP in many economies, spurring transport agencies to deploy AI-driven traffic optimisation instead of costly road widening. Beijing's smart signal network cut average delays by 23% in 2024, and similar deployments are underway in Mumbai and Jakarta. Digital twins allow planners to stress-test lane configurations virtually, while adaptive signal control paired with vehicle probe data has trimmed corridor travel times by 25% inside Asian megacities. The smart transportation market, therefore, benefits directly from urban density as cities prioritise technological fixes over concrete expansions.
Government Smart-City Funding & ITS Mandates
Legislative support is translating into multibillion-dollar pipelines for intelligent mobility. The U.S. Infrastructure Investment and Jobs Act allocates USD 91.2 billion for modernising public transit, and the ATTAIN program reserves USD 60 million annually for advanced technology pilots. Parallel initiatives in the European Union mandate interoperable data sharing and carbon-neutral corridors, anchoring demand certainty for vendors in the smart transportation market. Funding provisions often require rural inclusion, widening addressable demand beyond tier-one cities, and stimulating innovation in low-cost sensor packages and cloud orchestration.
High Upfront Capex for City-Wide ATMS Roll-Outs
Deploying an advanced traffic management backbone can cost USD 6,000-7,000 per intersection, and large cities easily exceed USD 70 million capital outlay. Budget cycles and procurement rules slow adoption, particularly where tax bases are small. Public-private partnerships and usage-based pricing models are emerging to defer capex, yet financial friction remains the most immediate headwind facing the smart transportation market.
Other drivers and restraints analyzed in the detailed report include:
- Drop-in Cost of AI-Enabled Edge Sensors
- Growth of MaaS Subscription Platforms
- Lack of Cross-Vendor Data Standards for V2X
For complete list of drivers and restraints, kindly check the Table Of Contents.
Segment Analysis
Traffic Management contributed 32.30% market share to the smart transportation market in 2024 and is projected to outpace overall growth as cities target double-digit congestion cuts with AI coordination. Real-time adaptive signal control shows 35% travel-time savings in pilot corridors across Florida, underpinning procurement for intersection analytics, incident detection, and corridor optimisation. Municipal buyers value modular cloud dashboards that plug into legacy controllers without forklift upgrades, a design principle widening vendor addressability.
Parking Management technologies are advancing at a 13.2% CAGR, converting curbside inventory into digital assets and slashing cruising traffic that can reach 30% of downtown volumes. Public Transport is growing as passengers shift from ownership toward usage-based subscriptions. In freight, cooperative adaptive cruise control demonstrates 5-6% fuel savings and higher average speeds, generating business cases for logistics ITS deployments and further boosting the smart transportation market.
Advanced Transportation Management Systems represented 32% of smart transportation market share in 2024, acting as the digital operating system for multi-modal networks. Agencies are replacing siloed, on-premise servers with cloud-native orchestration that supports predictive analytics, work-zone automation, and greenhouse-gas dashboards. California's procurement to unify 20 legacy systems under a single COTS platform exemplifies the consolidation trend.
Cooperative Vehicle Systems, posting a 17.2% CAGR, marries 5G and edge AI to enable platooning, advanced hazard alerts, and prioritised emergency routing. The 5G Automotive Association's 2025 non-terrestrial network trial in Paris validated hybrid satellite-cellular V2X, widening coverage for rural highways 5gaa.org. Advanced Transportation Pricing Systems are gaining momentum as congestion pricing reshapes revenue streams and nudges modal shift, often using blockchain for real-time micro-tolling.
The Smart Transportation Market is Segmented by Application (Traffic Management, Road Safety and Security, and More), Product Type (Advanced Traveler Information Systems (ATIS), and More), Service (Deployment and Integration, and More), Transportation Mode (Roadways, Railways, and More), Connectivity Technology (DSRC/C-V2X, 5G and LTE-M, and More), and by Geography. The Market Forecasts are Provided in Terms of Value (USD).
Geography Analysis
Europe captured 39.5% of 2024 revenue in the smart transportation market, underpinned by stringent emissions targets and cohesive funding models. The Sustainable and Smart Mobility Strategy calls for 30 million zero-emission vehicles and a doubling of high-speed rail traffic by 2030. Investment in public data spaces and open-source simulation platforms accelerates vendor innovation while helping cities benchmark performance region-wide. Northern Europe's mature telecom infrastructure and early adoption of congestion pricing provide templates replicable across the continent.
North America ranks second. Federal programmes, including SMART Grants (USD 100 million annually) and mega-grant corridors, finance pilot scaling and rural outreach. Silicon Valley's cloud and semiconductor clusters feed a rich supplier ecosystem, allowing rapid commercialization of LIDAR modules, mapping APIs, and middleware critical to the smart transportation market. The FCC's approval for supplemental satellite coverage using commercial mobile spectrum extends V2X reach into sparsely populated regions, reinforcing the resilience of emergency services.
Asia-Pacific posts the highest growth at 13.6% CAGR. Chinese provinces are activating roadside C-V2X to meet national mandates, while India's dedicated highway and port programmes integrate IoT sensors for journey-time guarantees. ASEAN megacities deploy contactless ticketing tied to national identity schemes, shortening adoption cycles for Mobility-as-a-Service. In parallel, Middle Eastern states channel Vision 2030 funds into autonomous metro lines, targeting USD 7 billion regional ITS spend by 2030. Collectively, these initiatives cement APAC as a principal volume engine for the smart transportation market.
- Siemens Corporation
- Cisco Systems Inc.
- IBM Corporation
- SAP SE
- AVEVA Group PLC
- Thales Group
- Huawei Technologies Co. Ltd.
- Alstom SA
- Kapsch TrafficCom AG
- Hitachi Ltd.
- Oracle Corporation
- Advantech Co. Ltd.
- Orange SA
- TransCore LP
- Cubic Transportation Systems
- TomTom NV
- Panasonic Holdings Corp.
- Ericsson AB
- Qualcomm Inc.
- Continental AG
- Iteris Inc.
- PTV Group
Additional Benefits:
- The market estimate (ME) sheet in Excel format
- 3 months of analyst support
TABLE OF CONTENTS
1 INTRODUCTION
- 1.1 Study Assumptions and Market Definition
- 1.2 Scope of the Study
2 RESEARCH METHODOLOGY
3 EXECUTIVE SUMMARY
4 MARKET LANDSCAPE
- 4.1 Market Overview
- 4.2 Market Drivers
- 4.2.1 Rapid urban?population growth stressing legacy road networks
- 4.2.2 Government smart-city funding and ITS mandates
- 4.2.3 Drop-in cost of AI-enabled edge sensors
- 4.2.4 Growth of MaaS subscription platforms
- 4.2.5 Transition of toll roads to blockchain-based micro-payment rails
- 4.2.6 Aviation-grade GNSS redundancy adopted for dense urban canyons
- 4.3 Market Restraints
- 4.3.1 High upfront capex for city-wide ATMS roll-outs
- 4.3.2 Lack of cross-vendor data standards for V2X
- 4.3.3 Cyber-security-compliance liabilities for public agencies
- 4.3.4 Scarcity of dedicated 5.9 GHz spectrum in megacities
- 4.4 Value / Supply-Chain Analysis
- 4.5 Regulatory Landscape
- 4.6 Technological Outlook
- 4.7 Porter's Five Forces Analysis
- 4.7.1 Bargaining Power of Suppliers
- 4.7.2 Bargaining Power of Buyers
- 4.7.3 Threat of New Entrants
- 4.7.4 Intensity of Competitive Rivalry
- 4.7.5 Threat of Substitute Products
- 4.8 Impact of Macroeconomic Trends
- 4.9 Industry Value-Chain Analysis
5 MARKET SIZE AND GROWTH FORECASTS (VALUE)
- 5.1 By Application
- 5.1.1 Traffic Management
- 5.1.2 Road Safety and Security
- 5.1.3 Parking Management
- 5.1.4 Public Transport ITS
- 5.1.5 Automotive Telematics
- 5.1.6 Freight and Logistics ITS
- 5.2 By Product Type
- 5.2.1 Advanced Traveler Information Systems (ATIS)
- 5.2.2 Advanced Transportation Management Systems (ATMS)
- 5.2.3 Advanced Transportation Pricing Systems (ATPS)
- 5.2.4 Advanced Public Transportation Systems (APTS)
- 5.2.5 Cooperative Vehicle Systems (C-ITS)
- 5.3 By Service
- 5.3.1 Deployment and Integration
- 5.3.2 Cloud and Managed Services
- 5.3.3 Professional and Consulting
- 5.4 By Transportation Mode
- 5.4.1 Roadways
- 5.4.2 Railways
- 5.4.3 Airways
- 5.4.4 Maritime
- 5.5 By Connectivity Technology
- 5.5.1 DSRC / C-V2X
- 5.5.2 5G and LTE-M
- 5.5.3 Satellite (GNSS, L-band)
- 5.6 By Geography
- 5.6.1 North America
- 5.6.1.1 United States
- 5.6.1.2 Canada
- 5.6.1.3 Mexico
- 5.6.2 South America
- 5.6.2.1 Brazil
- 5.6.2.2 Argentina
- 5.6.3 Europe
- 5.6.3.1 Germany
- 5.6.3.2 United Kingdom
- 5.6.3.3 France
- 5.6.3.4 Russia
- 5.6.3.5 Rest of Europe
- 5.6.4 APAC
- 5.6.4.1 China
- 5.6.4.2 Japan
- 5.6.4.3 India
- 5.6.4.4 Rest of APAC
- 5.6.5 Middle East and Africa
- 5.6.5.1 Saudi Arabia
- 5.6.5.2 United Arab Emirates
- 5.6.5.3 South Africa
- 5.6.5.4 Rest of Middle East and Africa
- 5.6.1 North America
6 COMPETITIVE LANDSCAPE
- 6.1 Market Concentration
- 6.2 Strategic Initiatives and Mergers and Acquisitions
- 6.3 Market Share Analysis
- 6.4 Company Profiles (includes global overview, market overview, core segments, financials, strategy, market rank/share, products and services, recent developments)
- 6.4.1 Siemens Corporation
- 6.4.2 Cisco Systems Inc.
- 6.4.3 IBM Corporation
- 6.4.4 SAP SE
- 6.4.5 AVEVA Group PLC
- 6.4.6 Thales Group
- 6.4.7 Huawei Technologies Co. Ltd.
- 6.4.8 Alstom SA
- 6.4.9 Kapsch TrafficCom AG
- 6.4.10 Hitachi Ltd.
- 6.4.11 Oracle Corporation
- 6.4.12 Advantech Co. Ltd.
- 6.4.13 Orange SA
- 6.4.14 TransCore LP
- 6.4.15 Cubic Transportation Systems
- 6.4.16 TomTom NV
- 6.4.17 Panasonic Holdings Corp.
- 6.4.18 Ericsson AB
- 6.4.19 Qualcomm Inc.
- 6.4.20 Continental AG
- 6.4.21 Iteris Inc.
- 6.4.22 PTV Group
7 MARKET OPPORTUNITIES AND FUTURE OUTLOOK
- 7.1 White-space and Unmet-Need Assessment
 智慧交通市场:按组件、自动驾驶等级、应用、终端用户产业和车辆类型划分-2026-2032年全球市场预测
 2026年全球5G汽车与智慧交通市场报告2026年全球智慧交通市场报告
 全球智慧交通市场规模、份额、趋势和成长分析报告(2026-2034)
 智慧交通市场-全球产业规模、份额、趋势、机会及预测(依应用、产品类型、地区及竞争格局划分,2021-2031年)
 2026-2030年全球智慧交通市场
 日本智慧交通市场规模、份额、趋势及预测(按解决方案和服务、交通方式、应用和地区划分),2026-2034年
 智慧交通市场规模、份额和成长分析(按交通方式、技术、连接技术、部署方式、应用、最终用户和地区划分)-2026-2033年产业预测
 全球智慧运输市场(2025-2030年):依技术、解决方案类型、运输方式、商业模式和车辆类型
 智慧交通市场机会、成长动力、产业趋势分析及 2025-2034 年预测