


 |
市场调查报告书
商品编码
1850028
智慧城市:市场占有率分析、产业趋势、统计数据和成长预测(2025-2030 年)Smart Cities - Market Share Analysis, Industry Trends & Statistics, Growth Forecasts (2025 - 2030) |
||||||
※ 本网页内容可能与最新版本有所差异。详细情况请与我们联繫。
预计2025年智慧城市市场规模将达到1.67兆美元,2030年将达到4.04兆美元。
强有力的政府奖励策略,特别是美国基础设施投资和就业法案以及每年为亚太地区城市数位化拨款 1580 亿美元,正在支持对整合移动性、公共工程、安全和公民服务的整合平台的需求。嵌入在物联网 (IoT) 网路中的人工智慧引擎将市政采购週期缩短至短短八个月,加快了试点计画的价值实现时间,并透过在施工前检验结果的数位双胞胎实现逐步扩展。继 2025 年 1 月宣布投资 5,000 亿美元的星际之门人工智慧基础设施之后,竞争动态愈演愈烈,西门子等基础设施巨头面临微软和Oracle等云端超大规模资料中心业者大规模企业的挑战。虽然硬体仍然是最大的成本块,但服务正在迅速扩展,因为城市领导者更喜欢承包集成和管理安全合同,而不是零碎的设备购买。
全球智慧城市市场趋势与洞察
政府对综合基础建设的投入快速增加
基础设施法案为供应商提供了稳定的收入来源。 《基础设施投资与就业法案》规定到 2026 年每年累计1 亿美元用于智慧社区技术,最初的提案征集吸引了 392 个市政府,平均申请金额为 154 万美元。国家工程组织估计,现代数位系统可以将资产寿命延长 30%,使智慧平台成为昂贵的混凝土替代品的可行替代方案。拉斯维加斯等城市透过使用基于物联网网路的自适应交通号誌灯每年可节省 100 万美元。美国能源局2024 财政年度 519.9 亿美元的预算专注于电网现代化和清洁能源劳动力计划,以加强城市层面的投资能力。多方面的资金投入减少了邻近计划的领先障碍,包括交通、能源和安全,并吸引了私人资本。
扩大人工智慧和物联网平台的采用
国家物联网战略建议统一标准,以消除碎片化,加速跨产业应用。新加坡的智慧型运输系统(ITS) 已透过基于即时分析的自适应交通号誌控制,将拥塞减少了 35%。边缘运算节点在本地处理感测器数据,随着智慧型终端的安装基数到 2030 年接近 5000 亿,这将缓解回程传输限制。 5G-Advanced 连线与 AIoT 应用相结合,可实现自动驾驶接驳车和预测性维护所必需的亚毫秒响应时间。这些功能将有助于建构一个透过单一资料架构连接交通、公共和紧急服务的整体城市平台。
初期维修和整合成本高
将旧建筑改造成智慧建筑,尤其是在多用户住宅中增加汽车充电基础设施,与新建筑相比,资本支出增加 15-25%。学术研究讨论了「5R」改装——居住、重建、重新运输、重新资本化和重新绿化——该框架将成本分摊到多个资产类别,但使市政预算复杂化。半导体短缺导致物联网组件的价格在 2024 年后上涨约 30%。联邦供应链审查证实了这一趋势,其中强调了地缘政治和气候变迁风险。将棕地(例如缅因州以前的造纸厂)改造成先进材料工厂有可能节省成本,但整合工作仍需要许多城市 IT 团队所缺乏的高级专业知识。由于不可预见的互通性问题,尝试零碎采购的计划报告超支 40-60%。
細項分析
2024年,智慧运输管理将占智慧城市市场总收入的18.2%,成为智慧城市市场最大的单一解决方案细分领域。例如,新加坡的自我调整讯号网路缩短了出行时间,并支援资料驱动型拥塞管理的可输出最佳实践。受欧洲能源前瞻性区域计画和北美微电网试点的推动,公用事业相关的智慧城市市场规模预计将成长最快,复合年增长率达19.2%。随着政府部门将人工智慧视讯、暖通空调优化和远端医疗整合到统一指挥平台,智慧安全、楼宇自动化和医疗保健领域的投资将稳步成长。
行动数据用于预测能源需求,公共感测器兼作环境监测器。正在尝试使用区块链检验身份的城市正在减少跨机构协作的延迟,并增加整合资料架构的采用。环境监测和废弃物收集工具的成长一直很缓慢,但预计到本世纪末,零废弃物强制规定和循环经济政策将重新引起人们的兴趣。
到2024年,硬体将占支出的42.5%,这反映了城市物联网的基础:感测器、网关和边缘运算。然而,由于市长要求承包整合以降低复杂部署的风险,服务支出的复合年增长率将达到19.7%。随着网路评估、资料管治和託管云端营运成为不可或缺的要素,智慧城市市场中越来越多的份额将倾向于服务。
供应链波动将持续推高零件成本,强化供应商透过多年合约摊提硬体成本的订阅模式。执行预测分析和数位孪生的软体平台将保持稳定的需求,但差异化将转向垂直专业知识和开放API套件,而不是千篇一律的仪表板。能够展示跨照明、行动和电网通讯协定互通性的供应商将获得更高的价格溢价。
区域分析
亚太地区将维持领先地位,2024年将占全球营收的31.7%,到2030年复合年增长率将达到20.3%。中国支持近800个试点城市,印度则获得美国、日本和韩国三个国家的资助。日本的「社会5.0」政策将机器人和人工智慧纳入区域振兴计划,并采用成本分摊方案,由零售商等间接受益者资助旅游服务。亚洲智慧城市大会强调了该地区向零碳港口和氢能走廊转型的重点,以平衡经济成长与脱碳。
在北美,计划持续扩张,每年获得1亿美元的联邦补贴,并得到私人企业积极推动5G建设的支持。拉斯维加斯的数据驱动主导倡议将逆行驾驶减少了90%,已成为北美基于结果的采购的典范。 「星际之门」基金将深化技术栈,承诺创造10万个新就业岗位,并为人工智慧密集型市政工作负载提供强大的运算能力。
在欧洲,永续性是欧盟计画的重中之重,该计画将能源盈余目标与严格的资料保护法结合,力争在2025年建成100个正能量区。 Syn.ikia初步试验已证实,数位双胞胎主导的设计可实现40%至60%的效率提升。来自私人资本的承诺,例如PATRIZIA的140亿欧元智慧城市基金,显示投资者对绿色维修和城市服务平台带来的长期现金流充满信心。在中东,专注于自动驾驶出行和电子政府的专案正在进行中,杜拜的目标是到2030年实现25%的自动驾驶出行。非洲和南美洲提供了新的机会,但资金限制和技能短缺限制了其应用的步伐。
其他福利:
- Excel 格式的市场预测 (ME) 表
- 3个月的分析师支持
目录
第一章 引言
- 研究假设和市场定义
- 调查范围
第二章调查方法
第三章执行摘要
第四章 市场状况
- 市场概况
- 市场驱动因素
- 政府对综合基础设施的资金投入激增
- 人工智慧和物联网平台的采用率不断提高
- 能源正向区域试行加速公用事业收费
- 数位双胞胎部署缩短市政采购週期
- 美国城市私有 CBRS 5G 频谱部署
- 气候适应力需求(洪水感测器、中暑风险仪表板)
- 市场限制
- 初期维修和整合成本高昂
- 网路安全和资料隐私问题
- 采购和互通性标准分散
- 新冠疫情后地方政府债务上限面临压力
- 供应链分析
- 监管格局
- 技术展望
- 波特五力分析
- 供应商的议价能力
- 买方的议价能力
- 新进入者的威胁
- 替代品的威胁
- 竞争对手之间的竞争
- 宏观经济趋势的市场评估
第五章市场规模及成长预测
- 按解决方案
- 智慧运输管理
- 智慧公共
- 智慧医疗
- 智慧建筑
- 智慧公用事业
- 智慧安全
- 其他的
- 按组件
- 硬体
- 软体
- 服务
- 按部署模型
- 云
- 本地部署
- 按最终用户
- 政府和地方政府
- 住宅
- 商业和工业
- 运输/物流
- 公共产业提供者
- 其他的
- 按地区
- 北美洲
- 美国
- 加拿大
- 墨西哥
- 南美洲
- 巴西
- 阿根廷
- 南美洲其他地区
- 欧洲
- 英国
- 德国
- 法国
- 瑞典
- 其他欧洲地区
- 亚太地区
- 中国
- 日本
- 印度
- 澳洲
- 韩国
- 其他亚太地区
- 中东和非洲
- 沙乌地阿拉伯
- 阿拉伯聯合大公国
- 土耳其
- 南非
- 其他中东和非洲地区
- 北美洲
第六章 竞争态势
- 市场集中度
- 策略趋势
- 市占率分析
- 公司简介
- ABB Ltd.
- Cisco Systems Inc.
- Emerson Electric Co.
- IBM Corporation
- Ericsson AB
- Schneider Electric SE
- General Electric Co.
- Siemens AG
- Huawei Technologies Co. Ltd.
- Honeywell International Inc.
- Hitachi Ltd.
- Nokia Corporation
- Koninklijke Philips NV
- Microsoft Corporation
- Oracle Corporation
- ATandT Inc.
- Intel Corporation
- NEC Corporation
- Bosch Security Systems
- Samsung Electronics Co., Ltd.
- Panasonic Corporation
- Verizon Communications Inc.
- Alibaba Group(AliCloud)
- Johnson Controls International plc
- SUEZ SA
- Thales Group
第七章 市场机会与未来展望
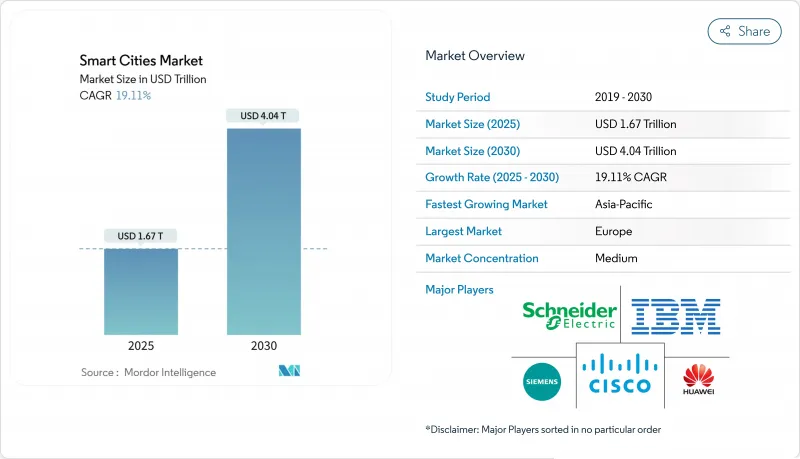
The smart cities market stood at USD 1.67 trillion in 2025 and is on course to reach USD 4.04 trillion by 2030, reflecting a 19.11% CAGR over the forecast window.
Robust government stimulus, especially the U.S. Infrastructure Investment and Jobs Act and annual Asia-Pacific allocations of USD 158 billion for urban digitization, is anchoring demand for integrated platforms that unite mobility, utilities, safety and citizen-service domains. Artificial-intelligence engines embedded in Internet-of-Things (IoT) networks have condensed municipal buying cycles to as little as eight months, accelerating time-to-value for pilot programs and enabling incremental scaling through digital twins that verify outcomes before construction. Competitive dynamics intensify as infrastructure stalwarts such as Siemens face cloud hyperscalers such as Microsoft and Oracle, following January 2025's USD 500 billion Stargate AI infrastructure announcement that signaled a multi-year race to supply compute, connectivity and applications for next-generation cities. Hardware still accounts for the largest cost block, but services are expanding faster as city leaders prefer turnkey integration and managed security contracts over piecemeal equipment purchases.
Global Smart Cities Market Trends and Insights
Surging Government Funding for Integrated Infrastructure
Infrastructure legislation is unlocking steady revenue streams for vendors. The Infrastructure Investment and Jobs Act budgets USD 100 million per year through 2026 for smart community technologies, with the first call attracting 392 municipal applications that averaged USD 1.54 million each. National engineering bodies estimate that modern digital systems can stretch asset life by as much as 30%, turning smart platforms into viable substitutes for costly concrete rebuilds. Cities like Las Vegas validated the model, saving USD 1 million annually via adaptive traffic signals that run on IoT networks. The U.S. Department of Energy's USD 51.99 billion FY 2024 budget earmarks grid modernization and clean-energy workforce programs, reinforcing city-level investment capacity. Collectively, multilevel funding reduces upfront barriers and crowds in private capital for adjacent projects across mobility, energy, and safety.
Rising Adoption of AI and IoT Platforms
National IoT strategies recommend uniform standards to fight fragmentation and accelerate cross-sector adoption. Singapore's Intelligent Transport System already cuts congestion by 35% through adaptive signal control informed by real-time analytics. Edge-computing nodes process sensor data locally, alleviating backhaul limits as the installed base of smart endpoints heads toward 500 billion by 2030. Marrying 5 G-Advanced connectivity with AIoT applications permits sub-millisecond response times essential for autonomous shuttles and predictive maintenance. These capabilities encourage holistic city platforms that interlink transport, utilities, and emergency services through one data fabric.
High Upfront Retrofit and Integration Costs
Bringing legacy buildings up to smart readiness inflates capital outlays by 15-25% versus new construction, particularly when adding vehicle-charging infrastructure to multi-family units. Academic studies discuss a "5R" retrofit framework: re-inhabitation, rebuilding, re-transportation, re-capitalisation, and re-greening that spreads costs across multiple asset classes but complicates municipal budgeting. Semiconductor shortages have raised IoT component prices by roughly 30% since 2024, a trend confirmed by federal supply-chain reviews highlighting geopolitical and climate-related risks. Repurposing brownfield sites such as a former Maine paper mill into advanced-materials plants shows cost-saving potential, yet integration tasks still demand premium expertise that many city IT teams lack. Projects that attempted piecemeal procurement report 40-60% overruns due to unforeseen interoperability issues.
Other drivers and restraints analyzed in the detailed report include:
- Energy-Positive District Pilots Accelerating Utilities Spend
- Digital-Twin Adoption Shortening Procurement Cycles
- Cyber-Security and Data-Privacy Concerns
For complete list of drivers and restraints, kindly check the Table Of Contents.
Segment Analysis
Smart mobility management secured 18.2% of 2024 revenue, making it the largest single solution line in the smart cities market. Singapore's adaptive-signal network, for example, has cut travel times and underpinned exportable best practices for data-driven congestion management. The smart cities market size associated with utilities is projected to grow fastest at a 19.2% CAGR due to energy-positive district ambitions in Europe and emerging microgrid pilots in North America. Smart safety, building automation and healthcare capture steady allocations as authorities integrate AI-video, HVAC optimisation and telehealth into consolidated command platforms.
Integration across solutions is rising: mobility data feeds energy demand forecasting, while public-safety sensors double as environmental monitors. Cities experimenting with blockchain-validated identities reduce latency in inter-agency collaboration, bolstering adoption of unified data fabrics. Although environmental monitoring and waste-collection tools grow more slowly, zero-waste mandates and circular-economy policies promise renewed interest by the decade's end.
Hardware retained 42.5% of 2024 spending, reflecting the sensor, gateway, and edge-compute foundation of any urban IoT installation. Yet services are advancing at a 19.7% CAGR as mayors seek turnkey integration to de-risk complex rollouts. The smart cities market share tilted toward services will widen as cyber assessments, data governance, and managed cloud operations become non-negotiable line items.
Supply-chain volatility continues to lift component costs, reinforcing subscription models where vendors amortise hardware over multi-year contracts. Software platforms that run predictive analytics and digital twins sustain steady demand, but differentiation shifts to vertical expertise and open-API toolkits rather than generic dashboards. Vendors able to certify interoperability across lighting, mobility, and grid protocols win premium pricing.
Smart City Market Report is Segmented by Solution (Smart Mobility Management, Smart Public Safety, and More), Component (Hardware, Software, and Services), Deployment Model (Cloud and On-Premises), End-User (Government and Municipal, Residential, and More), and by Geography. The Market Forecasts are Provided in Terms of Value (USD).
Geography Analysis
Asia-Pacific contributed 31.7% of 2024 revenue and will keep the lead with a 20.3% CAGR through 2030, as China supports nearly 800 pilot cities and India draws trilateral funding from the United States, Japan, and South Korea. Japan's Society 5.0 policy merges robotics and AI into regional revitalisation plans, using cost-sharing schemes where indirect beneficiaries such as retailers help fund mobility services. The Asia Smart City Conference underscores a regional pivot toward zero-carbon ports and hydrogen corridors that blend economic growth with decarbonisation goals.
North America continues to scale projects on the back of USD 100 million annual federal grants and aggressive private 5G build-outs. Las Vegas' data-driven policing initiative, which cut wrong-way driving by 90%, serves as a North American reference case for outcome-based procurement. The Stargate fund deepens the technology stack, promising 100,000 new jobs and vast compute capacity for AI-heavy municipal workloads.
Europe positions sustainability at the forefront, aiming for 100 Positive Energy Districts by 2025 under EU programs that marry energy surplus targets with stringent privacy laws. Syn.ikia pilots confirm 40-60% efficiency gains achievable through digital-twin-led design. Private-equity commitments such as PATRIZIA's EUR 14 billion smart-city fund validate investor confidence in long-run cash flows from green retrofits and urban-service platforms. Middle East programs emphasise autonomous mobility and e-government, with Dubai aiming for 25% self-driving journeys by 2030. Africa and South America present emerging opportunities, although fiscal constraints and skills shortages temper deployment speed.
- ABB Ltd.
- Cisco Systems Inc.
- Emerson Electric Co.
- IBM Corporation
- Ericsson AB
- Schneider Electric SE
- General Electric Co.
- Siemens AG
- Huawei Technologies Co. Ltd.
- Honeywell International Inc.
- Hitachi Ltd.
- Nokia Corporation
- Koninklijke Philips NV
- Microsoft Corporation
- Oracle Corporation
- ATandT Inc.
- Intel Corporation
- NEC Corporation
- Bosch Security Systems
- Samsung Electronics Co., Ltd.
- Panasonic Corporation
- Verizon Communications Inc.
- Alibaba Group (AliCloud)
- Johnson Controls International plc
- SUEZ SA
- Thales Group
Additional Benefits:
- The market estimate (ME) sheet in Excel format
- 3 months of analyst support
TABLE OF CONTENTS
1 INTRODUCTION
- 1.1 Study Assumptions and Market Definition
- 1.2 Scope of the Study
2 RESEARCH METHODOLOGY
3 EXECUTIVE SUMMARY
4 MARKET LANDSCAPE
- 4.1 Market Overview
- 4.2 Market Drivers
- 4.2.1 Surging government funding for integrated infrastructure
- 4.2.2 Rising adoption of AI and IoT platforms
- 4.2.3 Energy-positive district pilots accelerating utilities spend
- 4.2.4 Digital-twin adoption shortening municipal procurement cycles
- 4.2.5 Private-CBRS 5G spectrum deployments in U.S. cities
- 4.2.6 Climate-resilience mandates (flood sensors, heat-risk dashboards)
- 4.3 Market Restraints
- 4.3.1 High upfront retrofit and integration costs
- 4.3.2 Cyber-security and data-privacy concerns
- 4.3.3 Fragmented procurement and interoperability standards
- 4.3.4 Municipal debt-ceiling pressure post-COVID
- 4.4 Supply-Chain Analysis
- 4.5 Regulatory Landscape
- 4.6 Technological Outlook
- 4.7 Porter's Five Force Analysis
- 4.7.1 Bargaining Power of Suppliers
- 4.7.2 Bargaining Power of Buyers
- 4.7.3 Threat of New Entrants
- 4.7.4 Threat of Substitutes
- 4.7.5 Intensity of Competitive Rivalry
- 4.8 Assessment of Macroeconomic Trends on the Market
5 MARKET SIZE AND GROWTH FORECASTS (VALUE)
- 5.1 By Solution
- 5.1.1 Smart Mobility Management
- 5.1.2 Smart Public Safety
- 5.1.3 Smart Healthcare
- 5.1.4 Smart Building
- 5.1.5 Smart Utilities
- 5.1.6 Smart Security
- 5.1.7 Others
- 5.2 By Component
- 5.2.1 Hardware
- 5.2.2 Software
- 5.2.3 Services
- 5.3 By Deployment Model
- 5.3.1 Cloud
- 5.3.2 On-premise
- 5.4 By End-user
- 5.4.1 Government and Municipal
- 5.4.2 Residential
- 5.4.3 Commercial and Industrial
- 5.4.4 Transportation and Logistics
- 5.4.5 Utilities Providers
- 5.4.6 Other
- 5.5 By Geography
- 5.5.1 North America
- 5.5.1.1 United States
- 5.5.1.2 Canada
- 5.5.1.3 Mexico
- 5.5.2 South America
- 5.5.2.1 Brazil
- 5.5.2.2 Argentina
- 5.5.2.3 Rest of South America
- 5.5.3 Europe
- 5.5.3.1 United Kingdom
- 5.5.3.2 Germany
- 5.5.3.3 France
- 5.5.3.4 Sweden
- 5.5.3.5 Rest of Europe
- 5.5.4 Asia-Pacific
- 5.5.4.1 China
- 5.5.4.2 Japan
- 5.5.4.3 India
- 5.5.4.4 Australia
- 5.5.4.5 South Korea
- 5.5.4.6 Rest of Asia-Pacific
- 5.5.5 Middle East and Africa
- 5.5.5.1 Saudi Arabia
- 5.5.5.2 United Arab Emirates
- 5.5.5.3 Turkey
- 5.5.5.4 South Africa
- 5.5.5.5 Rest of Middle East and Africa
- 5.5.1 North America
6 COMPETITIVE LANDSCAPE
- 6.1 Market Concentration
- 6.2 Strategic Moves
- 6.3 Market Share Analysis
- 6.4 Company Profiles (includes Global level Overview, Market level overview, Core Segments, Financials as available, Strategic Information, Market Rank/Share for key companies, Products and Services, and Recent Developments)
- 6.4.1 ABB Ltd.
- 6.4.2 Cisco Systems Inc.
- 6.4.3 Emerson Electric Co.
- 6.4.4 IBM Corporation
- 6.4.5 Ericsson AB
- 6.4.6 Schneider Electric SE
- 6.4.7 General Electric Co.
- 6.4.8 Siemens AG
- 6.4.9 Huawei Technologies Co. Ltd.
- 6.4.10 Honeywell International Inc.
- 6.4.11 Hitachi Ltd.
- 6.4.12 Nokia Corporation
- 6.4.13 Koninklijke Philips NV
- 6.4.14 Microsoft Corporation
- 6.4.15 Oracle Corporation
- 6.4.16 ATandT Inc.
- 6.4.17 Intel Corporation
- 6.4.18 NEC Corporation
- 6.4.19 Bosch Security Systems
- 6.4.20 Samsung Electronics Co., Ltd.
- 6.4.21 Panasonic Corporation
- 6.4.22 Verizon Communications Inc.
- 6.4.23 Alibaba Group (AliCloud)
- 6.4.24 Johnson Controls International plc
- 6.4.25 SUEZ SA
- 6.4.26 Thales Group
7 MARKET OPPORTUNITIES AND FUTURE OUTLOOK
- 7.1 White-space and Unmet-need Assessment
 智慧城市市场分析与预测(至2035年):类型、产品类型、服务、技术、组件、应用、部署模式、最终用户、安装模式、解决方案
 智慧城市:连结公共空间 - 第四版
 2026-2030年全球智慧城市资讯通讯技术(ICT)基础建设市场
 全球智慧城市市场规模、份额、趋势和成长分析报告(2026-2034)
 日本智慧城市市场报告:按重点领域(智慧交通、智慧建筑、智慧公用设施、智慧市民服务)和地区划分 2026-2034 年
 智慧城市市场-全球产业规模、份额、趋势、机会和预测(按智慧公用事业、智慧管治、智慧交通、智慧市民服务、区域和竞争格局划分),2021-2031年
 智慧城市资讯通信技术基础设施市场(按组件、技术、应用和部署类型划分)—2026-2032年全球预测智慧球场解决方案市场按组件、部署类型、运动项目和最终用户划分 - 全球预测 2026-2032 年
 全球交通号誌智慧市场预测(至2032年),依号誌类型、部署模式、应用、最终用户及地区划分智慧城市市场-全球产业规模、份额、趋势、机会和预测,按组件、功能领域、地区和竞争格局划分,2020-2030年预测