


 |
市场调查报告书
商品编码
1850031
混合动力汽车:市场份额分析、行业趋势、统计数据和成长预测(2025-2030 年)Hybrid Vehicle - Market Share Analysis, Industry Trends & Statistics, Growth Forecasts (2025 - 2030) |
||||||
※ 本网页内容可能与最新版本有所差异。详细情况请与我们联繫。
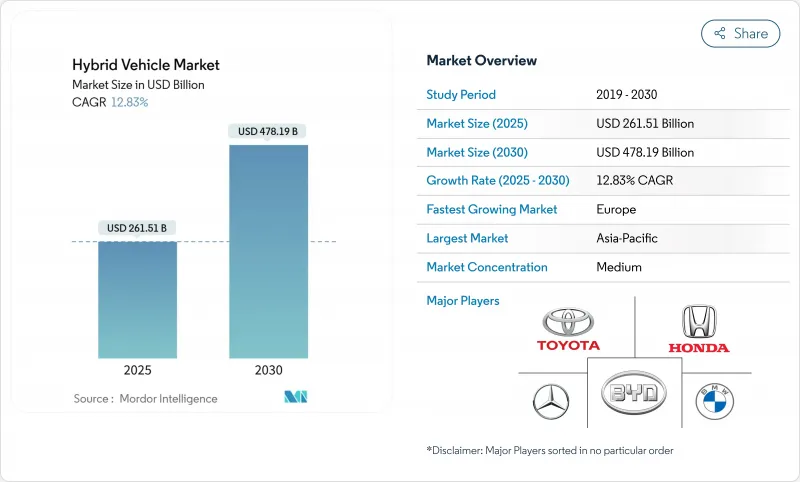
混合动力汽车市场预计到 2025 年将达到 2,615.1 亿美元,到 2030 年将达到 4,781.9 亿美元,复合年增长率为 12.83%。
在电气化政策快速推进、电池价格下降以及消费者对冲燃油波动的决心的推动下,所有主要地区的需求仍然保持强劲。汽车製造商将混合动力汽车视为利润引擎,以支持电池工厂的扩张;政策制定者也正在将混合动力汽车视为加强温室气体法规的实用合规工具。随着日本本土企业巩固领先地位、中国品牌拓展全球影响力以及西方汽车製造商携新的多路径规划重返市场,竞争日趋激烈。基础设施缺口、监管趋同以及投资组合风险管理等因素的共同作用,将确保混合动力汽车市场在未来十年保持战略重要性。
全球混合动力汽车市场趋势与洞察
更严格的全球 CAFE/GHG 标准和零排放要求
美国和欧盟将在2030年左右同步实施全系列车辆的排放上限,这将迫使汽车製造商采用混合动力汽车以避免处罚。美国环保署已设定2032年二氧化碳排放量为每英里85克的目标,而欧7标准引入了电池耐久性规则,该规则强烈支持成熟的混合动力化学技术。汽车製造商正在利用混合动力汽车动力汽车特有的合规灵活性,平稳过渡到纯电动,并为超级工厂腾出资本预算。澳洲和中国也拥有类似的政策架构,从而建立了协调一致的监管基础,这将提振全球混合动力汽车市场。
到 2027 年,PHEV 电池成本平价将达到临界点
随着锂离子电池组价格降至每千瓦时100美元,插电式混合动力汽车与传统车型之间的成本差距正在缩小。宁德时代2024款Freevoy模组可实现4C充电,纯电续航里程超过400公里,从而缓解了一度限制插电式混合动力车需求的矛盾。国际清洁交通委员会的分析师预测,到2030年,电池价格将降至每千瓦时80美元以下,这将支持新的价值提案,加速插电式混合动力汽车的普及,尤其是在中国和欧洲。
都市区车队实现了与纯电动车类似的总拥有成本
车库充电、低电费以及城市通行费减免,使得纯电动货车和计程车在交通密集的道路上营业成本低于混合动力汽车。交通与环境部门的一项研究发现,在巴黎,中型纯电动车的使用寿命比柴油车便宜14%。随着市政基础设施的成熟,混合动力汽车汽车市场的成长可能会放缓,因为购车者会逐渐放弃混合动力汽车,转而选择零废气排放的解决方案。
細項分析
到2025年,混合动力电动车将占据混合动力汽车市场的43.81%,并支撑主流乘用车销量。即使基础设施不断改善,在稳定的成本优势和久经考验的可靠性的推动下,需求仍将保持韧性。原始设备製造商将透过改进串并联架构和缩小内燃机尺寸来最大限度地提高合规积分。相较之下,插电式混合动力汽车的复合年增长率将达到13.82%,随着消费者逐渐发现纯电动通勤的价值,两者之间的差距正在缩小。预计2027年将实现成本平价,这将推动插电式混合动力车进入更广泛的价格分布,从而扩大其用户群。
随着能量密度的提升,价格预计将降至2.5万美元以下,从2028年起,混合动力电动车市场很可能迎来插电式混合动力车挑战其主导地位的局面。宁德时代的Freevoy电池组可在10分钟内充满电,续航里程可达280公里,消除了续航里程焦虑,并支持了该细分市场的快速成长。中国的税额扣抵和欧洲的实物福利减免等政策激励措施,正进一步推动插电式混合动力汽车的普及,确保两种技术的共存,而非快速被取代。
乘用车仍将是混合动力汽车市场的基石,到2024年将占混合动力汽车销量的78.04%。欧洲和日本对传统引擎征收的高额登记税将推动买家转向混合动力汽车,而美国消费者则将青睐省油的跨界车,例如混合动力汽车。市场区隔强调生活方式的最小改变和快速的投资回报,从而保持在全球最大轻型汽车细分市场的渗透率。
随着宅配、市政和公司车队寻求经济高效的脱碳方案,到2030年,轻型商用车的复合年增长率将达到15.23%。大众的Multivan eHybrid和福特的E-Transit Custom Hybrid展示了原始设备製造商如何根据车队营运週期客製化电池尺寸、负载容量和充电灵活性。混合动力汽车产业受益于企业ESG目标,这些目标要求在公共充电网路完全覆盖郊区和乡村路线之前实现具体的排放目标。
区域分析
受深厚的国内供应链、强有力的政策支持和强劲的消费者需求推动,亚太地区将在2024年保持41.24%的混合动力汽车市场份额。中国插电式混合动力车註册量在2022年至2024年间年均成长超过80%,将占据该地区混合动力车销量的大部分。光是比亚迪一家,到2024年就将出货近250万辆混合动力汽车,并已扩建本地电池工厂,以降低其东协出口计画的成本。日本主机厂将在国内维持量产,加速混合动力汽车向大洋洲的出口,进而强化良性生产循环,保障净利率。
欧洲是一个快速成长的地区,预计到2030年复合年增长率将达到14.95%。即使纯电动车激励措施有所缩减,该地区的燃油经济法规、拥塞费和公司车辆税收减免仍将鼓励混合动力汽车的普及。到2024年,混合动力汽车将占义大利新车构成比的40%,法国的充电桩汽车保有量已超过200万辆。儘管德国和英国的电动车份额创历史新高,但消费者正转向混合动力汽车,以获得远距的便利性。来自波兰、斯洛伐克和西班牙的供应线将吸引新的电池模组投资,缩短欧洲组装厂的物流时间,并维持成本下降的趋势,从而增强混合动力汽车市场。
在北美,到2024年,混合动力汽车的普及率将上升至轻型汽车销售的12.1%,各州的奖励各不相同。美国环保署2032年法规带来的监管确定性将鼓励皮卡和SUV更广泛地采用混合动力汽车,而到2024年油价的上涨将增强主流市场的接受度。南美洲、中东和非洲等新兴市场正依赖混合动力汽车来克服充电基础设施瓶颈。政府车队将试行混合动力公车和巡逻车,以证明其应用的可行性,并为商业化铺平道路,从而扩大全球混合动力汽车市场。
其他福利:
- Excel 格式的市场预测 (ME) 表
- 3个月的分析师支持
目录
第一章 引言
- 研究假设和市场定义
- 调查范围
第二章调查方法
第三章执行摘要
第四章 市场状况
- 市场概况
- 市场驱动因素
- 更严格的全球 CAFE/GHG 标准和零排放要求
- 2024年起燃料价格波动将加剧
- 2027 年 PHEV 电池成本将趋于一致
- OEM多路径碳策略(ICE+BEV+HEV)
- 轻型卡车48V架构的标准化(不明显)
- 灾害多发地区使用独立于电网的紧急电源的范例(不太明显的例子)
- 市场限制
- 实现都市区纯电动车总拥有成本平价
- 永续开采的镍和钴短缺
- 消费者对续航里程的焦虑偏见直接转移到了低调的纯电动车上
- 强制回收废弃镍氢电池组迫在眉睫(不引人注意)
- 价值/供应链分析
- 监管格局
- 技术展望
- 波特五力模型
- 供应商的议价能力
- 消费者议价能力
- 新进入者的威胁
- 替代品的威胁
- 竞争对手之间的竞争
第五章市场规模和成长预测(价值(美元)和数量(单位))
- 混合动力汽车型
- 轻度混合动力
- 混合动力电动车(HEV)
- 插电式混合动力车(PHEV)
- 按车辆类型
- 搭乘用车
- 轻型商用车
- 中型和重型商用车
- 依马达类型
- 永磁同步交流马达(PMSM)
- 感应(异步)AC马达
- 开关磁阻马达(SRM)
- 轴向电机
- 依电池类型
- 镍氢电池
- 磷酸锂铁电池
- 其他电池
- 按地区
- 北美洲
- 美国
- 加拿大
- 其他北美地区
- 南美洲
- 巴西
- 阿根廷
- 南美洲其他地区
- 欧洲
- 德国
- 英国
- 法国
- 义大利
- 挪威
- 荷兰
- 其他欧洲地区
- 亚太地区
- 中国
- 日本
- 印度
- 韩国
- 其他亚太地区
- 中东和非洲
- 阿拉伯聯合大公国
- 沙乌地阿拉伯
- 南非
- 土耳其
- 埃及
- 其他中东和非洲地区
- 北美洲
第六章 竞争态势
- 市场集中度
- 策略趋势
- 市占率分析
- 公司简介
- Toyota Motor Corporation
- Honda Motor Co., Ltd.
- Nissan Motor Co., Ltd.
- Hyundai Motor Company
- Kia Corporation
- Ford Motor Company
- General Motors Company
- Stellantis NV
- BMW AG
- Mercedes-Benz Group AG
- Volkswagen AG
- BYD Co., Ltd.
- SAIC Motor Corporation
- Geely Automobile Holdings Ltd.
- Renault SA
- Volvo Car AB
- Subaru Corporation
- Mazda Motor Corporation
- Mitsubishi Motors Corporation
第七章 市场机会与未来展望
The hybrid vehicle market size holds a value of USD 261.51 billion in 2025 and is forecast to reach USD 478.19 billion by 2030, advancing at 12.83% CAGR.
Rapid electrification policies, falling battery prices, and consumer determination to hedge against fuel volatility keep demand resilient across every major region. Automakers treat hybrids as profit engines that bankroll the scale-up of battery plants, while policymakers accept them as a practical compliance tool for tougher greenhouse-gas limits. Competitive intensity is escalating as Japanese incumbents fortify their lead, Chinese brands widen global reach, and Western OEMs re-enter the fray with new multi-pathway plans. Infrastructure disparities, regulatory convergence, and portfolio risk management together ensure the hybrid vehicle market remains strategically relevant for the next decade.
Global Hybrid Vehicle Market Trends and Insights
Stricter Global CAFE/GHG Norms & Zero-Emission Mandates
Fleetwide emissions ceilings in the United States and the European Union synchronize around the 2030 horizon, compelling automakers to employ hybrids to avoid penalties. The US Environmental Protection Agency sets targets of 85 g CO2 / mile for 2032, while Euro 7 introduces battery-durability rules that strongly favor mature hybrid chemistries. Automakers exploit the compliance flexibility inherent in hybrids to smooth the transition to full electrification, thereby safeguarding capital budgets earmarked for gigafactories. Similar policy architecture appears in Australia and China, creating a coherent regulatory scaffolding that lifts the global hybrid vehicle market.
Battery Cost-Parity Tipping Point for PHEVs by 2027
Lithium-ion pack prices slide toward USD 100 /kWh, narrowing the cost delta between plug-in hybrids and conventional models. CATL's 2024 Freevoy module delivers 4C charging and over 400 km electric-only range, slashing perceived compromises that once capped PHEV demand. Analysts at the International Council on Clean Transportation expect sub-USD 80 /kWh by 2030, anchoring a renewed value proposition that accelerates PHEV adoption, especially in China and Europe.
BEV Total-Cost-of-Ownership Parity Achieved in Urban Fleets
Depot charging, low electricity tariffs, and city toll exemptions allow battery-electric vans and taxis to undercut hybrid operating costs in dense corridors. Studies by Transport & Environment find medium BEVs 14% cheaper than diesel equivalents on a lifetime basis in Paris. As municipal infrastructure matures, fleet buyers may bypass hybrids in favor of zero-tailpipe solutions, trimming incremental growth in the hybrid vehicle market .
Other drivers and restraints analyzed in the detailed report include:
- Soaring Fuel-Price Volatility Post-2024
- OEM Multi-Pathway Carbon Strategies
- Scarcity of Sustainably Mined Nickel & Cobalt
For complete list of drivers and restraints, kindly check the Table Of Contents.
Segment Analysis
Hybrid electric vehicle account for 43.81% of the hybrid vehicle market, anchoring volume for mainstream passenger cars in 2025. Steady cost advantages and proven reliability keep demand resilient even as infrastructure improves. OEMs refine series-parallel architectures and downsize internal-combustion engines to maximize compliance credits. In contrast, plug-in hybrids record a 13.82% CAGR, closing the gap as buyers value electric-only commuting. Cost-parity milestones forecast for 2027 push PHEVs into wider price bands, broadening shopper appeal.
The hybrid electric vehicle market is likely to see plug-in variants challenge hybrid electric vehicle primacy after 2028 as energy-density gains permit sub-USD 25,000 sticker prices. CATL's Freevoy pack allows 10-minute top-ups that unlock 280 km of range, neutralizing range anxiety and underpinning the segment surge. Policy sweeteners such as China's tax credits and Europe's benefit-in-kind relief further tilt fleets toward PHEVs, ensuring technology coexistence rather than rapid displacement.
Passenger cars remain the bedrock of the hybrid vehicle market, controlling 78.04% revenue in 2024. High registration taxes on conventional engines in Europe and Japan funnel buyers into hybrids, while US consumers gravitate to fuel-efficient crossovers such as the hybrid-only 2025 Camry. OEM marketing stresses minimal lifestyle changes and quick payback, sustaining penetration in the world's largest light-vehicle segments.
Light commercial vehicles grow at 15.23% CAGR through 2030 as parcel-delivery, municipal, and trades fleets search for cost-effective decarbonization. Volkswagen's Multivan eHybrid and Ford's E-Transit Custom Hybrid illustrate how OEMs tailor battery size, payload, and charging flexibility for fleet duty cycles. The hybrid vehicle industry benefits from corporate ESG targets that require tangible emissions cuts before public charging networks fully saturate suburban and rural routes.
The Hybrid Vehicle Market Report is Segmented by Propulsion Type (Hybrid Electric Vehicle (HEV), Plug-In Hybrid (PHEV), and More), Vehicle Type (Passenger Cars, Light Commercial Vehicles, and More), Motor Type (Permanent Magnet Synchronous AC Motor (PMSM), Induction AC Motor, and More), Battery Type (Nickel-Metal Hydride, and More), and Geography. The Market Forecasts are Provided in Terms of Value (USD) and Volume (Units).
Geography Analysis
Asia-Pacific retains 41.24% of the hybrid vehicle market share in 2024 on the back of deep domestic supply chains, powerful policy support, and vibrant consumer demand. China accounts for most regional volume after plug-in hybrid registrations soared more than 80% annually between 2022 and 2024. BYD alone shifted nearly 2.5 million hybrids in 2024, scaling local battery plants that lower costs across ASEAN export programs. Japanese OEMs maintain hefty volumes at home and accelerate hybrid exports to Oceania, reinforcing a virtuous production loop that protects margins.
Europe is the fastest-growing geography with a projected 14.95% CAGR to 2030. The region's fuel-economy penalties, congestion charges, and company-car tax reliefs propel hybrid adoption even as BEV incentives taper. Italy's new-car mix hit 40% hybrids in 2024, and France passed 2 million rechargeable vehicles. Germany and the United Kingdom posted record electric-mobility shares, yet consumers still migrate to hybrids for long-distance convenience. Supply lines from Poland, Slovakia, and Spain attract fresh battery-module investment, shortening logistics for European assembly plants and sustaining downward cost curves that strengthen the hybrid vehicle market.
North America shows divergent provincial and state incentives, but national hybrid penetration climbed to 12.1% of light-vehicle sales in 2024. Regulatory certainty through the EPA's 2032 rule set catalyses broader model coverage across pickups and SUVs, while gasoline price spikes during 2024 cement mainstream acceptance. Emerging markets in South America, the Middle East and Africa rely on hybrids to leapfrog charging-infrastructure bottlenecks. Government fleets pilot hybrid buses and patrol vehicles, demonstrating use-case viability and paving the way for commercial uptake that enlarges the global hybrid vehicle market.
- Toyota Motor Corporation
- Honda Motor Co., Ltd.
- Nissan Motor Co., Ltd.
- Hyundai Motor Company
- Kia Corporation
- Ford Motor Company
- General Motors Company
- Stellantis N.V.
- BMW AG
- Mercedes-Benz Group AG
- Volkswagen AG
- BYD Co., Ltd.
- SAIC Motor Corporation
- Geely Automobile Holdings Ltd.
- Renault S.A.
- Volvo Car AB
- Subaru Corporation
- Mazda Motor Corporation
- Mitsubishi Motors Corporation
Additional Benefits:
- The market estimate (ME) sheet in Excel format
- 3 months of analyst support
TABLE OF CONTENTS
1 Introduction
- 1.1 Study Assumptions & Market Definition
- 1.2 Scope of the Study
2 Research Methodology
3 Executive Summary
4 Market Landscape
- 4.1 Market Overview
- 4.2 Market Drivers
- 4.2.1 Stricter global CAFE/GHG norms & zero-emission mandates
- 4.2.2 Soaring fuel-price volatility post-2024
- 4.2.3 Battery cost-parity tipping point for PHEVs by 2027
- 4.2.4 OEM multi-pathway carbon strategies (ICE + BEV + HEV)
- 4.2.5 48-V architecture standardisation in light trucks (under-the-radar)
- 4.2.6 Grid-independent emergency-power use case in disaster-prone regions (under-the-radar)
- 4.3 Market Restraints
- 4.3.1 BEV total-cost-of-ownership parity achieved in urban fleets
- 4.3.2 Scarcity of sustainably mined nickel & cobalt
- 4.3.3 Consumer range-anxiety bias shifting straight to BEV (under-the-radar)
- 4.3.4 Looming end-of-life recycling liabilities for NiMH packs (under-the-radar)
- 4.4 Value / Supply-Chain Analysis
- 4.5 Regulatory Landscape
- 4.6 Technological Outlook
- 4.7 Porter's Five Forces
- 4.7.1 Bargaining Power of Suppliers
- 4.7.2 Bargaining Power of Consumers
- 4.7.3 Threat of New Entrants
- 4.7.4 Threat of Substitute Products
- 4.7.5 Intensity of Competitive Rivalry
5 Market Size & Growth Forecasts (Value (USD) and Volume (Units))
- 5.1 By Hybrid Vehicle Type
- 5.1.1 Mild-Hybrid
- 5.1.2 Hybrid Electric Vehicle (HEV)
- 5.1.3 Plug-in Hybrid (PHEV)
- 5.2 By Vehicle Type
- 5.2.1 Passenger Cars
- 5.2.2 Light Commercial Vehicles
- 5.2.3 Medium and Heavy Commercial Vehicles
- 5.3 By Motor Type
- 5.3.1 Permanent Magnet Synchronous AC Motor (PMSM)
- 5.3.2 Induction (Asynchronous) AC Motor
- 5.3.3 Switched Reluctance Motor (SRM)
- 5.3.4 Axial-Flux Motor
- 5.4 By Battery Type
- 5.4.1 Nickel-Metal Hydride
- 5.4.2 Lithium-iron Phosphate Battery
- 5.4.3 Other Battery
- 5.5 By Geography
- 5.5.1 North America
- 5.5.1.1 United States
- 5.5.1.2 Canada
- 5.5.1.3 Rest of North America
- 5.5.2 South America
- 5.5.2.1 Brazil
- 5.5.2.2 Argentina
- 5.5.2.3 Rest of South America
- 5.5.3 Europe
- 5.5.3.1 Germany
- 5.5.3.2 United Kingdom
- 5.5.3.3 France
- 5.5.3.4 Italy
- 5.5.3.5 Norway
- 5.5.3.6 Netherlands
- 5.5.3.7 Rest of Europe
- 5.5.4 Asia-Pacific
- 5.5.4.1 China
- 5.5.4.2 Japan
- 5.5.4.3 India
- 5.5.4.4 South Korea
- 5.5.4.5 Rest of Asia-Pacific
- 5.5.5 Middle East and Africa
- 5.5.5.1 United Arab Emirates
- 5.5.5.2 Saudi Arabia
- 5.5.5.3 South Africa
- 5.5.5.4 Turkey
- 5.5.5.5 Egypt
- 5.5.5.6 Rest of Middle East and Africa
- 5.5.1 North America
6 Competitive Landscape
- 6.1 Market Concentration
- 6.2 Strategic Moves
- 6.3 Market Share Analysis
- 6.4 Company Profiles (Includes Global Level Overview, Market Level Overview, Core Segments, Financials as Available, Strategic Information, Market Rank/Share, Products & Services, Recent Developments)
- 6.4.1 Toyota Motor Corporation
- 6.4.2 Honda Motor Co., Ltd.
- 6.4.3 Nissan Motor Co., Ltd.
- 6.4.4 Hyundai Motor Company
- 6.4.5 Kia Corporation
- 6.4.6 Ford Motor Company
- 6.4.7 General Motors Company
- 6.4.8 Stellantis N.V.
- 6.4.9 BMW AG
- 6.4.10 Mercedes-Benz Group AG
- 6.4.11 Volkswagen AG
- 6.4.12 BYD Co., Ltd.
- 6.4.13 SAIC Motor Corporation
- 6.4.14 Geely Automobile Holdings Ltd.
- 6.4.15 Renault S.A.
- 6.4.16 Volvo Car AB
- 6.4.17 Subaru Corporation
- 6.4.18 Mazda Motor Corporation
- 6.4.19 Mitsubishi Motors Corporation
7 Market Opportunities & Future Outlook
- 7.1 White-space & Unmet-Need Assessment
 微型混合动力汽车市场(按车辆类型、燃料类型、零件类型、额定功率、最终用途和销售管道划分)—2025-2032 年全球预测混合动力汽车市场按类型、组件、混合动力等级和应用划分-2025-2032年全球预测混合动力汽车市场(按车型、动力传动系统类型和最终用户划分)—2025-2032 年全球预测
 全球混合动力汽车市场研究报告 - 产业分析、规模、份额、成长、趋势及 2025 年至 2033 年预测
 2032 年高压混合动力汽车市场预测:按车辆类型、推进类型、动力传动系统类型、零件、传动系统、销售管道和地区进行的全球分析
 混合动力汽车市场分析及预测(至2034年):类型、产品、技术、零件、应用、材料类型、部署、最终用户、功能、安装类型混合动力汽车市场:按混合动力类型、车辆类型和地区划分
 印度混合动力汽车市场:市场占有率分析、行业趋势和统计数据、成长预测(2025-2030 年)
 全球混合动力汽车市场:成长、未来展望与竞争分析(2025-2033 年)
 混合动力汽车市场规模、份额和成长分析(按组件、电动动力传动系统、混合程度、推进方式、车辆类型和地区):产业预测(2024-2031)