


 |
市场调查报告书
商品编码
1850128
农业接种剂:市场占有率分析、产业趋势、统计数据和成长预测(2025-2030 年)Agricultural Inoculants - Market Share Analysis, Industry Trends & Statistics, Growth Forecasts (2025 - 2030) |
||||||
※ 本网页内容可能与最新版本有所差异。详细情况请与我们联繫。
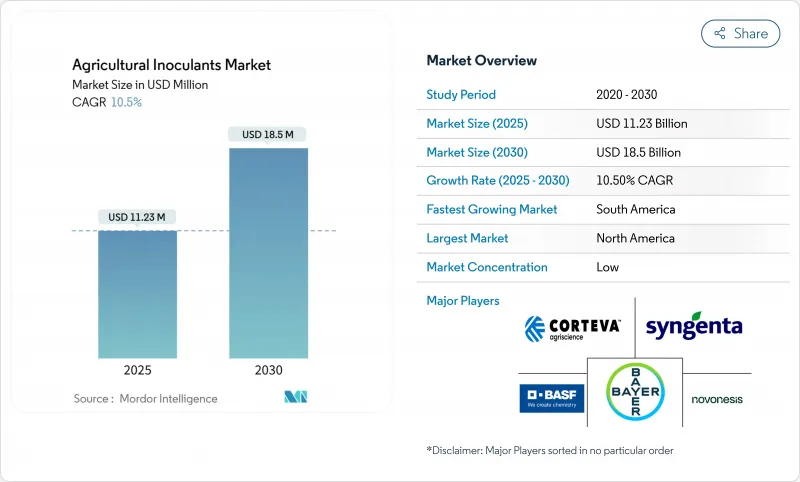
预计到 2025 年,农业接种剂市场价值将达到 112.3 亿美元,到 2030 年将达到 185 亿美元,复合年增长率为 10.5%。
这些因素包括:旨在遏制合成肥料排放的政策压力日益增大;旨在奖励生物固氮的碳信用奖励力度加大;以及消费者对符合永续性增长。随着农民认识到生物製剂能够带来可衡量的产量稳定性和土壤健康改善,该行业已从一种小众生物投入品转型为主流作物管理工具。供应商透过符合永续发展目标的优质多菌株配方获得可观的利润,同时降低了种植者的养分成本。大量资本流入进一步巩固了这一上升趋势。微生物包埋和人工智慧引导应用系统领域的资金筹措正在迅速成长,为新兴企业提供了将差异化技术商业化的资源。同时,现有企业正在加速研发下一代递送方法,以延长微生物的存活时间并简化农场使用。这种创新与整合的双轨发展轨迹表明,随着价值从单一菌株的商品产品转向能够提供检验农艺效果的综合生物平台,市场有望持续扩张。
全球农业接种剂市场趋势与洞察
转向有机认证标准
零售商和消费者如今都要求产品不含农药,这为符合严格有机标准的投入品创造了庞大的市场。欧盟的「从农场到餐桌」策略旨在到2030年将化学农药的使用量减少50%,该战略加速了微生物接种剂在欧盟范围内的应用。美国农业部(USDA)的国家有机计划法规已更新,明确了可接受的微生物生产规范,从而降低了买家的不确定性,并支持了供应商的投资。有机产品20%至40%的溢价证明了生物接种剂高昂的初始成本是合理的。然而,缺乏专业仓储和处理基础设施的小型生产商在整个供应链中维持认证面临许多挑战。
耕地面积减少和粮食安全压力
全球人均耕地面积已从1970年的0.38公顷下降到2020年的0.19公顷,导致人们更重视提高产量而非扩大耕地面积。在亚太地区,快速的都市化加剧了这种压力。田间研究表明,微生物接种剂可透过改善养分循环和土壤结构,即使在低产土壤中也能将产量提高4.8%至6.2%。在土地价格超过每公顷1万美元的地区,生物投入物为提高产量提供了经济有效的途径。由于能源市场供应紧张导致化肥价格波动,这一优势更加凸显。
农民意识不足以及农场操作的复杂性
许多农民缺乏微生物储存、活性检测和施用时间的培训。推广人员往往专注于化学肥料和农药,导致他们在生物肥料方面知识匮乏。因此,产品处理不当会导致效果不稳定,并引发消费者的质疑。巴西的「根瘤破碎」技术,即从根瘤中培养根瘤菌,显示基层创新可以弥合推广方面的差距,降低推广应用的门槛。
细分市场分析
到2024年,作物营养应用将占总收入的52%,因为固氮和溶磷微生物将部分取代合成肥料。随着化肥成本上涨推动生物替代,营养领域农业接种剂的市场规模预计将稳定扩大。农民表示,他们可以在保持产量的同时节省15-25%的氮肥投入,这意味着更快的投资回收期。
儘管作物保护生物製药的市占率贡献较小,但到2030年,其复合年增长率将达到10.9%。推动市场需求成长的因素包括:政府对化学农药的监管力度加大,以及主要病原体抗药性问题的日益严重。目前,各公司正将微生物保护剂与营养物质捆绑销售,承诺提供从土壤到叶片的全面覆盖。这种融合趋势迫使独立营养物质生产商拓展产品线,否则将面临市场份额被整合型产品蚕食的风险。
到2024年,细菌将占据农业接种剂市场71%的份额,这反映了根瘤菌在豆类作物中数十年的成功应用及其在谷类中日益广泛的应用。其领先地位归功于其已充分证实的功效、低成本以及监管机构的熟悉程度。
真菌是成长最快的生物类群,预计到2030年将以11.5%的复合年增长率成长。木霉属和菌根真菌在抑制病害和吸收磷方面日益受到核准。儘管细菌类生物製剂仍保持着规模优势,但真菌类创新企业凭藉其卓越的抗逆性优势正吸引投资。
区域分析
2024年,北美地区仍保持最大的区域市场份额,这得益于其强大的研发活动和完善的投入品分销网络。该地区到2030年的复合年增长率为6.9%,低于全球平均水平,因为许多种植者对生物肥料的可靠性缺乏信心,认为其无法与合成肥料相提并论。监管途径正在逐步完善,美国环保署近期对芽孢桿菌和木霉菌株的豁免缩短了新产品的上市时间。持续进行农民教育以及碳信用额度的整合有望推动玉米带和草原省份地区对生物肥料的采用。
南美洲是成长最快的地区,复合年增长率达10.4%。巴西国家生物投入品计画累计在2023-24年度将创造50亿雷亚尔(10亿美元)的销售额,年增15%。阿根廷成熟的大豆接种基础设施与巴西积极推进的新作物种植计画相辅相成,共同打造了覆盖整个南美洲的生物投入热点。跨国公司正在深化与当地企业的合作,以确保获得监管支持和生产能力,例如ICL收购Nitro 1000以及FMC与Ballagro的合作。
亚太和非洲蕴藏新的商机,其复合年增长率分别高达9.8%和8.3%。中国已註册超过550种微生物农药产品,展现出强劲的监管动能;印度中央杀虫剂委员会已核准416种生物製药,预计到2024年初即可上市。在非洲,诸如农场根瘤菌繁殖等适合小农户的种植方式可以规避低温运输限制,但更广泛的市场发展取决于能否获得推广支持和接种剂施用设施的资金。
其他福利:
- Excel格式的市场预测(ME)表
- 3个月的分析师支持
目录
第一章 引言
- 研究假设和市场定义
- 调查范围
第二章调查方法
第三章执行摘要
第四章 市场情势
- 市场概览
- 市场驱动因素
- 向有机认证标准过渡
- 耕地减少和粮食安全压力
- 调整政府化肥补贴结构,转向生物投入品
- 种子应用生物学联盟的快速扩张
- 对微生物封装技术的创投
- 将生物固氮的碳信用货币化
- 市场限制
- 农民意识不足以及农场操作的复杂性
- 偏好速效合成肥料
- 微生物混合物监管中的灰色地带
- 延伸供应链中的生物污染风险
- 监管环境
- 技术展望
- 波特五力分析
- 供应商的议价能力
- 买方的议价能力
- 新进入者的威胁
- 替代品的威胁
- 竞争对手之间的竞争
第五章 市场规模与成长预测
- 按功能
- 作物营养
- 作物保护
- 微生物
- 细菌
- 根际细菌
- 固氮菌
- 磷酸化细菌
- 其他细菌
- 真菌
- 木霉
- 菌根
- 其他真菌
- 其他微生物
- 细菌
- 使用方法
- 种子接种
- 土壤接种
- 按作物类型
- 粮食
- 豆类和油籽
- 经济作物
- 水果和蔬菜
- 其他用途
- 按地区
- 北美洲
- 美国
- 加拿大
- 墨西哥
- 北美其他地区
- 欧洲
- 德国
- 英国
- 法国
- 西班牙
- 义大利
- 俄罗斯
- 其他欧洲地区
- 亚太地区
- 中国
- 日本
- 印度
- 澳洲
- 亚太其他地区
- 南美洲
- 巴西
- 阿根廷
- 其他南美洲
- 中东
- 沙乌地阿拉伯
- 阿拉伯聯合大公国
- 其他中东地区
- 非洲
- 南非
- 肯亚
- 其他非洲地区
- 北美洲
第六章 竞争情势
- 市场集中度
- 策略趋势
- 市占率分析
- 公司简介
- BASF SE
- Novonesis(Novozymes A/S)
- Corteva Agriscience
- Premier Tech Ltd.
- Lallemand Inc.
- Lesaffre-Agrauxine(Lesaffre Group)
- Bioceres Crop Solutions Corp.
- Verdesian Life Sciences(AEA Investors)
- Mapleton Agri Biotec
- New Edge Microbials
- T. Stanes and Company(Amalgamations Group)
- Valent BioSciences(Sumitomo Chemical)
- Bayer AG
- Syngenta AG(ChemChina)
第七章 市场机会与未来展望
The agricultural inoculants market is valued at USD 11.23 billion in 2025 and is projected to reach USD 18.50 billion by 2030, reflecting a 10.5% CAGR.
Growth now rests on these converging forces: mounting policy pressure to curb synthetic fertilizer emissions, stronger carbon-credit incentives that reward biological nitrogen fixation, and rising retail demand for residue-free food that meets tightening organic standards. The sector has moved from niche biological inputs toward mainstream crop-management tools as farmers recognize measurable yield stability and soil health gains. Suppliers capture attractive margins through premium, multi-strain formulations that align with sustainability targets while lowering nutrient costs for growers. Key capital inflows reinforce the uptrend. Venture funding in microbial encapsulation and AI-guided application systems is scaling quickly, giving start-ups the resources to commercialize differentiated technologies. At the same time, incumbents accelerate research and development in next-generation delivery methods that extend microbial viability and simplify on-farm use. This dual track of innovation and consolidation signals a market poised for continued expansion as value shifts from commodity single-strain products to integrated biological platforms that deliver verifiable agronomic outcomes.
Global Agricultural Inoculants Market Trends and Insights
Shift toward organic certification standards
Retailers and consumers now demand residue-free produce, creating a sizable market for inputs that meet strict organic standards. The European Union's Farm to Fork strategy, aiming for a 50% cut in chemical pesticide use by 2030, accelerated microbial adoption across the bloc. Updated USDA National Organic Program rules clarify acceptable microbial production practices, reducing buyer uncertainty and supporting supplier investment. Organic price premiums ranging from 20% to 40% justify higher upfront costs for biological inoculants. Nevertheless, smaller growers without specialized storage and handling infrastructure face hurdles in maintaining certification throughout the supply chain.
Shrinking arable land and food-security pressures
Global arable land per capita fell from 0.38 ha in 1970 to 0.19 ha in 2020, sharpening the focus on yield intensification rather than land expansion. In Asia-Pacific, rapid urbanization amplifies this pressure. Field studies show microbial inoculants can raise yields 4.8-6.2% in low-productivity soils by improving nutrient cycling and soil structure. For regions where land prices exceed USD 10,000 per hectare, biological inputs offer a cost-effective intensification pathway. The benefit grows as synthetic fertilizer prices remain volatile due to energy-market tightness.
Farmer awareness gaps and on-farm handling complexity
Many farmers lack training on microbial storage, viability testing, and application timing. Extension agents often focus on fertilizers and pesticides, leaving a knowledge gap for biologicals. As a result, product mishandling leads to inconsistent performance and skepticism. Brazil's "nodule crushing" technique, which lets growers propagate rhizobia from root nodules, shows that grassroots innovation can fill extension gaps and lower adoption barriers.
Other drivers and restraints analyzed in the detailed report include:
- Rapid expansion of seed-applied biological consortia
- Venture investment in encapsulation tech for microbes
- Preference for fast-response synthetic fertilizers
For complete list of drivers and restraints, kindly check the Table Of Contents.
Segment Analysis
Crop nutrition applications captured 52% of 2024 revenue as nitrogen-fixing and phosphorus-solubilizing microbes replaced portions of synthetic fertilizers. The agricultural inoculants market size for nutrition is projected to expand steadily as rising fertilizer costs encourage biological substitution. Farmers appreciate documented savings of 15-25% on nitrogen inputs while maintaining yields, which translates into rapid payback periods.
Crop protection biologicals, while contributing a smaller base, are set for a 10.9% CAGR through 2030. Regulatory crackdowns on chemical pesticides and a surge in resistance issues among major pathogens are accelerating demand. Companies now bundle microbial protectants with nutritional strains, promising holistic soil-to-leaf coverage. This convergence pressures standalone nutrition providers to broaden portfolios or risk losing share to integrated offerings.
Bacteria held 71% of the agricultural inoculants market share in 2024, reflecting decades of rhizobia success in legumes and growing use in cereals. This leadership rests on well-documented efficacy, low cost, and familiarity among regulators.
Fungi are the fastest-growing group, projected at an 11.5% CAGR to 2030. Trichoderma and mycorrhiza strains gain traction for disease suppression and phosphorus uptake. Advances in encapsulation enhance shelf stability, while recent EPA tolerance exemptions smooth approvals. Although bacterial incumbents retain scale advantages, fungal innovators attract investment for premium stress-mitigation benefits.
The Agricultural Inoculants Market Report is Segmented by Function (Crop Nutrition and Crop Protection), Microorganism (Bacteria, Fungi, and Other Microorganisms), Mode of Application (Seed Inoculation and Soil Inoculation), Crop Type (Grains and Cereals, Pulses and Oilseeds, and More), and Geography (North America, South America, Europe, Asia-Pacific, and More). The Market Forecasts are Provided in Terms of Value (USD).
Geography Analysis
North America maintained the largest regional share in 2024, supported by robust research and development activity and well-established ag-input distribution networks. The region's 6.9% CAGR to 2030 trails the global average because many growers remain unconvinced that biologicals can match the reliability of synthetic fertilizers. Regulatory pathways are gradually improving, and recent EPA exemptions for Bacillus and Trichoderma strains shorten the time to market for new products. Continued farmer education and carbon-credit integration could lift adoption across the Corn Belt and Prairie Provinces.
South America is the fastest-growing region with a 10.4% CAGR. Brazil's National Bio-inputs Program generated BRL 5 billion (USD 1 billion) in sales in the 2023-24 season, up 15%, underscoring strong policy support. Argentina's mature soybean inoculation infrastructure complements Brazil's aggressive new-crop initiatives, creating a continent-wide hotspot. Multinational firms are deepening local partnerships, as shown by ICL's acquisition of Nitro 1000 and FMC's pact with Ballagro, to secure regulatory footholds and production capacity.
Asia-Pacific and Africa present emerging opportunities, growing at 9.8% and 8.3% CAGRs, respectively. China's registration of over 550 microbial pesticide products shows regulatory momentum, while India's Central Insecticides Board approved 416 biologic agendas in early 2024. In Africa, smallholder-friendly approaches such as on-farm rhizobia propagation bypass cold-chain constraints, but broader market development still depends on extension support and finance access for inoculant application equipment.
- BASF SE
- Novonesis (Novozymes A/S)
- Corteva Agriscience
- Premier Tech Ltd.
- Lallemand Inc.
- Lesaffre - Agrauxine (Lesaffre Group)
- Bioceres Crop Solutions Corp.
- Verdesian Life Sciences (AEA Investors)
- Mapleton Agri Biotec
- New Edge Microbials
- T. Stanes and Company (Amalgamations Group)
- Valent BioSciences (Sumitomo Chemical)
- Bayer AG
- Syngenta AG (ChemChina)
Additional Benefits:
- The market estimate (ME) sheet in Excel format
- 3 months of analyst support
TABLE OF CONTENTS
1 Introduction
- 1.1 Study Assumptions and Market Definition
- 1.2 Scope of the Study
2 Research Methodology
3 Executive Summary
4 Market Landscape
- 4.1 Market Overview
- 4.2 Market Drivers
- 4.2.1 Shift toward organic certification standards
- 4.2.2 Shrinking arable land and food-security pressures
- 4.2.3 Government fertilizer subsidy realignment toward bio-inputs
- 4.2.4 Rapid expansion of seed-applied biological consortia
- 4.2.5 Venture investment in encapsulation technology for microbes
- 4.2.6 Carbon-credit monetization for biological nitrogen fixation
- 4.3 Market Restraints
- 4.3.1 Farmer awareness gaps and on-farm handling complexity
- 4.3.2 Preference for fast-response synthetic fertilizers
- 4.3.3 Regulatory gray zones for stacked microbial cocktails
- 4.3.4 Biological contamination risk in extended supply chains
- 4.4 Regulatory Landscape
- 4.5 Technological Outlook
- 4.6 Porter's Five Forces Analysis
- 4.6.1 Bargaining Power of Suppliers
- 4.6.2 Bargaining Power of Buyers
- 4.6.3 Threat of New Entrants
- 4.6.4 Threat of Substitutes
- 4.6.5 Intensity of Competitive Rivalry
5 Market Size and Growth Forecasts
- 5.1 By Function (Value)
- 5.1.1 Crop Nutrition
- 5.1.2 Crop Protection
- 5.2 By Microorganism (Value)
- 5.2.1 Bacteria
- 5.2.1.1 Rhizobacteria
- 5.2.1.2 Azotobacter
- 5.2.1.3 Phosphobacteria
- 5.2.1.4 Other Bacteria
- 5.2.2 Fungi
- 5.2.2.1 Trichoderma
- 5.2.2.2 Mycorrhiza
- 5.2.2.3 Other Fungi
- 5.2.3 Other Microorganisms
- 5.2.1 Bacteria
- 5.3 By Mode of Application (Value)
- 5.3.1 Seed Inoculation
- 5.3.2 Soil Inoculation
- 5.4 By Crop Type (Value)
- 5.4.1 Grains and Cereals
- 5.4.2 Pulses and Oilseeds
- 5.4.3 Commercial Crops
- 5.4.4 Fruits and Vegetables
- 5.4.5 Other Applications
- 5.5 By Geography (Value)
- 5.5.1 North America
- 5.5.1.1 United States
- 5.5.1.2 Canada
- 5.5.1.3 Mexico
- 5.5.1.4 Rest of North America
- 5.5.2 Europe
- 5.5.2.1 Germany
- 5.5.2.2 United Kingdom
- 5.5.2.3 France
- 5.5.2.4 Spain
- 5.5.2.5 Italy
- 5.5.2.6 Russia
- 5.5.2.7 Rest of Europe
- 5.5.3 Asia-Pacific
- 5.5.3.1 China
- 5.5.3.2 Japan
- 5.5.3.3 India
- 5.5.3.4 Australia
- 5.5.3.5 Rest of Asia-Pacific
- 5.5.4 South America
- 5.5.4.1 Brazil
- 5.5.4.2 Argentina
- 5.5.4.3 Rest of South America
- 5.5.5 Middle East
- 5.5.5.1 Saudi Arabia
- 5.5.5.2 United Arab Emirates
- 5.5.5.3 Rest of Middle East
- 5.5.6 Africa
- 5.5.6.1 South Africa
- 5.5.6.2 Kenya
- 5.5.6.3 Rest of Africa
- 5.5.1 North America
6 Competitive Landscape
- 6.1 Market Concentration
- 6.2 Strategic Moves
- 6.3 Market Share Analysis
- 6.4 Company Profiles {(includes Global level Overview, Market level overview, Core Segments, Financials as available, Strategic Information, Market Rank/Share, Products and Services, and Recent Developments)}
- 6.4.1 BASF SE
- 6.4.2 Novonesis (Novozymes A/S)
- 6.4.3 Corteva Agriscience
- 6.4.4 Premier Tech Ltd.
- 6.4.5 Lallemand Inc.
- 6.4.6 Lesaffre - Agrauxine (Lesaffre Group)
- 6.4.7 Bioceres Crop Solutions Corp.
- 6.4.8 Verdesian Life Sciences (AEA Investors)
- 6.4.9 Mapleton Agri Biotec
- 6.4.10 New Edge Microbials
- 6.4.11 T. Stanes and Company (Amalgamations Group)
- 6.4.12 Valent BioSciences (Sumitomo Chemical)
- 6.4.13 Bayer AG
- 6.4.14 Syngenta AG (ChemChina)
7 Market Opportunities and Future Outlook
 农业接种剂市场:按类型、作物、配方、最终用途、应用方法和销售管道划分-2026-2032年全球市场预测
 农业接种剂市场报告:按类型、微生物、应用方法、剂型、作物类型和地区划分(2026-2034 年)
 2026-2034年全球农业接种剂市场规模、份额、趋势和成长分析报告
 农业接种剂市场-全球产业规模、份额、趋势、机会及预测(按类型、作物类型、微生物、应用方法、地区和竞争格局划分,2021-2031年)
 农业接种剂市场规模、份额和成长分析(按类型、微生物、作物类型、应用方法和地区划分)—产业预测(2026-2033 年)
 全球农业接种剂市场