


 |
市场调查报告书
商品编码
1850135
苜蓿牧草:市场份额分析、行业趋势、统计数据、成长预测(2025-2030 年)Alfalfa Hay - Market Share Analysis, Industry Trends & Statistics, Growth Forecasts (2025 - 2030) |
||||||
※ 本网页内容可能与最新版本有所差异。详细情况请与我们联繫。
预计到 2025 年,苜蓿牧草市场规模将达到 1,012 亿美元,到 2030 年将达到 1,393 亿美元,年复合成长率为 6.6%。
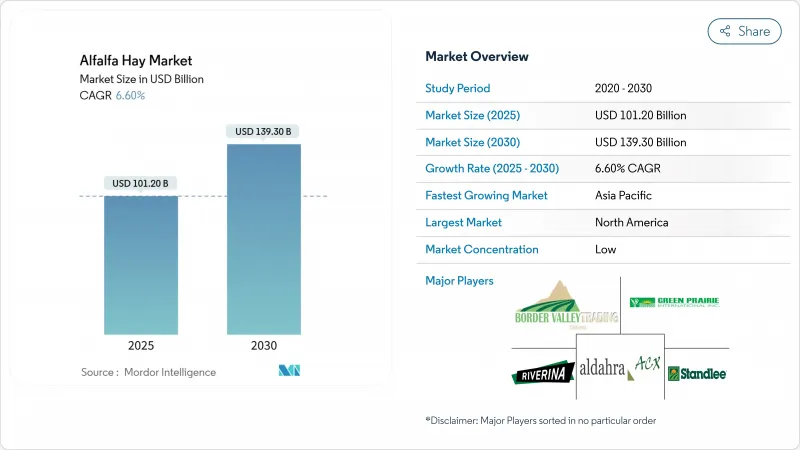
儘管全球46%的紫花苜蓿种植面积面临干旱,但市场成长仍受到乳製品需求增加、紫花苜蓿高营养价值以及节水加工技术投资的推动。北美仍然是最大的市场,而亚太地区由于蛋白质消费量上升和强劲的饲料进口计划,正呈现快速成长态势。市场仍然分散,这为资金雄厚、能够应对不断上涨的水、劳动力和运输成本的公司创造了机会。永续性发展倡议,例如碳信用计画和太阳能脱水工艺,将有助于抵消这些营运成本,并提高苜蓿牧草市场的长期盈利。
全球苜蓿牧草市场趋势与洞察
对乳製品和动物性蛋白质的需求激增
全球对动物性蛋白质的需求成长正在影响饲料筹资策略。印度、印尼和越南不断扩张的酪农签订了正式的采购协议,强调蛋白质密度的稳定性,这使得高赖氨酸紫花苜蓿成为日粮配方中不可或缺的一部分。美国原乳加工商报告称,日粮中含有18-22%粗蛋白紫花苜蓿可以提高牛奶产量和乳脂品质。在马匹养殖领域,对性能的关注促使企业持续采购优质苜蓿,从而支撑了高品质紫花苜蓿的稳定溢价。牛的扩大和饲料转换率的提高,使得苜蓿牧草成为生产者提高生产力的关键组成部分。
扩大饲料进口计划
结构完善的进口计划有助于稳定价格并建立稳定的需求模式。儘管外汇波动,日本在2023年仍维持了356,504吨的进口量;沙乌地阿拉伯在实施更严格的用水法规后,进口量增加至431,400吨。中国计划在2030年将国内种植面积扩大到900万公顷,这正在推动进口需求,并为北美出口商提供稳定的业务,儘管2023年的出货量下降了47%。这些计划下的长期供应合约提供了清晰的需求预测,并支持出口商投资脱水和压缩设备,以提高运输效率。
水足迹与干旱政策压力
亚利桑那州将于2024年终止外资紫花苜蓿农场的租赁合同,这凸显了人们对密集型耗水农业日益增长的担忧。干旱影响全球约50%的紫花苜蓿产区,迫使农民采用亏损灌溉法。这些做法会使产量降低15%至20%,但可能会提高苜蓿作为饲料的价值。精准灌溉系统和耐旱品种有助于降低风险,但其高昂的成本对小农户造成了影响。加州水库水位下降和澳洲的水资源分配限製造成了市场的不确定性,并促使北美各地的紫花苜蓿生产向北部和内陆地区转移。
细分市场分析
到2024年,捆包苜蓿干草将占苜蓿牧草市场43.0%的份额,这主要得益于成熟的处理系统和畜牧生产者的广泛采用。机械化酪农偏好大型方形捆包,而圆形捆包则能为大型肉牛养殖场提供防风雨保护。这种多样化的包装形式确保了各地区需求的稳定。脱水颗粒饲料的市占率较小,但由于自动化饲餵系统和货柜装载密度的提高(从而降低了海运成本),其复合年增长率将达到7.6%。颗粒饲料还具有品质稳定、简化饲料厂配製流程的优点,尤其适用于酪农和马匹饲料市场。
移动式颗粒生产线的投资抵消了能源消费量的增加,并使每吨苜蓿的价格比草捆价格高出 30 至 40 美元。立方体草捆和压缩草捆主要面向马匹和小反刍动物市场,这些使用者更注重便利性而非成本。田间干燥机可在 1.5 小时内将水分含量降低至 12% 以下,从而最大限度地降低收割期间的天气风险。这些技术进步增强了苜蓿牧草市场,并加速了向加工产品的转型。
到2024年,特级苜蓿牧草将占据28.3%的市场份额,复合年增长率(CAGR)高达6.1%,显示市场对富含蛋白质饲料的需求不断增长。优质级苜蓿(RFV 170-185)酪农养殖场。由于买家对霉菌毒素和污染物的限制日益严格,中等级和实用级苜蓿的肉牛份额正在下降。
品质评估发现所有中国受检样本均含有霉菌毒素,导致高端买家转向北美供应商。采用精准收割时间、高效能现场干燥方法和先进仓储监控系统的生产商,每吨可获得50-60美元的溢价,展现了基于品质标准的市场价值差异化优势。
苜蓿牧草市场报告按产品类型(例如,捆包)、等级(例如,特级)、加工技术(例如,田间干燥传统工艺)、分销渠道(例如,直接送货到农场)、牲畜用途(例如,乳牛饲料)、最终用户行业(例如,商业农场)和地区(例如,北美)进行细分。市场预测以价值(美元)和数量(公吨)为单位。
区域分析
2024年,北美将占全球销售额的36.2%,这得益于机械化作业、品质评级体係以及通往太平洋出口码头的便利。美国干草产量增加3.3%,达到1.225亿吨,但亚利桑那州和加州水资源政策的变化给产区带来了风险。威斯康辛州的产量增加了75%,达到303万吨,这表明该地区已做出相应调整,也预示着未来可能会转移到水资源更稳定的地区。
预计到2030年,亚太地区的复合年增长率将达到6.8%。印度和东南亚酪农的现代化将推动饲料需求,而中国儘管进口量有所调整,仍是最大的进口国,进口量达886,661吨。中国计划扩大国内产量,但不断增长的牛数量在短期内仍将需要进口饲料。澳洲纳穆尔迪计划暂停后,干草供应受限,凸显了气候变迁带来的脆弱性。
欧洲市场需求稳定,注重永续性和可追溯性,这使得获得碳认证的生产商在市场上更具优势。南美洲正在发展成为一个具有竞争力的出口地区,尤其是智利和阿根廷,这得益于有利的气候条件和不断完善的港口设施。由于水资源限制,中东市场仍依赖进口,预计沙乌地阿拉伯将在2024年超越日本,成为第二大进口国。非洲市场展现出早期成长潜力,肯亚和奈及利亚的商业性酪农业务不断扩张,预示着苜蓿牧草市场未来蕴藏着巨大机会。
其他福利:
- Excel格式的市场预测(ME)表
- 3个月的分析师支持
目录
第一章 引言
- 研究假设和市场定义
- 调查范围
第二章调查方法
第三章执行摘要
第四章 市场情势
- 市场概览
- 市场驱动因素
- 对乳製品和动物性蛋白质的需求激增
- 扩大饲料进口计划
- 优良的蛋白质和纤维含量
- 碳信用货币化与土壤健康
- 利用移动式干燥和包块压缩技术减少损失
- DDGS(酒糟干粉可溶性谷物)价格上涨推动饲料蛋白用量增加
- 市场限制
- 水足迹与干旱政策压力
- 海运和货柜运费的波动
- 水耕饲料和取代粗饲料的兴起
- 出口通道上的植物检疫屏障
- 价值链/供应链分析
- 监管环境
- 技术展望
- 波特五力分析
- 新进入者的威胁
- 买方的议价能力
- 供应商的议价能力
- 替代品的威胁
- 竞争对手之间的竞争
第五章 市场规模与成长预测
- 依产品类型
- 面纱
- 圆形面纱
- 方形捆包
- 颗粒
- 立方体
- 脱水颗粒
- 压缩捆
- 面纱
- 按等级/质量
- 最上(RFV 185 或以上)
- 顶部(RFV 170-185)
- 良好(RFV 150-169)
- 是的(RFV 130-149)
- 实用性(低于 RFV 130)
- 透过加工技术
- 户外晾晒常规型
- 强制空气移动式烘干机
- 旋转滚筒脱水
- 利用阳光脱水
- 透过分销管道
- 农场直达大门
- 出口公司
- 饲料整合商和磨坊
- 电子商务/线上平台
- 畜牧用途
- 乳牛饲料
- 肉牛饲料
- 家禽饲料
- 秣
- 小型反刍动物饲料
- 骆驼科动物和其他
- 按最终用途行业划分
- 商业农场
- 复合饲料生产商
- 在家饲养动物的人/以饲养动物为嗜好的人
- 宠物食品与特殊营养
- 按地区
- 北美洲
- 美国
- 加拿大
- 墨西哥
- 北美其他地区
- 欧洲
- 德国
- 英国
- 法国
- 西班牙
- 义大利
- 俄罗斯
- 其他欧洲地区
- 亚太地区
- 中国
- 日本
- 印度
- 澳洲
- 纽西兰
- 韩国
- 亚太其他地区
- 南美洲
- 巴西
- 阿根廷
- 智利
- 其他南美洲
- 中东
- 沙乌地阿拉伯
- 阿拉伯聯合大公国
- 土耳其
- 其他中东地区
- 非洲
- 南非
- 埃及
- 肯亚
- 其他非洲地区
- 北美洲
第六章 竞争情势
- 市场集中度
- 策略趋势
- 市占率分析
- 公司简介
- AL Dahra ACX Global Inc.
- Anderson Hay & Grain Co., Inc.
- Standlee Premium Products, LLC
- Border Valley Trading
- Alfalfa Monegros
- Grupo Oses(Nafosa)
- Gruppo Carli
- Green Prairie International Inc
- Cubeit Hay Company
- Haykingdom Inc.
- SL Follen Company
- Riverina
- McCracken Hay Company
- Bailey Farms International
- Hay USA Inc
第七章 市场机会与未来展望
The alfalfa hay market is valued at USD 101.2 billion in 2025 and is projected to reach USD 139.3 billion by 2030, growing at a CAGR of 6.6%.
The market growth is driven by increasing dairy demand, alfalfa's high nutritional value, and investments in water-efficient processing technologies, despite 46% of global alfalfa acreage facing drought conditions. North America maintains its position as the largest market, while the Asia-Pacific region shows the fastest growth due to increased protein consumption and strong forage import programs. The market remains fragmented, creating opportunities for well-funded companies capable of managing increased water, labor, and transportation costs. The development of sustainability initiatives, including carbon credit programs and solar-powered dehydration processes, helps offset these operational costs and improves long-term profitability in the alfalfa hay market.
Global Alfalfa Hay Market Trends and Insights
Dairy and Animal-Protein Demand Surge
The global shift toward animal-based proteins is influencing feed procurement strategies. Expanding dairy operations across India, Indonesia, and Vietnam are establishing formal purchasing contracts that emphasize consistent protein density, making high-lysine alfalfa essential in feed formulations. U.S. milk processors report that feed rations containing 18-22% crude-protein alfalfa improve milk yield and butter-fat quality. The equine sector maintains premium grade purchases due to its focus on performance, supporting stable price premiums for high-quality alfalfa. The combination of expanding herds and feed-conversion requirements establishes alfalfa hay as a key component for producers aiming to increase productivity.
Expansion of Forage-Import Programs
Import programs with defined structures help stabilize prices and establish consistent demand patterns. Japan maintained imports of 356,504 metric tons in 2023 despite currency fluctuations, while Saudi Arabia increased imports to 431,400 metric tons following stricter water-use regulations. China's plan to expand domestic production area to 9 million hectares by 2030 drives current import demand, providing steady business for North American exporters despite a 47% decline in 2023 shipments. The long-term supply agreements under these programs provide clear demand forecasts and support exporter investments in dehydration and compression facilities to improve shipping efficiency.
Water-Footprint and Drought Policy Pressure
The 2024 termination of foreign-owned alfalfa farm leases in Arizona highlighted growing concerns over water-intensive agriculture. Drought affects approximately 50% of global alfalfa production areas, leading farmers to adopt deficit-irrigation methods. These practices reduce yields by 15-20% but may enhance feeding value. While precision irrigation systems and drought-resistant varieties help manage risks, their high costs impact smaller farms. Declining reservoir levels in California and water allocation restrictions in Australia create market uncertainty, driving alfalfa production to shift northward and inland across North America.
Other drivers and restraints analyzed in the detailed report include:
- Superior Protein and Fiber Profile
- Carbon-Credit and Soil-Health Monetization
- Ocean-Freight and Container-Rate Volatility
For complete list of drivers and restraints, kindly check the Table Of Contents.
Segment Analysis
Bales account for 43.0% of the alfalfa hay market in 2024, supported by established handling systems and widespread adoption among livestock operators. Mechanized dairy farms prefer large square bales, while round bales provide weather protection for extensive beef operations. This format diversity ensures consistent demand across different regions. Dehydrated pellets, representing a smaller market share, are experiencing a 7.6% CAGR, driven by automated feeding systems and increased container-load density that reduces ocean transportation costs. Pellets also provide consistent quality, simplifying formulation processes for compound-feed mills serving dairy and equine markets.
Mobile pellet line investments generate premiums of USD 30-40 per metric ton above bale prices, compensating for increased energy consumption. Cubes and compressed bales serve equine and small-ruminant segments where users prioritize convenience over cost. Field dryers that reduce moisture content to below 12% within 1.5 hours minimize weather-related risks during harvest periods. These technological advancements strengthen the alfalfa hay market and accelerate the transition to processed formats.
Supreme grade alfalfa hay captured 28.3% of the 2024 market share and achieved the highest growth rate at 6.1% CAGR, indicating increased demand for protein-rich feed. Premium grade (RFV 170-185) maintains its dominant position among commercial dairy farms by providing an optimal balance between cost and milk production targets. Good grade serves primarily beef cattle operations that focus on cost-effective digestible protein content. Fair and Utility grades show declining market presence as buyers implement stricter mycotoxin and contaminant limits.
Quality assessments revealed mycotoxin presence in all tested Chinese samples, prompting premium buyers to shift toward North American suppliers. Producers who implement precise harvest timing, efficient field drying methods, and advanced storage monitoring systems can secure price premiums of USD 50-60 per metric ton, demonstrating the market's value differentiation based on quality standards.
The Alfalfa Hay Market Report is Segmented by Product Type (Bales and More), Grade (Supreme and More), Processing Technology (Field-Dried Conventional and More), Distribution Channel (Direct Farm Gate and More), Livestock Application (Dairy Cattle Feed and More), End-Use Sector (Commercial Farms and More), and Geography (North America and More). The Market Forecasts are Provided in Terms of Value (USD) and Volume (Metric Tons).
Geography Analysis
North America accounted for 36.2% of 2024 revenue, supported by mechanized operations, quality grading systems, and access to Pacific export terminals. U.S. hay production increased by 3.3% to 122.5 million metric tons, though water policy changes in Arizona and California pose risks to production areas. Wisconsin demonstrated regional adaptation by increasing production by 75% to 3.03 million tons, suggesting a potential shift of cultivation to regions with secure water resources.
Asia-Pacific is anticipated to grow at a 6.8% CAGR through 2030. The modernization of dairy operations in India and Southeast Asia drives feed demand, while China maintains its position as the largest importer at 886,661 metric tons despite volume adjustments. While China aims to expand domestic production, near-term import requirements persist due to herd growth. Australia's hay supply constraints following the Nammuldi project suspension highlight climate-related vulnerabilities.
Europe maintains a stable demand with an emphasis on sustainability and traceability, where producers with carbon certifications gain market advantages. South America is developing as a competitive exporter, particularly in Chile and Argentina, benefiting from suitable climate conditions and improved port facilities. Middle Eastern markets continue to depend on imports due to water limitations, with Saudi Arabia becoming the second-largest importer in 2024, surpassing Japan. Africa shows initial growth potential as commercial dairy operations expand in Kenya and Nigeria, indicating future opportunities in the alfalfa hay market.
- AL Dahra ACX Global Inc.
- Anderson Hay & Grain Co., Inc.
- Standlee Premium Products, LLC
- Border Valley Trading
- Alfalfa Monegros
- Grupo Oses (Nafosa)
- Gruppo Carli
- Green Prairie International Inc
- Cubeit Hay Company
- Haykingdom Inc.
- SL Follen Company
- Riverina
- McCracken Hay Company
- Bailey Farms International
- Hay USA Inc
Additional Benefits:
- The market estimate (ME) sheet in Excel format
- 3 months of analyst support
TABLE OF CONTENTS
1 Introduction
- 1.1 Study Assumptions and Market Definition
- 1.2 Scope of the Study
2 Research Methodology
3 Executive Summary
4 Market Landscape
- 4.1 Market Overview
- 4.2 Market Drivers
- 4.2.1 Dairy and Animal-Protein Demand Surge
- 4.2.2 Expansion of Forage-Import Programs
- 4.2.3 Superior Protein and Fiber Profile
- 4.2.4 Carbon-Credit and Soil-Health Monetization
- 4.2.5 On-the-Go Drying and Bale-Compression Tech Cuts Losses
- 4.2.6 Distiller's Dried Grains with Solubles (DDGS) Inflation Driving Forage Protein Use
- 4.3 Market Restraints
- 4.3.1 Water-Footprint and Drought Policy Pressure
- 4.3.2 Ocean-Freight and Container-Rate Volatility
- 4.3.3 Rise of Hydroponic Fodder and Alternative Roughage
- 4.3.4 Phytosanitary Barriers in Export Lanes
- 4.4 Value/Supply-Chain Analysis
- 4.5 Regulatory Landscape
- 4.6 Technological Outlook
- 4.7 Porter's Five Forces Analysis
- 4.7.1 Threat of New Entrants
- 4.7.2 Bargaining Power of Buyers
- 4.7.3 Bargaining Power of Suppliers
- 4.7.4 Threat of Substitutes
- 4.7.5 Intensity of Competitive Rivalry
5 Market Size and Growth Forecasts (Value and Volume)
- 5.1 By Product Type
- 5.1.1 Bales
- 5.1.1.1 Round Bales
- 5.1.1.2 Square Bales
- 5.1.2 Pellets
- 5.1.3 Cubes
- 5.1.4 Dehydrated Pellets
- 5.1.5 Compressed Bales
- 5.1.1 Bales
- 5.2 By Grade/Quality
- 5.2.1 Supreme (RFV More Than 185)
- 5.2.2 Premium (RFV 170-185)
- 5.2.3 Good (RFV 150-169)
- 5.2.4 Fair (RFV 130-149)
- 5.2.5 Utility (RFV Less Than 130)
- 5.3 By Processing Technology
- 5.3.1 Field-Dried Conventional
- 5.3.2 Forced-Air Mobile Dryer
- 5.3.3 Rotary Drum Dehydration
- 5.3.4 Solar-Assisted Dehydration
- 5.4 By Distribution Channel
- 5.4.1 Direct Farm Gate
- 5.4.2 Export Trading Houses
- 5.4.3 Feed Integrators and Mills
- 5.4.4 E-commerce/Online Platforms
- 5.5 By Livestock Application
- 5.5.1 Dairy Cattle Feed
- 5.5.2 Beef Cattle Feed
- 5.5.3 Poultry Feed
- 5.5.4 Equine Feed
- 5.5.5 Small Ruminant Feed
- 5.5.6 Camelids and Other
- 5.6 By End-Use Sector
- 5.6.1 Commercial Farms
- 5.6.2 Compound Feed Manufacturers
- 5.6.3 Household/Hobby Animal Owners
- 5.6.4 Pet-food and Specialty Nutrition
- 5.7 By Geography
- 5.7.1 North America
- 5.7.1.1 United States
- 5.7.1.2 Canada
- 5.7.1.3 Mexico
- 5.7.1.4 Rest of North America
- 5.7.2 Europe
- 5.7.2.1 Germany
- 5.7.2.2 United Kingdom
- 5.7.2.3 France
- 5.7.2.4 Spain
- 5.7.2.5 Italy
- 5.7.2.6 Russia
- 5.7.2.7 Rest of Europe
- 5.7.3 Asia-Pacific
- 5.7.3.1 China
- 5.7.3.2 Japan
- 5.7.3.3 India
- 5.7.3.4 Australia
- 5.7.3.5 New Zealand
- 5.7.3.6 South Korea
- 5.7.3.7 Rest of Asia-Pacific
- 5.7.4 South America
- 5.7.4.1 Brazil
- 5.7.4.2 Argentina
- 5.7.4.3 Chile
- 5.7.4.4 Rest of South America
- 5.7.5 Middle East
- 5.7.5.1 Saudi Arabia
- 5.7.5.2 United Arab Emirates
- 5.7.5.3 Turkey
- 5.7.5.4 Rest of Middle East
- 5.7.6 Africa
- 5.7.6.1 South Africa
- 5.7.6.2 Egypt
- 5.7.6.3 Kenya
- 5.7.6.4 Rest of Africa
- 5.7.1 North America
6 Competitive Landscape
- 6.1 Market Concentration
- 6.2 Strategic Moves
- 6.3 Market Share Analysis
- 6.4 Company Profiles (includes Global level Overview, Market level overview, Core Segments, Financials as available, Strategic Information, Market Rank/Share for key companies, Products and Services, and Recent Developments)
- 6.4.1 AL Dahra ACX Global Inc.
- 6.4.2 Anderson Hay & Grain Co., Inc.
- 6.4.3 Standlee Premium Products, LLC
- 6.4.4 Border Valley Trading
- 6.4.5 Alfalfa Monegros
- 6.4.6 Grupo Oses (Nafosa)
- 6.4.7 Gruppo Carli
- 6.4.8 Green Prairie International Inc
- 6.4.9 Cubeit Hay Company
- 6.4.10 Haykingdom Inc.
- 6.4.11 SL Follen Company
- 6.4.12 Riverina
- 6.4.13 McCracken Hay Company
- 6.4.14 Bailey Farms International
- 6.4.15 Hay USA Inc
7 Market Opportunities and Future Outlook
 苜蓿牧草市场规模、份额和成长分析(按产品类型、应用、最终用途产业、品质等级、分销管道和地区划分)—产业预测(2026-2033 年)
 苜蓿牧草市场按产品类型、形态、最终用户和分销管道划分-2025-2032年全球预测
 紫花苜蓿干草市场:未来预测(2025-2030)
 2030 年苜蓿牧草市场预测:按类型、品质、牲畜和地区进行的全球分析
 北美苜蓿干草市场预测至 2030 年 - 区域分析 - 按类型(苜蓿干草捆、苜蓿干草颗粒、苜蓿干草块等)和应用(反刍动物饲料、马饲料、家禽饲料等)
 苜蓿干草市场规模和预测、全球和区域份额、趋势和成长机会分析报告范围:按类型、应用和地理位置