


 |
市场调查报告书
商品编码
1850165
商业智慧(BI):市场占有率分析、产业趋势、统计数据、成长预测(2025-2030)Business Intelligence (BI) - Market Share Analysis, Industry Trends & Statistics, Growth Forecasts (2025 - 2030) |
||||||
※ 本网页内容可能与最新版本有所差异。详细情况请与我们联繫。
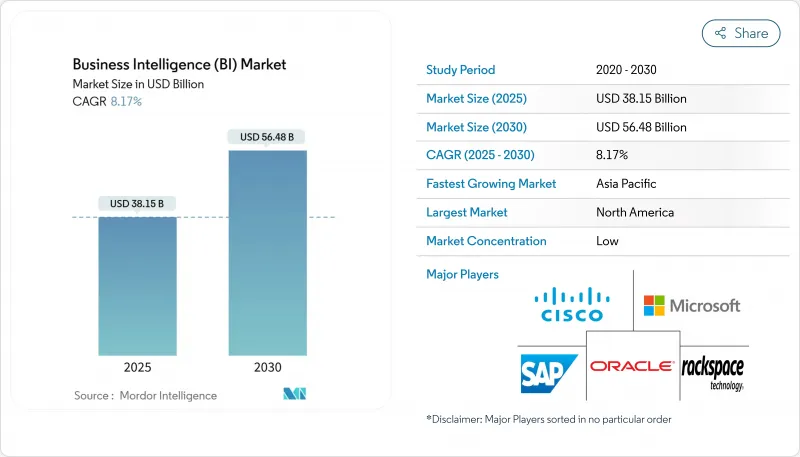
商业智慧(BI) 市场预计到 2025 年将达到 381.5 亿美元,到 2030 年将达到 562.8 亿美元,复合年增长率为 8.17%。
云端原生架构、人工智慧驱动的分析以及资料驱动文化的兴起,持续推动着各种规模企业对云端原生分析的高需求。半结构化资料的即时摄取、GPU查询的查询执行以及嵌入式分析的日益普及,正推动着人们的讨论从传统的仪錶板转向预测性和指导性模型。订阅定价和託管服务降低了准入门槛,而多重云端策略有助于减少供应商锁定,并支援受监管行业的合规性。超大规模超大规模资料中心业者,而专注于无程式码自动化的AI新兴企业则加剧了竞争。技能短缺、跨境资料主权规则以及云端使用费用仍然是商业情报市场的主要障碍。
全球商业智慧(BI) 市场趋势与洞察
采用云端优先分析
企业正在将商业智慧 (BI) 工作负载迁移到提供弹性运算和原生 AI 服务的云端平台,以取代难以应对即时经营团队Oracle这一增长归因于需要可扩展 GPU 实例的 AI计划。多重云端架构正成为一流分析的热门选择,但也引发了人们对资料迁移成本和管治一致性的担忧。受监管产业将云端合规自动化视为竞争优势而非风险,加速了医疗保健和金融服务业的迁移计划。供应商正在透过区域分区资料控制来应对这项挑战,以在保持效能的同时实现合规分析。
半结构化物联网资料的爆炸性成长
工厂、物流中心和智慧城市计画正在部署数十亿个感测器,产生嵌套的 JSON 和时间序列资料流。传统的关联型资料仓储无法解析如此庞大的资料规模和格式,因此需要采用能够即时分析资料的串流平台。边缘设备处理初步分析结果以降低延迟,然后将汇总资料推送至云端 AI 模型,从而获得全系统洞察。 Nutanix 的研究表明,85% 的企业计划采用生成式 AI,超过一半的企业正在投资基础设施升级以支援大量分析。这项因素推动了 GPU 加速引擎和记忆体内列式储存在整个商业智慧市场实现摘要成长。
数据素养人才短缺
提供人工智慧输出只是工作的一半;将其转化为实际操作决策,需要具备深厚统计知识和领域背景知识的人员。医疗保健系统报告称,人工智慧计划存在41%的技能缺口,公共机构也面临类似的短缺。人才短缺推高了薪资水平,延长了计划週期,迫使供应商投资自动化洞察生成和自然语言介面,以弥补能力缺口。这种限制因素减缓了新兴市场和区域市场的部署速度,也拖慢了商业智慧市场的发展步伐。
细分市场分析
企业对人工智慧驱动的洞察需求不断增长,将使软体平台继续保持领先地位,预计到2024年将占据67%的收入份额。这一主导地位将确保平台商业智慧市场规模扩大,同时,客製化和优化部署的服务也将以8%的复合年增长率成长。微软的生产力和业务流程部门预计在2025年第二季将录得294亿美元的收入,其中Dynamics 365年增19%,凸显了市场对整合商业智慧(BI)功能的整合式业务应用程式的强劲需求。
平台供应商正将自动化资料建模、自然语言搜寻和主动通知等功能整合到平台中,以区别于仅提供视觉化功能的竞争对手。 Salesforce 的 Tableau Next 引入了人工智慧代理,能够发现工作流程中的异常情况,从而缩短从资料到行动的时间。服务团队正从这种日益复杂的局面中获益,他们指导受监管行业完成模型检验、符合审核要求的血缘关係分析以及特定领域的调优。因此,与商业情报市场相关的咨询收入成长速度超过了传统维护业务的收入成长速度。
预计到 2024 年,云端业务收入将占 SAP 总收入的 66%,到 2030 年将以 9.5% 的复合年增长率成长。混合云模式在国防和公共部门持续普及,这些部门也将一些敏感度较低的工作负载迁移到区域云端平台。 SAP 2025 年第一季的云端业务收入成长 27%,达到 49 亿欧元(53 亿美元),这表明传统 ERP 客户率先迁移了他们的分析模组。
弹性运算、全球覆盖和打包式人工智慧服务使云端成为即时仪錶板和模型训练的必要条件。边缘节点处理製造业和摘要的本地遥测数据,并将汇总结果同步到云端储存库,从而形成分散式架构,扩大了商业智慧市场的覆盖范围。本机部署解决方案主要存在于资料居住规则禁止外部託管的场景,但容器化配置现在正在私有资料中心内模拟云端模式。
商业智慧(BI) 市场按组件(软体和平台、服务)、配置(本地部署和云端部署)、经营模式(订阅/SaaS 许可、永久许可等)、最终用户行业(银行、金融服务和保险 (BFSI)、IT 和通讯等)以及地区进行细分。市场预测以美元计价。
区域分析
北美地区预计在2024年将维持38.3%的营收成长,这主要得益于由超大规模资料中心业者和独立软体开发商(ISV)组成的密集生态系统,推动了分析功能的快速迭代和交叉销售,使其融入现有软体。目前,投资重点在于利用生成式人工智慧和对话式商业智慧来增强现有部署,从而加深应用。严格的隐私和人工智慧伦理准则正在影响全球产品蓝图,进一步提升其在北美商业智慧市场的影响力。
亚太地区将在2030年前实现最高成长,年复合成长率将达到12.7%,这主要得益于传统技术的突破和政府支持的数位化计画。亚太地区43%的企业计画在未来一年内将人工智慧支出增加20%以上。中国将加速发展,主要由银行业现代化和医院数据分析引领;而印度和东南亚将受益于数据中心容量的快速扩张,预计到2024年将达到12.2吉瓦。
随着GDPR和即将推出的欧盟人工智慧立法重塑采购格局,欧洲将迎来稳定成长。供应商强调“隐私设计”、“联邦学习”和“本地化託管”,以满足144个国家/地区的资料隐私法律(这些法律与GDPR原则相符)。在政府云端政策和日益增强的网路连结的推动下,拉丁美洲和非洲正在崛起为新兴热点地区,但人才短缺和监管体系的不完全限制了它们在短期内对商业智慧市场的贡献。
其他福利:
- Excel格式的市场预测(ME)表
- 3个月的分析师支持
目录
第一章 引言
- 研究假设和市场定义
- 调查范围
- 关键绩效指标(KPI)
第二章调查方法
第三章执行摘要
第四章 市场情势
- 市场概览
- 市场驱动因素
- 云端优先分析成为主流
- 半结构化物联网资料正迅速成为主流
- 主流SaaS业务应用程式中的嵌入式BI
- 在註重隐私的广告领域,建立谨慎的资料无尘室伙伴关係
- 非侵入式 GPU 加速查询引擎可降低整体拥有成本
- 非侵入式分析即程式码和 GitOps 实践的兴起
- 市场限制
- 数据素养人才短缺
- 主流传统核心系统的初始整合成本
- 多重云端BI架构中隐藏的出口价格飙升
- 新兴数位贸易规则中对资料主权的悄悄打压
- 价值/供应链分析
- 监管环境
- 技术展望
- 波特五力分析
- 供应商的议价能力
- 买方/消费者的议价能力
- 新进入者的威胁
- 替代品的威胁
- 竞争对手之间的竞争
- 定价分析
第五章 市场规模与成长预测
- 按组件
- 软体和平台
- 服务
- 透过部署
- 本地部署
- 云
- 按最终用户行业划分
- BFSI
- 资讯科技/通讯
- 零售与电子商务
- 卫生保健
- 製造业
- 政府和公共部门
- 按经营模式
- 订阅/SaaS 许可
- 永久许可
- 免费增值/按使用量付费
- 託管服务/BI即服务
- 按地区
- 北美洲
- 美国
- 加拿大
- 南美洲
- 巴西
- 阿根廷
- 其他南美洲
- 欧洲
- 德国
- 英国
- 法国
- 义大利
- 西班牙
- 其他欧洲地区
- 亚太地区
- 中国
- 日本
- 韩国
- 印度
- 澳洲
- 纽西兰
- 亚太其他地区
- 中东和非洲
- 阿拉伯聯合大公国
- 沙乌地阿拉伯
- 南非
- 其他中东和非洲地区
- 北美洲
第六章 竞争情势
- 市场集中度
- 策略趋势
- 市占率分析
- 公司简介
- Microsoft Corporation
- SAP SE
- Oracle Corporation
- International Business Machines Corp.(IBM)
- SAS Institute Inc.
- Salesforce Inc.(Tableau and Einstein Analytics)
- Amazon Web Services Inc.(QuickSight)
- Google LLC(Looker Studio)
- QlikTech International AB
- MicroStrategy Inc.
- Domo Inc.
- TIBCO Software
- Infor Inc.
- Zoho Corporation(Zoho Analytics)
- Teradata Corp.
- Alteryx Inc.
- Sisense Inc.
- ThoughtSpot Inc.
- Yellowfin International
- GoodData Corp.
第七章 市场机会与未来展望
The business intelligence market stands at USD 38.15 billion in 2025 and will reach USD 56.28 billion by 2030 on an 8.17% CAGR.
Cloud-native architectures, AI-enhanced analytics, and growing data-driven cultures keep demand high across enterprises of all sizes. Real-time ingestion of semi-structured data, GPU-accelerated query execution, and rising adoption of embedded analytics move the conversation beyond historical dashboards toward predictive and prescriptive models. Subscription pricing and managed services lower entry barriers, while multi-cloud strategies mitigate vendor lock-in and support compliance in regulated sectors. Intensifying competition comes from hyperscalers that bundle analytics with infrastructure and from AI-native start-ups focused on no-code automation. Skills shortages, cross-border data-sovereignty rules, and cloud egress fees remain the main speed bumps for the business intelligence market.
Global Business Intelligence (BI) Market Trends and Insights
Cloud-first analytics adoption
Enterprises move BI workloads to cloud platforms that deliver elastic compute and native AI services, replacing on-premises stacks that struggle with real-time model execution. Oracle's cloud revenue reached USD 6.2 billion in Q3 2025 with a 25% gain, and management linked the surge to AI projects that demand scalable GPU instances. Multicloud architectures become popular for best-of-breed analytics but raise issues around data movement costs and governance consistency. Regulated industries now treat cloud compliance automation as a competitive advantage rather than a risk, accelerating migration projects across healthcare and financial services. Vendors respond with regionally partitioned data controls, enabling compliant analytics while preserving performance.
Explosion of semi-structured IoT data
Factories, logistics hubs, and smart-city programs deploy billions of sensors that generate nested JSON and time-series streams. Classical relational warehouses cannot parse the scale or format, prompting uptake of streaming platforms that analyse data in motion. Edge appliances handle first-pass analytics to cut latency, then push summarized data to cloud AI models for fleet-wide insights. Nutanix found 85% of firms have a generative-AI deployment plan, and more than half are funding infrastructure upgrades to support high-volume analytics. This driver sustains double-digit growth for GPU-accelerated engines and in-memory column stores across the business intelligence market.
Shortage of data-literate workforce
Delivering AI outputs is only half the job; turning them into operational decisions requires staff fluent in statistics and domain context. Healthcare systems report 41% skill gaps for AI projects, and public agencies cite similar shortages. Talent scarcity inflates salaries, extends project timelines, and forces vendors to invest in automated insight generation and natural-language interfaces to bridge capability gaps. The constraint slows rollouts in emerging economies and rural regions, tempering the trajectory of the business intelligence market.
Other drivers and restraints analyzed in the detailed report include:
- Embedded BI in SaaS business apps
- Restraint % Impact on CAGR Forecast Geographic Relevance Impact Timeline
- Up-front integration cost for legacy core systems
For complete list of drivers and restraints, kindly check the Table Of Contents.
Segment Analysis
Growing enterprise demand for AI-fuelled insights keeps software platforms at the forefront, representing 67% revenue in 2024. This dominance ensures the business intelligence market size for platforms will climb alongside an 8% CAGR for services that customize and optimize deployments. Microsoft's Productivity and Business Processes division logged USD 29.4 billion in Q2 2025, with Dynamics 365 up 19% year-on-year, underscoring appetite for integrated business apps with built-in BI.
Platform vendors embed automated data modelling, natural-language search, and proactive notifications to distinguish themselves from visualization-only rivals. Salesforce's Tableau Next introduced AI agents that surface anomalies inside workflows, shrinking time from data to action. Services teams profit from the added complexity, guiding regulated industries through model validation, audit-ready lineage, and domain-specific tuning. As a result, consulting revenues tied to the business intelligence market rise faster than legacy maintenance streams.
Cloud held 66% of revenue in 2024 and is on pace for a 9.5% CAGR through 2030, reflecting its role as the default setting for new analytics. Hybrid adoption endures in defence and public sectors, but even these groups push non-sensitive workloads to regional cloud zones. SAP recorded EUR 4.9 billion (USD 5.3 billion) in cloud sales during Q1 2025, up 27%, showing legacy ERP clients migrating analytics modules first.
Elastic compute, global presence, and packaged AI services make cloud indispensable for real-time dashboards and model training. Edge nodes process local telemetry in manufacturing and retail, then sync summaries to cloud repositories, forming a distributed architecture that enlarges the business intelligence market footprint. On-premises solutions survive mainly where data-residency rules forbid external hosting, though containerized deployments now emulate cloud patterns inside private data centers.
Business Intelligence (BI) Market Segmented by Component (Software and Platform, Services), Deployment (On-Premise and Cloud), Business Model (Subscription / SaaS License, Perpetual License and More), End-User Industry (BFSI, IT and Telecommunication and More), and Geography. The Market Forecasts are Provided in Terms of Value (USD).
Geography Analysis
North America retained 38.3% revenue in 2024, anchored by a dense ecosystem of hyperscalers and ISVs that iterate quickly and cross-sell analytics into existing software estates. Investments now center on augmenting established deployments with generative AI and conversational BI to deepen usage. Stringent privacy and AI-ethics guidelines influence global product roadmaps, further elevating North America's sway over the business intelligence market.
Asia-Pacific delivers the highest growth at 12.7% CAGR to 2030, a function of leapfrogging legacy constraints and state-backed digital programs. Forty-three percent of APAC firms plan to raise AI spend by more than 20% in the upcoming year. China accelerates around banking modernization and hospital analytics, while India and Southeast Asia benefit from rapidly expanding data-center capacity that reached 12.2 GW operational in 2024.
Europe grows steadily as GDPR and the forthcoming EU AI Act shape procurement. Vendors emphasize privacy-by-design, federated learning, and localized hosting to satisfy 144 national data-privacy laws that mirror GDPR principles. Latin America and Africa emerge as nascent hotspots, propelled by government cloud mandates and improving connectivity, yet limited by talent shortages and patchwork regulations that temper near-term contributions to the business intelligence market.
- Microsoft Corporation
- SAP SE
- Oracle Corporation
- International Business Machines Corp. (IBM)
- SAS Institute Inc.
- Salesforce Inc. (Tableau and Einstein Analytics)
- Amazon Web Services Inc. (QuickSight)
- Google LLC (Looker Studio)
- QlikTech International AB
- MicroStrategy Inc.
- Domo Inc.
- TIBCO Software
- Infor Inc.
- Zoho Corporation (Zoho Analytics)
- Teradata Corp.
- Alteryx Inc.
- Sisense Inc.
- ThoughtSpot Inc.
- Yellowfin International
- GoodData Corp.
Additional Benefits:
- The market estimate (ME) sheet in Excel format
- 3 months of analyst support
TABLE OF CONTENTS
1 INTRODUCTION
- 1.1 Study Assumptions and Market Definition
- 1.2 Scope of the Study
- 1.3 Key Performance Indicators (KPIs)
2 RESEARCH METHODOLOGY
3 EXECUTIVE SUMMARY
4 MARKET LANDSCAPE
- 4.1 Market Overview
- 4.2 Market Drivers
- 4.2.1 Mainstream Cloud-first analytics adoption
- 4.2.2 Mainstream Explosion of semi-structured IoT data
- 4.2.3 Mainstream Embedded BI in SaaS business apps
- 4.2.4 Under-the-radar Data clean-room partnerships in privacy-first advertising
- 4.2.5 Under-the-radar GPU-accelerated query engines lowering TCO
- 4.2.6 Under-the-radar Rise of Analytics-as-Code and GitOps practices
- 4.3 Market Restraints
- 4.3.1 Mainstream Shortage of data-literate workforce
- 4.3.2 Mainstream Up-front integration cost for legacy core systems
- 4.3.3 Under-the-radar Escalating egress fees in multi-cloud BI architectures
- 4.3.4 Under-the-radar Data-sovereignty clampdowns in emerging digital-trade rules
- 4.4 Value / Supply-Chain Analysis
- 4.5 Regulatory Landscape
- 4.6 Technological Outlook
- 4.7 Porter's Five Forces Analysis
- 4.7.1 Bargaining Power of Suppliers
- 4.7.2 Bargaining Power of Buyers/Consumers
- 4.7.3 Threat of New Entrants
- 4.7.4 Threat of Substitute Products
- 4.7.5 Intensity of Competitive Rivalry
- 4.8 Pricing Analysis
5 MARKET SIZE AND GROWTH FORECASTS (VALUE)
- 5.1 By Component
- 5.1.1 Software and Platform
- 5.1.2 Services
- 5.2 By Deployment
- 5.2.1 On-Premise
- 5.2.2 Cloud
- 5.3 By End-User Industry
- 5.3.1 BFSI
- 5.3.2 IT and Telecommunication
- 5.3.3 Retail and e-Commerce
- 5.3.4 Healthcare
- 5.3.5 Manufacturing
- 5.3.6 Government and Public Sector
- 5.4 By Business Model
- 5.4.1 Subscription / SaaS License
- 5.4.2 Perpetual License
- 5.4.3 Freemium / Usage-based
- 5.4.4 Managed Service / BI-as-a-Service
- 5.5 By Geography
- 5.5.1 North America
- 5.5.1.1 United States
- 5.5.1.2 Canada
- 5.5.2 South America
- 5.5.2.1 Brazil
- 5.5.2.2 Argentina
- 5.5.2.3 Rest of South America
- 5.5.3 Europe
- 5.5.3.1 Germany
- 5.5.3.2 United Kingdom
- 5.5.3.3 France
- 5.5.3.4 Italy
- 5.5.3.5 Spain
- 5.5.3.6 Rest of Europe
- 5.5.4 Asia-Pacific
- 5.5.4.1 China
- 5.5.4.2 Japan
- 5.5.4.3 South Korea
- 5.5.4.4 India
- 5.5.4.5 Australia
- 5.5.4.6 New Zealand
- 5.5.4.7 Rest of Asia-Pacific
- 5.5.5 Middle East and Africa
- 5.5.5.1 United Arab Emirates
- 5.5.5.2 Saudi Arabia
- 5.5.5.3 South Africa
- 5.5.5.4 Rest of Middle East and Africa
- 5.5.1 North America
6 COMPETITIVE LANDSCAPE
- 6.1 Market Concentration
- 6.2 Strategic Moves
- 6.3 Market Share Analysis
- 6.4 Company Profiles (includes Global-level Overview, Market-level Overview, Core Segments, Financials, Strategic Information, Market Rank/Share, Products and Services, Recent Developments)
- 6.4.1 Microsoft Corporation
- 6.4.2 SAP SE
- 6.4.3 Oracle Corporation
- 6.4.4 International Business Machines Corp. (IBM)
- 6.4.5 SAS Institute Inc.
- 6.4.6 Salesforce Inc. (Tableau and Einstein Analytics)
- 6.4.7 Amazon Web Services Inc. (QuickSight)
- 6.4.8 Google LLC (Looker Studio)
- 6.4.9 QlikTech International AB
- 6.4.10 MicroStrategy Inc.
- 6.4.11 Domo Inc.
- 6.4.12 TIBCO Software
- 6.4.13 Infor Inc.
- 6.4.14 Zoho Corporation (Zoho Analytics)
- 6.4.15 Teradata Corp.
- 6.4.16 Alteryx Inc.
- 6.4.17 Sisense Inc.
- 6.4.18 ThoughtSpot Inc.
- 6.4.19 Yellowfin International
- 6.4.20 GoodData Corp.
7 MARKET OPPORTUNITIES AND FUTURE OUTLOOK
- 7.1 White-space and Unmet Need Assessment
 GMIPulse - 专业服务市场情报订阅
 2025年银行、金融服务和保险(BFSI)商业智慧全球市场报告
 社交商业智慧市场分析及预测(至 2034 年):按类型、产品、服务、技术、组件、应用、部署、最终用户和功能
 商业智慧市场:按组件、功能、技术、部署类型、组织规模和产业划分 - 2025-2032 年全球预测2025年自助商业智慧(BI)全球市场报告
 全球社交商业智慧市场:市场规模、份额、趋势分析(按组件、业务功能、最终用途和地区)、展望和预测(2025-2032 年)社交商业智慧市场规模、份额和趋势分析报告:按组件、业务功能、最终用途、地区和细分市场预测,2025 年至 2033 年2025年社交商业智慧全球市场报告
 社群商业智慧市场,规模,占有率,趋势,产业分析报告:各零件,商务机能,各最终用途,各地区,2025年~2034年的市场预测
 行动商业智慧:市场占有率分析、产业趋势、统计数据和成长预测(2025-2030)