


 |
市场调查报告书
商品编码
1850248
网路流量分析:市场份额分析、行业趋势、统计数据和成长预测(2025-2030 年)Network Traffic Analysis - Market Share Analysis, Industry Trends & Statistics, Growth Forecasts (2025 - 2030) |
||||||
※ 本网页内容可能与最新版本有所差异。详细情况请与我们联繫。
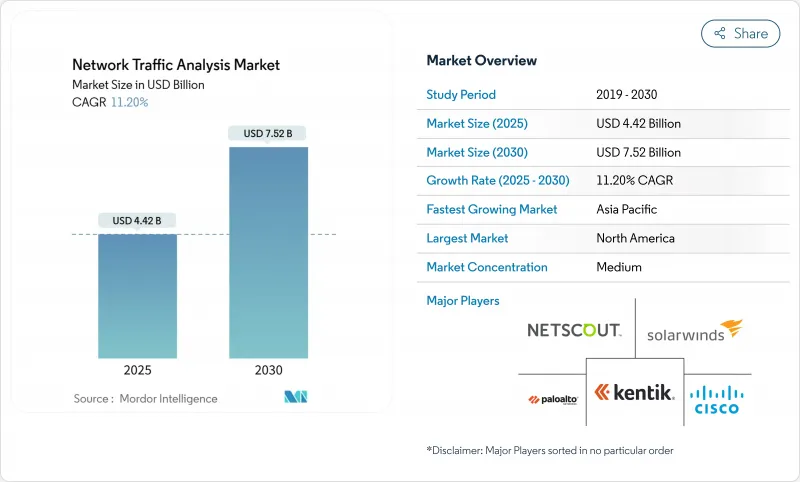
预计到 2025 年,网路流量分析市场规模将达到 44.2 亿美元,到 2030 年将达到 75.2 亿美元,预测期(2025-2030 年)的复合年增长率为 11.20%。
这种成长反映了安全社群从边界防御转向深度流量视觉的趋势,因为零信任计画、5G部署和云端原生工作负载模糊了传统的边界。企业将网路遥测视为单一资料来源,它能够揭示混合环境中的横向移动、加密威胁和效能瓶颈。将人工智慧主导的分析与持续资料包撷取相结合的供应商,凭藉其託管侦测与回应 (MDR) 服务,正在赢得市场份额,这些服务能够缓解小型 IT 部门的技能差距,同时帮助安全团队整合各种独立工具。同时,平台供应商正竞相整合加密流量分析和东西向流量侦测功能,以应对 TLS 1.3 的普及和微服务的激增。
全球网路流量分析市场趋势与洞察
NTA 的出现使其成为现代安全堆迭的基石。
70% 的进阶持续性威胁主要依赖横向移动,而这种移动可以透过精细化的流量分析来侦测。将资料包分析与安全资讯和事件管理 (SIEM) 以及扩展资料侦测 (XDR) 系统紧密整合,与使用独立工具相比,可以将平均侦测时间缩短高达 30%。整合远端检测还可以减少 40-50% 的关联分析工作量,从而使稀缺的分析人员能够专注于优先排序,而不是资料处理。提供开放 API 和云端规模资料湖的供应商现在为许多零信任计画提供支持,使网路流量分析 (NTA) 成为端点、身分和云端防御的基础架构。因此,以平台为先的采购模式正在将预算从独立探测器转向整合的 SaaS 分析。
网路频宽的增加和5G部署造成了可视性差距
向 5G 过渡将带来超高小区密度、分散式用户平面功能和多接入边缘运算,这将使传统的分流器和镜像连接埠不堪重负。光是在美国,预计到 2027 年,私人 5G 投资就将达到 37 亿美元,然而大多数现有的监控协定堆迭无法处理容器化流量或以毫秒精度侦测异常。服务供应商正与安全专家 T-Mobile 的 Prisma SASE 套件合作,将网路切片与线上威胁侦测结合。物联网的普及给分析引擎带来了更大的压力,因为基于特征码的工具无法跟上设备行为的多样化,从而刺激了对基于行为和机器学习的模型的需求。
快速演变的威胁和加密技术的发展速度超过了工具的运行速度。
TLS 1.3 透过加密 95% 的网路流量并隐藏握手元元资料,有效阻止了传统的深度套件侦测 (DPI)。加密 ClientHello 和 0-RTT 恢復等特性迫使供应商转向侧通道推断,这种推断依赖于时间、序列长度和流量形态。诸如多实例加密流量转换器 (Multi-Instance Encrypted Traffic Transformer) 之类的研究原型已达到 99% 的分类准确率,但需要 GPU 级别的强大运算能力和大多数 IT 团队所缺乏的资料科学人才。规模较小的供应商正苦于研发成本,并面临裁员和被收购的风险。
细分市场分析
到 2024 年,云端部署将占总营收的 51.2%,凸显了企业对弹性 SaaS 分析的偏好,这种分析方式可以将资本支出转化为固定成本。到 2030 年,云端部署的复合年增长率 (CAGR) 将达到 13.7%,成长主要由混合模式将传统资料中心与 AWS、Azure 和 GCP 结合。这种混合模式既能确保符合资料驻留规则,又能保持云端的敏捷性。 Zscaler 的流量撷取服务展示了云端平台如何在不占用本地撷取装置资源的情况下,将原始流量汇出到分析管道。
采用混合架构的公司报告称,由于升级集中部署,硬体更新成本降低,新检测功能的部署速度也更快。虽然本地部署的探测器在与空气间隙且监管严格的行业中仍然存在,但随着监管机构采用云端认证框架,其在各行业探测器市场中的份额正在稳步下降。混合架构的采用正在推动整个网路流量分析市场向缺乏企业级工具的待开发区中型企业扩展。
至2024年,解决方案(包括设备、虚拟感测器和SaaS主机)将占网路流量分析市场规模的62.4%。然而,随着监控和事件回应工作量的减少,服务正以14.5%的复合年增长率快速成长。 OPSWAT收购InQuest表明,供应商正在将深度文件侦测和威胁情报整合到託管服务中,以满足联邦政府的需求。
采用託管服务是应对分析师短缺和产品复杂性的务实之举。服务提供者提供全天候可用性、精选威胁情报源和自动化隔离措施,从而推动了资源受限企业的采用。在 100Gbps 以上的骨干网路中,硬体感测器仍然具有重要意义,因为 FPGA 加速的性能优于虚拟设备。然而,供应商正越来越多地将这些感测器定位为资料转发器,为云端分析提供资料。
网路流量分析市场按配置(本地部署、云端基础、混合部署)、组件(解决方案和服务)、组织规模(大型企业和中小企业)、最终用户行业(银行、金融服务和保险 (BFSI)、IT 和电信、其他)以及地区进行细分。以上所有细分市场的市场规模和预测均以价值(百万美元)为单位。
区域分析
受严格的隐私法、零信任架构的早期应用以及高额网路安全预算的推动,北美地区预计在2024年将占全球收入的34.06%。摩根大通的嵌入式人工智慧诈骗系统展现了该地区对资料包主导分析的强劲需求,该系统可将威胁识别速度提升300倍,并每年节省2亿美元。印第安纳州在其多重云端中部署流量分析后,显着提升了公民服务水准。
亚太地区是高速成长引擎,复合年增长率高达14.3%。中国、印度和韩国大规模部署5G网络,加上智慧城市投资和日益增加的勒索软体攻击事件,正在推动网路终端分析(NTA)技术的应用。诸如中国的《网路安全法》和澳洲的《关键基础设施法》等地方性法规,都强制要求进行流量日誌记录和异常检测。使用专用蜂巢式网路实现工厂数位化的製造商需要进行详细的监控,以确保营运技术(OT)与资讯技术(IT)的整合。
在欧洲,GDPR违规通知要求和新的人工智慧立法强制要求演算法透明化,这些因素共同推动了强劲的需求。主权云端计画正在推动混合部署,资料包保留在区域内,这使得能够提供精细资料驻留控制的供应商受益。拉丁美洲和中东/非洲地区仍处于起步阶段,但已展现出巨大潜力:巴西的银行、沙乌地阿拉伯的智慧城市计划以及南非的通讯业者正在试点人工智慧驱动的NTA(网路终端分析),以应对日益严格的网路安全法规。
其他福利:
- Excel格式的市场预测(ME)表
- 3个月的分析师支持
目录
第一章 引言
- 研究假设和市场定义
- 调查范围
第二章调查方法
第三章执行摘要
第四章 市场情势
- 市场概览
- 市场驱动因素
- NTA 的出现为现代安全堆迭奠定了基础。
- 网路频宽的增加和5G部署造成了可视性差距
- 向云端和混合架构的迁移将增加对云端原生网路终端应用(NTA)的需求。
- 基于机器学习的加密流量检查要求
- 零信任东西向流量激增
- SOC整合推动NTA/NDR整合
- 市场限制
- 威胁和加密技术的快速演变速度超过了工具的进步速度。
- 熟练分析师短缺和解决方案复杂
- 限制深层封包检测的资料隐私法规
- 将预算重新分配给终端/XDR工具
- 产业价值链分析
- 监管环境
- 技术展望
- 产业吸引力-波特五力分析
- 新进入者的威胁
- 买方的议价能力
- 供应商的议价能力
- 替代品的威胁
- 竞争对手之间的竞争
- 影响市场的宏观经济因素
第五章 市场规模及成长预测(数值)
- 按配置
- 本地部署
- 云端基础的
- 杂交种
- 按组件
- 解决方案
- 硬体设备
- 虚拟设备
- SaaS平台
- 服务
- 专业服务
- 託管服务
- 解决方案
- 按组织规模
- 大公司
- 小型企业
- 按最终用户行业划分
- BFSI
- 资讯科技和通讯
- 政府和国防部
- 能源与公共产业
- 零售与电子商务
- 医疗保健和生命科学
- 製造业
- 其他终端用户产业
- 透过使用
- 安全与威胁侦测
- 效能监控与优化
- 合规与政策执行
- 产能规划与预测
- 按地区
- 北美洲
- 美国
- 加拿大
- 墨西哥
- 南美洲
- 巴西
- 阿根廷
- 智利
- 其他南美洲
- 欧洲
- 德国
- 英国
- 法国
- 义大利
- 西班牙
- 俄罗斯
- 其他欧洲地区
- 亚太地区
- 中国
- 印度
- 日本
- 韩国
- 马来西亚
- 新加坡
- 澳洲
- 亚太其他地区
- 中东和非洲
- 中东
- 阿拉伯聯合大公国
- 沙乌地阿拉伯
- 土耳其
- 其他中东地区
- 非洲
- 南非
- 奈及利亚
- 其他非洲地区
- 北美洲
第六章 竞争情势
- 市场集中度
- 策略趋势
- 市占率分析
- 公司简介
- NETSCOUT Systems Inc.
- Cisco Systems Inc.
- Palo Alto Networks Inc.
- SolarWinds Corporation
- Kentik Technologies Inc.
- Dynatrace LLC
- ExtraHop Networks Inc.
- Flowmon Networks AS(Progress)
- GreyCortex sro
- Genie Networks Ltd.
- ManageEngine(Zoho Corp.)
- Plixer LLC
- Nagios Enterprises LLC
- Gigamon Inc.
- Corelight Inc.
- Vectra AI Inc.
- Ixia(Keysight Technologies Inc.)
- Riverbed Technology LLC
- Nozomi Networks Inc.
- Nokia Corporation
第七章 市场机会与未来趋势
- 閒置频段与未满足需求评估
The Network Traffic Analysis Market size is estimated at USD 4.42 billion in 2025, and is expected to reach USD 7.52 billion by 2030, at a CAGR of 11.20% during the forecast period (2025-2030).
Growth reflects the security community's pivot from perimeter defenses to deep traffic visibility as zero-trust programs, 5G rollouts, and cloud-native workloads muddy traditional boundaries. Enterprises see network telemetry as the single source of truth that can uncover lateral movement, encrypted threats, and performance bottlenecks in a hybrid world. Vendors that marry AI-driven analytics with continuous packet capture are winning mindshare as security teams consolidate point tools, while managed detection and response (MDR) services temper the skills gap in small IT shops. At the same time, platform providers are racing to embed encrypted traffic analytics and east-west inspection to keep pace with TLS 1.3 adoption and microservices proliferation.
Global Network Traffic Analysis Market Trends and Insights
Emergence of NTA as Cornerstone in Modern Security Stacks
Seventy percent of advanced persistent threats rely on lateral movement, detectable primarily through granular traffic analytics, prompting security teams to elevate NTA from a nice-to-have tool to a foundational control. Tightly coupling packet analytics with SIEM and XDR cuts mean time to detect by up to 30% relative to siloed tools. Unified telemetry also trims correlation workloads 40-50%, freeing scarce analysts to focus on triage rather than data wrangling. Vendors that deliver open APIs and cloud-scale data lakes now underpin many zero-trust programs, positioning NTA as the fabric that underlies endpoint, identity, and cloud defenses. As a result, platform-first buying behavior is shifting budget from stand-alone probes toward integrated SaaS analytics.
Expanding Network Bandwidth and 5G Rollouts Create Visibility Gaps
The jump to 5G introduces ultra-dense cells, distributed user-plane functions, and multi-access edge computing that overwhelm classic taps and span ports. Private 5G outlays in the United States alone are expected to hit USD 3.7 billion by 2027, yet most existing monitoring stacks cannot ingest containerized traffic or detect millisecond-scale anomalies. Service providers partner with security specialists-T-Mobile's Prisma SASE bundle is a notable example-to pair network slicing with inline threat detection. IoT proliferation further stresses analytics engines because signature-based tools falter against diverse device behaviors, fueling demand for behavior and ML-centric models.
Rapid Evolution of Threats and Encryption Outpacing Tooling
TLS 1.3 encrypts 95% of web traffic and conceals handshake metadata, thwarting legacy DPI. Features such as Encrypted ClientHello and 0-RTT resumption force vendors to pivot toward side-channel inference that relies on timing, sequence lengths, and traffic morphologies. Research prototypes like multi-instance encrypted traffic transformers hit 99% classification accuracy but demand GPU-class horsepower and data science talent that most IT teams lack. Smaller suppliers struggle with R&D costs, creating potential attrition or acquisition.
Other drivers and restraints analyzed in the detailed report include:
- Migration to Cloud and Hybrid Architectures Boosts Demand for Cloud-Native NTA
- Zero-Trust East-West Traffic Proliferation
- Shortage of Skilled Analysts and High Solution Complexity
For complete list of drivers and restraints, kindly check the Table Of Contents.
Segment Analysis
Cloud deployments controlled 51.2% of 2024 revenue, underscoring preference for elastic SaaS analytics that shift capex to opex. The hybrid model is the growth pacesetter, registering a 13.7% CAGR through 2030 as enterprises knit legacy data centers with AWS, Azure, or GCP estates. That blend ensures compliance with data-residency rules while sustaining cloud agility. Zscaler's Traffic Capture service showcases how cloud platforms can export raw traffic to analytics pipelines without saturating on-premises capture appliances.
Enterprises adopting hybrid architectures report lower hardware refresh spend and faster rollout of new inspection features because upgrades are deployed centrally. On-premises probes persist in air-gapped or highly regulated verticals, yet their share of the network traffic analysis market steadily recedes as regulations embrace cloud certification frameworks. Hybrid adoption consequently propels overall network traffic analysis market expansion into greenfield midsize companies that lacked enterprise-class tooling.
Solutions-appliances, virtual sensors, and SaaS consoles-represented 62.4% of the network traffic analysis market size in 2024. However, services are scaling at 14.5% CAGR as organizations offload monitoring and incident response. OPSWAT's buyout of InQuest illustrates how vendors bundle Deep File Inspection and threat intel with managed offerings to address federal-sector needs.
Managed service uptake is a pragmatic response to analyst scarcity and product complexity. Providers supply 24/7 coverage, curated threat feeds, and automated containment, boosting adoption among resource-constrained firms. Hardware sensors retain relevance in 100 Gbps-plus backbones where FPGA acceleration still outperforms virtual appliances. Even so, vendors increasingly position those sensors as data forwarders feeding cloud analytics.
Network Traffic Analysis Market is Segmented by Deployment (On-Premise, Cloud-Based, and Hybrid), Component (Solutions and Services), Organization Size (Large Enterprises and Small and Medium Enterprises), End-User Industry (BFSI, IT and Telecom, and More), and Geography. The Market Sizes and Forecasts are Provided in Value (in USD Million) for all the Above Segments.
Geography Analysis
North America contributed 34.06% of 2024 revenue thanks to strict privacy statutes, early zero-trust adoption, and high cybersecurity budgets. JPMorgan's AI-infused fraud system illustrates regional appetite for packet-driven analytics that accelerate threat identification 300-fold and save USD 200 million annually. State governments likewise embrace observability; Indiana improved citizen services after deploying traffic analytics across multi-cloud infrastructure.
Asia-Pacific is the high-growth engine with a 14.3% CAGR. Massive 5G rollouts in China, India, and South Korea, combined with smart-city investments and rising ransomware incidents, spur NTA adoption. Local regulations such as China's Cybersecurity Law and Australia's Critical Infrastructure Act compel traffic logging and anomaly detection. Manufacturers digitizing shop floors with private cellular networks need granular monitoring to secure OT and IT convergence.
Europe maintains robust demand owing to GDPR's breach notification requirements and emerging AI legislation that mandates algorithmic transparency. Sovereign-cloud initiatives push hybrid deployments so packets stay in-region, benefitting vendors that provide fine-grained data-residency controls. Latin America and the Middle East and Africa remain nascent but promising: Brazilian banks, Saudi smart-city projects, and South African telcos are piloting AI-fueled NTA in anticipation of stricter cyber mandates.
- NETSCOUT Systems Inc.
- Cisco Systems Inc.
- Palo Alto Networks Inc.
- SolarWinds Corporation
- Kentik Technologies Inc.
- Dynatrace LLC
- ExtraHop Networks Inc.
- Flowmon Networks A.S. (Progress)
- GreyCortex s.r.o.
- Genie Networks Ltd.
- ManageEngine (Zoho Corp.)
- Plixer LLC
- Nagios Enterprises LLC
- Gigamon Inc.
- Corelight Inc.
- Vectra AI Inc.
- Ixia (Keysight Technologies Inc.)
- Riverbed Technology LLC
- Nozomi Networks Inc.
- Nokia Corporation
Additional Benefits:
- The market estimate (ME) sheet in Excel format
- 3 months of analyst support
TABLE OF CONTENTS
1 INTRODUCTION
- 1.1 Study Assumptions and Market Definition
- 1.2 Scope of the Study
2 RESEARCH METHODOLOGY
3 EXECUTIVE SUMMARY
4 MARKET LANDSCAPE
- 4.1 Market Overview
- 4.2 Market Drivers
- 4.2.1 Emergence of NTA as cornerstone in modern security stacks
- 4.2.2 Expanding network bandwidth and 5G rollouts create visibility gaps
- 4.2.3 Migration to cloud and hybrid architectures boosts demand for cloud-native NTA
- 4.2.4 Encrypted traffic ML-based inspection requirements
- 4.2.5 Zero-trust east-west traffic proliferation
- 4.2.6 SOC consolidation pushing NTA/NDR convergence
- 4.3 Market Restraints
- 4.3.1 Rapid evolution of threats and encryption outpacing tooling
- 4.3.2 Shortage of skilled analysts and high solution complexity
- 4.3.3 Data-privacy regulations restricting deep packet inspection
- 4.3.4 Budget reallocation toward endpoint/XDR tools
- 4.4 Industry Value Chain Analysis
- 4.5 Regulatory Landscape
- 4.6 Technological Outlook
- 4.7 Industry Attractiveness - Porter's Five Forces Analysis
- 4.7.1 Threat of New Entrants
- 4.7.2 Bargaining Power of Buyers
- 4.7.3 Bargaining Power of Suppliers
- 4.7.4 Threat of Substitutes
- 4.7.5 Intensity of Competitive Rivalry
- 4.8 Impact of Macroeconomic Factors on the Market
5 MARKET SIZE AND GROWTH FORECASTS (VALUES)
- 5.1 By Deployment
- 5.1.1 On-premise
- 5.1.2 Cloud-based
- 5.1.3 Hybrid
- 5.2 By Component
- 5.2.1 Solutions
- 5.2.1.1 Hardware Appliances
- 5.2.1.2 Virtual Appliances
- 5.2.1.3 SaaS Platform
- 5.2.2 Services
- 5.2.2.1 Professional Services
- 5.2.2.2 Managed Services
- 5.2.1 Solutions
- 5.3 By Organization Size
- 5.3.1 Large Enterprises
- 5.3.2 Small and Medium Enterprises (SMEs)
- 5.4 By End-user Industry
- 5.4.1 BFSI
- 5.4.2 IT and Telecom
- 5.4.3 Government and Defense
- 5.4.4 Energy and Utilities
- 5.4.5 Retail and E-commerce
- 5.4.6 Healthcare and Life Sciences
- 5.4.7 Manufacturing
- 5.4.8 Other End-user Industries
- 5.5 By Application
- 5.5.1 Security and Threat Detection
- 5.5.2 Performance Monitoring and Optimization
- 5.5.3 Compliance and Policy Enforcement
- 5.5.4 Capacity Planning and Forecasting
- 5.6 By Geography
- 5.6.1 North America
- 5.6.1.1 United States
- 5.6.1.2 Canada
- 5.6.1.3 Mexico
- 5.6.2 South America
- 5.6.2.1 Brazil
- 5.6.2.2 Argentina
- 5.6.2.3 Chile
- 5.6.2.4 Rest of South America
- 5.6.3 Europe
- 5.6.3.1 Germany
- 5.6.3.2 United Kingdom
- 5.6.3.3 France
- 5.6.3.4 Italy
- 5.6.3.5 Spain
- 5.6.3.6 Russia
- 5.6.3.7 Rest of Europe
- 5.6.4 Asia-Pacific
- 5.6.4.1 China
- 5.6.4.2 India
- 5.6.4.3 Japan
- 5.6.4.4 South Korea
- 5.6.4.5 Malaysia
- 5.6.4.6 Singapore
- 5.6.4.7 Australia
- 5.6.4.8 Rest of Asia-Pacific
- 5.6.5 Middle East and Africa
- 5.6.5.1 Middle East
- 5.6.5.1.1 United Arab Emirates
- 5.6.5.1.2 Saudi Arabia
- 5.6.5.1.3 Turkey
- 5.6.5.1.4 Rest of Middle East
- 5.6.5.2 Africa
- 5.6.5.2.1 South Africa
- 5.6.5.2.2 Nigeria
- 5.6.5.2.3 Rest of Africa
- 5.6.1 North America
6 COMPETITIVE LANDSCAPE
- 6.1 Market Concentration
- 6.2 Strategic Moves
- 6.3 Market Share Analysis
- 6.4 Company Profiles (includes Global level Overview, Market level overview, Core Segments, Financials as available, Strategic Information, Market Rank/Share for key companies, Products and Services, and Recent Developments)
- 6.4.1 NETSCOUT Systems Inc.
- 6.4.2 Cisco Systems Inc.
- 6.4.3 Palo Alto Networks Inc.
- 6.4.4 SolarWinds Corporation
- 6.4.5 Kentik Technologies Inc.
- 6.4.6 Dynatrace LLC
- 6.4.7 ExtraHop Networks Inc.
- 6.4.8 Flowmon Networks A.S. (Progress)
- 6.4.9 GreyCortex s.r.o.
- 6.4.10 Genie Networks Ltd.
- 6.4.11 ManageEngine (Zoho Corp.)
- 6.4.12 Plixer LLC
- 6.4.13 Nagios Enterprises LLC
- 6.4.14 Gigamon Inc.
- 6.4.15 Corelight Inc.
- 6.4.16 Vectra AI Inc.
- 6.4.17 Ixia (Keysight Technologies Inc.)
- 6.4.18 Riverbed Technology LLC
- 6.4.19 Nozomi Networks Inc.
- 6.4.20 Nokia Corporation
7 MARKET OPPORTUNITIES AND FUTURE TRENDS
- 7.1 White-Space and Unmet-Need Assessment
 2026年全球网路流量分析市场报告2026年全球网路流量分析解决方案市场报告
 2026-2030年全球组织网路分析工具市场
 网路流量分析解决方案市场分析及预测(至2035年):按类型、产品类型、服务、技术、组件、应用、流程、部署类型和最终用户划分
 网路流量分析解决方案市场 - 全球产业规模、份额、趋势、机会、预测:按部署类型、用户类型、最终用户、地区和竞争对手划分,2021-2031 年
 网路流量分析市场规模、份额和成长分析(按组件、部署类型、组织规模、最终用户产业和地区划分)-2026-2033年产业预测网路流量分析市场 - 全球产业规模、份额、趋势、机会和预测,按组件、部署模式、组织规模、最终用户、地区和竞争格局细分,2020-2030 年预测
 网路流量分析市场机会、成长动力、产业趋势分析及 2025 - 2034 年预测
 网路流量分析市场规模、份额、趋势分析报告:按组件、部署、组织规模、行业垂直、地区和细分市场进行预测,2025 年至 2030 年
 网路流量分析全球市场规模、份额、趋势分析报告(按组件、按部署类型、按最终用户、按组织规模、按地区、展望和预测,2024-2031 年)