


 |
市场调查报告书
商品编码
1850320
软体定义资料中心:市场占有率分析、产业趋势、统计资料和成长预测(2025-2030 年)Software Defined Data Center - Market Share Analysis, Industry Trends & Statistics, Growth Forecasts (2025 - 2030) |
||||||
※ 本网页内容可能与最新版本有所差异。详细情况请与我们联繫。
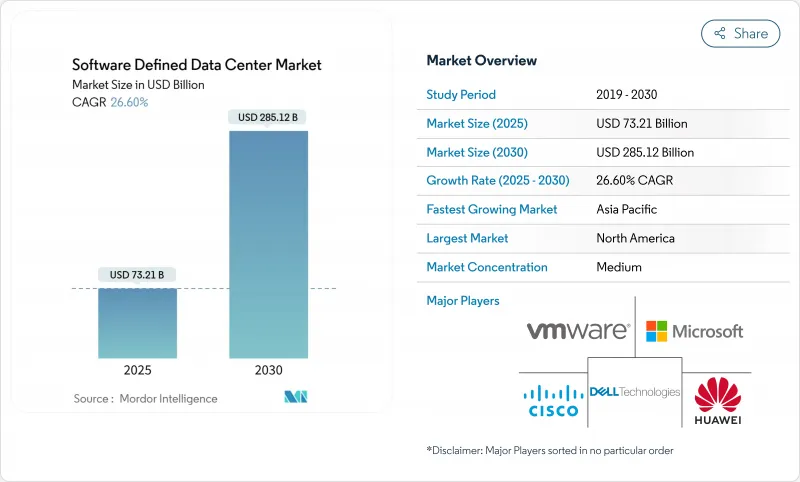
软体定义资料中心市场预计到 2025 年将达到 732.1 亿美元,到 2030 年将达到 2851.2 亿美元。
强劲的发展势头源于企业对敏捷基础设施、云端优先策略以及虚拟化和自动化平台稳步发展的需求。超大规模资料中心的崛起,加上演算法工作负载的快速成长,正推动创纪录的资本支出,并波及到託管和边缘运算服务提供者。对人工智慧驱动的资料中心基础设施管理的持续投资、日益严格的碳排放目标以及用于现场发电的核能微型反应器的出现,进一步重塑了竞争动态。能够将运算、储存和网路统一到策略主导的软体层下的供应商将从传统硬体供应商手中夺取市场份额,而服务合作伙伴则将透过复杂的迁移和託管营运外包收益。
全球软体定义资料中心市场趋势与洞察
降低硬体和资源使用成本
硬体和软体的广泛解耦降低了资本支出并缩短了更新周期。运行全端软体定义资料中心 (SDDC) 平台的公司报告称,部署 VMware Cloud Foundation 后,基础设施成本降低了 34%,三年投资回报率高达 564%。自动化配置提高了资源利用率,使公司能够在不降低效能的前提下,将资料中心占用空间减少 50%。电力和冷却成本的降低也提高了整个全部区域的计划报酬率。
云端运算和虚拟化在企业中蓬勃发展
虚拟化的运算、储存和网路池支援混合策略,既能满足对延迟敏感的工作负载需求,又能兼顾公共云端的弹性。一家金融机构采用软体定义资料中心市场平台,在将其中间件堆迭现代化升级到直觉的 .cloud 平台后,讯息处理速度提升了 40%,停机时间减少了 30%。与虚拟机器并行运行的 Kubernetes 主机简化了 DevOps 流程,并加速了部署。
资料安全与合规的复杂性
欧盟《数位运作弹性法案》等法规要求自2025年1月起加强管控,迫使金融机构检验跨虚拟层的网路弹性。抽象的资源池使得边界防御变得困难,从而推动了对整合金钥管理中心(例如与VMware Sovereign Cloud整合的Fortanix资料安全管理器)的需求。合规性审核延长了计划週期,并增加了咨询成本。
细分市场分析
软体定义资料中心(SD-DC)的软体元件市场规模预计到2025年将达到549亿美元,占总营收的75.4%。编配引擎和基于策略的控制器正以28.4%的复合年增长率成长,这印证了企业对自动化配置的迫切需求。早期采用者在不到12个月的时间内即可实现工作流程自动化和漂移校正的投资回报。随着生态系统的日趋成熟,安全插件、AI观察模组和开发者工具链正在不断扩大其潜在用户群。
剩余份额主要由服务驱动,包括咨询、客製化和全天候运维。服务提供者正在将迁移指南、参考架构和按需收费打包,以简化进入高度监管的垂直市场的流程。硬体创新正朝着可组合设计的方向发展,但仍受软体策略的约束,这进一步巩固了程式码主导基础设施的主导地位。
到2024年,私有实例将占软体定义资料中心市场的41.2%,受到需要保护敏感资料的企业的青睐。 VMware Cloud Foundation就是承包解决方案,它模拟了公共云端的经济效益,同时又维持了在地管治。然而,混合云环境预计将以26.9%的复合年增长率(CAGR)成为成长最快的解决方案,因为企业希望在不放弃沉没资产的情况下,灵活应对激增的工作负载。
Rackspace SDDC Flex 将託管私有云端和超大规模扩充功能整合到一个消费模式中,展现了服务供应商如何模糊部署类别之间的界线。对于云端原生企业而言,仅限公有云的部署仍然至关重要,但即使是这些部署也需要跨区域一致的策略引擎,以避免工具氾滥。
软体定义资料中心市场按元件(解决方案和服务)、部署模式(本地部署、私有云端、公共云端、混合云端)、资料中心类型(託管、超大规模/云端、企业级和边缘运算)、最终用户产业(IT和电信、银行、金融服务和保险、医疗保健、零售及其他)以及地区进行细分。市场预测以美元计价。
区域分析
北美地区将占2024年总收入的47.6%,这主要得益于虚拟化技术的早期应用、深厚的云端生态系以及超大规模云端服务供应商的扩张。德克萨斯州宣布兴建一座核能反应器,标誌着电力合理化方案的创造性转变。资料主权区域监管政策的明朗化促进了美国两国跨境灾害復原合作,而墨西哥的金融科技产业正在扩大其在开放银行计画中的混合应用规模。
亚太地区软体定义资料中心市场预计到2030年将以28.23%的复合年增长率成长,主要驱动力包括主权云端津贴、电子商务的蓬勃发展以及数位银行的牌照发放。超大规模资料中心营运商正在批量租赁容量,但需要依赖第三方开发人员来获取土地、电力和授权。新加坡凭藉着营运商密集的园区,并采用新型液冷技术来满足电力需求,持续维持其中心地位。印度、日本和中国正在建造千兆瓦级园区,而澳洲则支援边缘部署,以适应远端挖矿作业。
欧洲正积极拥抱软体定义资料中心(SDDC),以回应主权和碳排放目标。 DORA设定的2025年1月最后期限促使金融机构加强网路韧性,并增加加密租户层级网路覆盖的预算。北方市场在采用SDDC方面处于领先地位,而南方国家则透过公共云端着陆区和绿色氢能试点计画加速推进。在中东和非洲,阿联酋和沙乌地阿拉伯的活动正在兴起,这些国家将公用事业规模的太阳能发电厂与模组化资料中心结合,用于清洁能源託管。
其他福利:
- Excel格式的市场预测(ME)表
- 3个月的分析师支持
目录
第一章 引言
- 研究假设和市场定义
- 调查范围
第二章调查方法
第三章执行摘要
第四章 市场情势
- 市场概览
- 市场驱动因素
- 降低硬体和资源使用成本
- 企业中云端运算与虚拟化的蓬勃发展
- 超融合和组合式基础架构的兴起
- AI驱动的资料中心基础设施管理(DCIM)数位双胞胎优化(鲜为人知)
- 核微型反应器(在不为人知的情况下)实现了机架级高密度运行
- 5G 站点边缘原生微型 SDDC编配(悄悄进行)
- 市场限制
- 资料安全与合规的复杂性
- 传统系统整合与迁移成本
- 电网电力短缺和併网延迟(不明显)
- 供应商整合/整体拥有成本风险增加(并不明显)
- 供应链分析
- 监管格局
- 技术展望
- 波特五力分析
- 新进入者的威胁
- 买方的议价能力
- 供应商的议价能力
- 替代品的威胁
- 竞争对手之间的竞争
- 对宏观经济趋势的市场评估
第五章 市场规模与成长预测
- 按组件
- 解决方案(SDN、SDS、SDC、自动化和编配安全)
- 服务(咨询与整合、管理、训练与支援)
- 按部署模式
- 本地部署
- 私有云端
- 公共云端
- 混合云端
- 依资料中心类型
- 搭配
- 超大规模资料中心业者云
- 企业和边缘运算
- 最终用户
- 资讯科技和通讯
- BFSI
- 卫生保健
- 零售与电子商务
- 製造业
- 政府和国防部
- 媒体与娱乐
- 能源和公共产业
- 其他最终用户
- 按地区
- 北美洲
- 美国
- 加拿大
- 墨西哥
- 欧洲
- 英国
- 德国
- 法国
- 义大利
- 西班牙
- 其他欧洲地区
- 亚太地区
- 中国
- 日本
- 印度
- 新加坡
- 澳洲
- 马来西亚
- 其他亚太地区
- 南美洲
- 巴西
- 智利
- 阿根廷
- 其他南美
- 中东和非洲
- 中东
- 阿拉伯聯合大公国
- 沙乌地阿拉伯
- 土耳其
- 其他中东地区
- 非洲
- 南非
- 奈及利亚
- 其他非洲国家
- 北美洲
第六章 竞争情势
- 市场集中度
- 策略趋势
- 市占率分析
- 公司简介
- VMware Inc.
- Microsoft Corp.
- Dell Technologies
- Cisco Systems
- Hewlett Packard Enterprise
- IBM Corp.
- Huawei Technologies
- Oracle Corp.
- Citrix Systems
- NEC Corp.
- Nutanix Inc.
- Amazon Web Services
- Google Cloud Platform
- Broadcom(VMware division)
- Juniper Networks
- Arista Networks
- Red Hat(IBM)
- Equinix Inc.
- Lenovo Group
- Rackspace Technology
第七章 市场机会与未来展望
The software-defined data center market size is expected to be valued at USD 73.21 billion in 2025 and is forecast to reach USD 285.12 billion by 2030, reflecting a vigorous 26.6% CAGR over the period.
Strong momentum comes from enterprise demand for agile infrastructure, cloud-first strategies, and steady advances in virtualization and automation platforms. Hyperscaler build-outs, coupled with rapid algorithmic workloads, are prompting record capital spending that spills over to colocation and edge operators. Sustained investment in AI-enabled data center infrastructure management, stricter carbon targets, and the arrival of nuclear micro-reactors for on-site generation further reshape competitive dynamics. Vendors able to unify compute, storage, and networking under policy-driven software layers are capturing wallet share from legacy hardware suppliers, while service partners monetize complex migration and managed operations mandates.
Global Software Defined Data Center Market Trends and Insights
Cost reduction in hardware and resource use
Widespread decoupling of hardware and software lowers capital outlays and shrinks refresh cycles. Enterprises running full-stack SDDC platforms report infrastructure cost savings of 34% and a 564% three-year ROI on VMware Cloud Foundation deployments. Automated provisioning tightens utilization, letting firms cut data center footprints by 50% without performance degradation. Lower power and cooling bills compound the benefit, reinforcing project paybacks across regions.
Cloud and virtualization boom among enterprises
Virtualized compute, storage, and network pools underpin hybrid strategies that reconcile latency-sensitive workloads with public-cloud elasticity. Financial institutions using software defined data center market platforms achieved 40% faster message processing and 30% less downtime after modernizing middleware stacks intuitive.cloud. Kubernetes-ready hosts run side by side with virtual machines, simplifying DevOps pipelines and hastening rollouts.
Data-security and compliance complexities
Regulations such as the EU Digital Operational Resilience Act mandate tighter controls from January 2025, pushing financial institutions to verify cyber resilience across virtual layers. Abstracted resource pools challenge perimeter defenses, driving demand for unified key-management hubs like Fortanix Data Security Manager that integrate with VMware Sovereign Cloud. Compliance audits prolong project timelines and raise consulting spend.
Other drivers and restraints analyzed in the detailed report include:
- Hyper-converged and composable infrastructure uptake
- AI-driven DCIM and digital-twin optimisation
- Legacy integration and migration costs
For complete list of drivers and restraints, kindly check the Table Of Contents.
Segment Analysis
The software-defined data center market size for software components reached USD 54.9 billion in 2025, equating to 75.4% of overall revenue. Orchestration engines and policy-based controllers are expanding at a 28.4% CAGR, underlining enterprise appetite for hands-free provisioning. Early adopters record sub-12-month paybacks on workflow automation and drift remediation. Security plug-ins, AI observability modules, and developer tool chains widen the addressable base as ecosystems mature.
Services contribute the remaining share, encompassing advisory, customization, and 24X7 managed operations. Providers bundle migration playbooks, reference architectures, and consumption-based billing to ease entry for heavily regulated verticals. Hardware innovations shift toward composable designs but stay governed by software policies, reinforcing the primacy of code-driven infrastructure.
Private instances captured 41.2% of the software-defined data center market in 2024, favored by organizations securing sensitive data. VMware Cloud Foundation exemplifies turnkey stacks that mimic public-cloud economies while retaining on-premises governance. Hybrid estates, however, are projected to post the highest 26.9% CAGR as firms seek elasticity for spiky workloads without abandoning sunk assets.
Rackspace SDDC Flex merges hosted private clouds with hyperscale extensions under a consumption model, illustrating how service providers blur deployment categories. Public-only footprints remain relevant for cloud-native firms, yet even they demand consistent policy engines across zones to avoid tool sprawl.
Software Defined Data Center Market is Segmented by Component (Solutions and Services), Deployment Model (On-Premises, Private Cloud, Public Cloud, and Hybrid Cloud), Data Center Type ( Colocation, Hyperscalers/ Cloud, and Enterprise and Edge), End-User Vertical (IT and Telecom, BFSI, Healthcare, Retail, and More), and by Geography. The Market Forecasts are Provided in Terms of Value (USD).
Geography Analysis
North America generated 47.6% of 2024 revenue, a consequence of early virtualization adoption, deep cloud ecosystems, and hyperscaler expansion corridors. Nuclear micro-reactor announcements in Texas signal creative approaches to power adequacy. Regulatory clarity around data-sovereignty zones fuels cross-border disaster-recovery pairings between the United States and Canada, while Mexico's fintech sector ramps up hybrid footprints for open-banking initiatives.
The Asia-Pacific software-defined data center market will rise at a 28.23% CAGR to 2030, aided by sovereign cloud grants, e-commerce surges, and digital-bank licensing rounds. Hyperscalers lease bulk capacity yet still rely on third-party developers to secure land, power, and permits. Singapore maintains hub status through carrier-dense campuses employing novel liquid cooling to meet power caps. India, Japan, and China inaugurate gigawatt-scale campuses, while Australia backs edge rollouts to serve remote mining operations.
Europe adopts SDDC in response to sovereignty and carbon targets. DORA's January 2025 deadline is spurring financial institutions to harden cyber-resilience, expanding budgets for encrypted per-tenant overlays. Northern markets lead in adoption, and southern states accelerate via public-cloud landing zones and green-hydrogen pilots. The Middle East and Africa see rising activity in the UAE and Saudi Arabia, where utility-scale solar farms couple with modular data halls for clean-energy hosting.
- VMware Inc.
- Microsoft Corp.
- Dell Technologies
- Cisco Systems
- Hewlett Packard Enterprise
- IBM Corp.
- Huawei Technologies
- Oracle Corp.
- Citrix Systems
- NEC Corp.
- Nutanix Inc.
- Amazon Web Services
- Google Cloud Platform
- Broadcom (VMware division)
- Juniper Networks
- Arista Networks
- Red Hat (IBM)
- Equinix Inc.
- Lenovo Group
- Rackspace Technology
Additional Benefits:
- The market estimate (ME) sheet in Excel format
- 3 months of analyst support
TABLE OF CONTENTS
1 INTRODUCTION
- 1.1 Study Assumptions and Market Definition
- 1.2 Scope of the Study
2 RESEARCH METHODOLOGY
3 EXECUTIVE SUMMARY
4 MARKET LANDSCAPE
- 4.1 Market Overview
- 4.2 Market Drivers
- 4.2.1 Cost reduction in hardware and resource use
- 4.2.2 Cloud and virtualization boom among enterprises
- 4.2.3 Hyper-converged and composable infrastructure uptake
- 4.2.4 AI-driven DCIM and digital-twin optimisation (under-radar)
- 4.2.5 Nuclear micro-reactors unlocking rack-level densities (under-radar)
- 4.2.6 Edge-native micro-SDDC orchestration at 5G sites (under-radar)
- 4.3 Market Restraints
- 4.3.1 Data-security and compliance complexities
- 4.3.2 Legacy integration and migration costs
- 4.3.3 Grid-power scarcity and interconnect delays (under-radar)
- 4.3.4 Increased vendor consolidation/TCO risk (under-radar)
- 4.4 Supply-Chain Analysis
- 4.5 Regulatory Landscape
- 4.6 Technological Outlook
- 4.7 Porter's Five Forces Analysis
- 4.7.1 Threat of New Entrants
- 4.7.2 Bargaining Power of Buyers
- 4.7.3 Bargaining Power of Suppliers
- 4.7.4 Threat of Substitutes
- 4.7.5 Intensity of Competitive Rivalry
- 4.8 Assessment of Macro Economic Trends on Market
5 MARKET SIZE AND GROWTH FORECASTS (VALUE)
- 5.1 By Component
- 5.1.1 Solutions (SDN, SDS, SDC, Automation and Orchestration Security)
- 5.1.2 Services (Consulting and Integration, Managed, Training and Support)
- 5.2 By Deployment Model
- 5.2.1 On-Premises
- 5.2.2 Private Cloud
- 5.2.3 Public Cloud
- 5.2.4 Hybrid Cloud
- 5.3 By Data Center Type
- 5.3.1 Colocation
- 5.3.2 Hyperscalers/Cloud
- 5.3.3 Enterprise and Edge
- 5.4 By End-user Vertical
- 5.4.1 IT and Telecom
- 5.4.2 BFSI
- 5.4.3 Healthcare
- 5.4.4 Retail and E-Commerce
- 5.4.5 Manufacturing
- 5.4.6 Government and Defense
- 5.4.7 Media and Entertainment
- 5.4.8 Energy and Utilities
- 5.4.9 Other End Users
- 5.5 By Geography
- 5.5.1 North America
- 5.5.1.1 United States
- 5.5.1.2 Canada
- 5.5.1.3 Mexico
- 5.5.2 Europe
- 5.5.2.1 United Kingdom
- 5.5.2.2 Germany
- 5.5.2.3 France
- 5.5.2.4 Italy
- 5.5.2.5 Spain
- 5.5.2.6 Rest of Europe
- 5.5.3 Asia-Pacific
- 5.5.3.1 China
- 5.5.3.2 Japan
- 5.5.3.3 India
- 5.5.3.4 Singapore
- 5.5.3.5 Australia
- 5.5.3.6 Malaysia
- 5.5.3.7 Rest of Asia-Pacific
- 5.5.4 South America
- 5.5.4.1 Brazil
- 5.5.4.2 Chile
- 5.5.4.3 Argentina
- 5.5.4.4 Rest of South America
- 5.5.5 Middle East and Africa
- 5.5.5.1 Middle East
- 5.5.5.1.1 United Arab Emirates
- 5.5.5.1.2 Saudi Arabia
- 5.5.5.1.3 Turkey
- 5.5.5.1.4 Rest of Middle East
- 5.5.5.2 Africa
- 5.5.5.2.1 South Africa
- 5.5.5.2.2 Nigeria
- 5.5.5.2.3 Rest of Africa
- 5.5.1 North America
6 COMPETITIVE LANDSCAPE
- 6.1 Market Concentration
- 6.2 Strategic Moves
- 6.3 Market Share Analysis
- 6.4 Company Profiles (includes Global level Overview, Market level overview, Core Segments, Financials as available, Strategic Information, Market Rank/Share for key companies, Products and Services, and Recent Developments)
- 6.4.1 VMware Inc.
- 6.4.2 Microsoft Corp.
- 6.4.3 Dell Technologies
- 6.4.4 Cisco Systems
- 6.4.5 Hewlett Packard Enterprise
- 6.4.6 IBM Corp.
- 6.4.7 Huawei Technologies
- 6.4.8 Oracle Corp.
- 6.4.9 Citrix Systems
- 6.4.10 NEC Corp.
- 6.4.11 Nutanix Inc.
- 6.4.12 Amazon Web Services
- 6.4.13 Google Cloud Platform
- 6.4.14 Broadcom (VMware division)
- 6.4.15 Juniper Networks
- 6.4.16 Arista Networks
- 6.4.17 Red Hat (IBM)
- 6.4.18 Equinix Inc.
- 6.4.19 Lenovo Group
- 6.4.20 Rackspace Technology
7 MARKET OPPORTUNITIES AND FUTURE OUTLOOK
- 7.1 White-space and Unmet-need Assessment
 资料中心虚拟化市场按技术类型、部署模式、最终用户产业、伺服器类型、服务类型和组织规模划分 - 全球预测 2025-2032
 软体定义资料中心市场机会、成长动力、产业趋势分析及 2025 - 2034 年预测2025 年至 2033 年资料中心虚拟市场规模、份额和趋势分析(按类型、组件、服务、企业规模、最终用途、地区和细分趋势)
 全球软体定义资料中心(SDDC)市场:依产品、组织规模、最终用户产业、地区、机会和预测,2018-2032全球软体定义资料中心市场规模、份额和趋势分析:按组件、类型、部署、企业规模、最终用途、地区和细分市场,预测 2025-2033 年
 2032 年软体定义资料中心市场预测:按类型、组件、组织规模、部署类型、最终用户和地区进行的全球分析
 全球软体定义资料中心市场规模(按组件、服务、部署模型、区域覆盖范围和预测):全球资料中心虚拟化市场研究报告 - 产业分析、规模、份额、成长、趋势及 2025 年至 2033 年预测
 全球资料中心虚拟市场规模、份额、趋势分析报告:2025 年至 2032 年按组件、组织规模、类型、最终用途和地区分類的展望和预测
 2025 年全球软体定义资料中心市场报告