


 |
市场调查报告书
商品编码
1850355
固定线路通讯:市场占有率分析、产业趋势、统计数据和成长预测(2025-2030 年)Fixed-Line Communications - Market Share Analysis, Industry Trends & Statistics, Growth Forecasts (2025 - 2030) |
||||||
※ 本网页内容可能与最新版本有所差异。详细情况请与我们联繫。
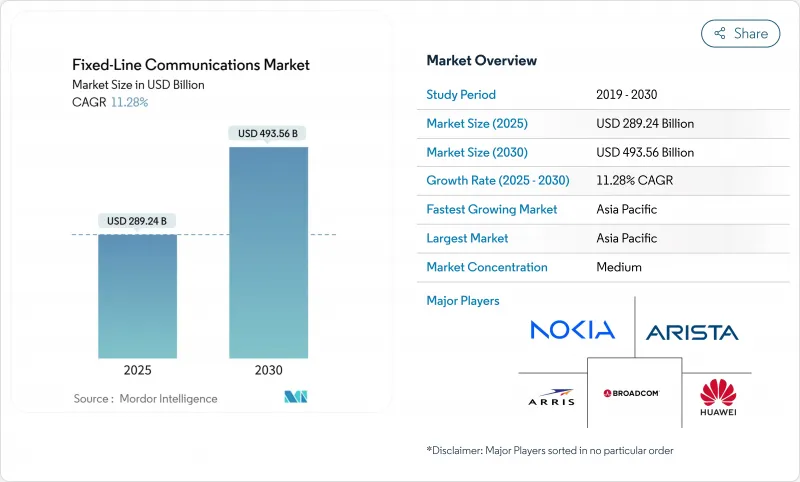
预计到 2025 年,固定线路通讯市场规模将达到 2,892.4 亿美元,到 2030 年将达到 4,935.6 亿美元,在此期间的复合年增长率为 11.28%。
持续成长反映了固定通讯市场如何支援云端运算、人工智慧工作负载和5G回程传输需求,巩固了其作为基础数位基础设施的地位。欧盟、美国和亚太地区多个国家政府采纳的对称Gigabit目标持续加速光纤部署,而资料主权规则则鼓励企业将对延迟敏感的流量保留在国家网路内。超大规模资料中心的快速建设给传统骨干网路带来了压力,促使营运商进行800G和Terabit光纤升级,并增加了设备需求。同时,开放标准倡议和软体定义网路正在将竞争优势从硬体能力转移到可编程平台,为能够满足低延迟服务等级承诺的新供应商创造了机会。监管机构不断施压以简化道路使用许可流程,这表明,固定通讯市场能否迅速满足潜在需求,将取决于其普及速度,而非最终用户的意愿。
全球固定通讯市场趋势与洞察
城市丛集对Gigabit宽频的需求日益增长
主要亮点
- 远距办公、多流 4K 视讯和云端游戏使得千兆Gigabit服务成为大城市的基本需求。营运商再也不能依赖曾经抑制容量成本的超额订阅规则。相反,他们正在多用户住宅深处部署对称光纤,以确保高吞吐量路径。混合用途建筑中的企业租户也要求保证上行链路速度,用于云端备份和视讯协作,这使得通讯业者能够捆绑高级服务等级协定 (SLA),并提高每用户平均收益。人口密集的地区缩短了光纤建设的投资回收期,促使营运商采取积极的促销定价策略,以在 5G 固定无线替代方案普及之前抢占市场份额。市政数位股权政策透过为低收入家庭提供网路连线补贴,进一步促进了光纤的普及,并在光纤部署后间接提高了高级连线套餐的普及率。
现有营运商和OrtoNet正在大规模部署光纤到户服务。
随着AT&T承诺在2026年前为3,000万户家庭提供光纤到府(FTTH)服务,现有通讯业者正从逐步升级铜缆转向全面光纤替换。一项极具挑战性的替代网路计画(altonet)在基础设施资金的支持下,正积极拓展服务不足的郊区,迫使急于维护自身网路覆盖的传统营运商加快行动。美国的BEAD计画等补贴计画正将数十亿美元投入农村地区建设,进一步降低了成本,使深层光纤部署更具优势。更快的部署技术(例如微沟槽挖掘、连接式光纤接入)结合管道再利用,即使在中等密度地区也能降低每户的资本支出,并保持可观的内部收益率。从长远来看,建立无所不在的光纤平台将使营运商能够提升销售边缘运算託管和私有5G服务。
最后一公里光纤建设:高资本投入和较长的投资回报週期
在农村地区,光纤入户的成本可能超过1,000美元,在岩石或山区,成本还会更高。规模较小的通讯业者缺乏规模经济,资金筹措成本显着更高,而且其债务契约通常限制了网路部署进度。当施工人员需要在电线电线杆安装光纤时,关于前期准备和安装费用的法律纠纷会导致数月延误。认证光纤连接器的薪资上涨也使问题更加复杂,有些市场甚至提供以前只有行动网路工程师才能获得的签约奖金。虽然政府补贴有助于降低部分建设成本,但供应商和技术的限制会进一步推高计划总成本,超出投资者通常的投资回收期。
细分市场分析
光纤电缆巩固了其作为固定线路通讯市场骨干网路的地位,预计到2024年将占总收入的28.3%。对800G连贯传输日益增长的需求正推动营运商加快外部线路升级,相关的光线路终端和被动分路器也推动接入设备支出以13.9%的复合年增长率成长。随着营运商用可插拔光缆取代传统的100G光缆,传输设备供应商从中受益,因为可插拔光缆可将每位元功耗降低一半,从而提高整体网路效率。随着软体定义控制平面对中心局高效能叶脊式网路架构的需求,交换设备收益也将同步成长。
随着家庭用户普遍采用 Wi-Fi 7 路由器和网状网路节点,用户端设备 (CPE) 也持续迈向Gigabit网路时代。供应商现在将託管式 Wi-Fi 分析功能与 CPE 捆绑销售,使营运商能够远端排查家庭网路效能问题,从而减少上门服务次数。同时,固定无线 CPE 的出货量将在 2024 年超过 DOCSIS 数据机,这表明即使光纤网路继续主导通讯网路市场,无线方案也能在某些部署场景中占据优势。
到2024年,固定宽频资讯服务将占总收入的68.9%,这证实了按分钟收费向频宽收益的不可逆转的转变。 IPTV和其他增值平台将紧随其后,复合年增长率将达到12.4%,反映出营运商正在将其光纤投资转化为内容和云端游戏的经常性收益。随着企业转向云端PBX服务,家庭用户完全依赖行动设备,传统固定语音正稳步下滑。
将网路连线、网路安全和编配结合的託管服务套件正日益受到欢迎,尤其是在没有内部 IT 团队的中型企业中。由网路内 AI 引擎驱动的影片分析能够实现精准广告投放,在无需额外资本支出的情况下提高净利率。
固定线路通讯市场报告按产品类型(传输设备、交换设备、其他)、服务类型(固定语音、固定宽频数据、其他)、技术(数位用户线路、同轴电缆(Docsis)、其他)、最终用户(住宅用户、中小企业、大型企业、其他)和地区进行细分。
区域分析
预计亚太地区将巩固其作为全球最大通讯市场的地位,到2024年将占全球收入的38.7%,年复合成长率达11.42%。中国10G城市网路的强制性建设将推动全国范围内的光纤部署,而印度的「数位印度」(Digital Bharat)计画将促使公私合营企业每年新增超过50万公里的线路。日本和韩国的营运商将升级到25G和50G PON,以支援沉浸式媒体和工业自动化。
在北美,BEAD计划正在帮助缩小农村地区的网路差距。一级营运商正在加快都市区的网路建设,并与卫星宽频营运商竞争,以获取长期用户。 Verizon固定无线用户的成长凸显了替代风险,但随着电线杆安装改革缩短了许可等待时间,光纤部署量创下以季度为基础新高。加拿大的开放接取规则迫使现有业者批发光纤环路,从而促进了零售竞争,在不损害网路所有者经济利益的前提下刺激了收购率。
欧洲的《Gigabit基础设施法案》将透过简化沟槽核准和实施「一次挖掘」调整措施,使土木工程成本降低两位数。法国和西班牙的光纤到户(FTTH)普及率已超过75%,显示一旦Gigabit服务普及,市场需求将保持强劲。德国起步缓慢,但在私人企业Altonet的支持下,发展速度加快;英国的「Gigabit计划」竞标正在将网路覆盖范围扩展到偏远乡村。
其他福利:
- Excel格式的市场预测(ME)表
- 3个月的分析师支持
目录
第一章 引言
- 研究假设和市场定义
- 调查范围
第二章调查方法
第三章执行摘要
第四章 市场情势
- 市场概览
- 市场驱动因素
- 都市区丛集对Gigabit宽频的需求日益增长
- 现有营运商和OrtoNet公司大规模部署FTTH(光纤到府)网络
- 云端/超大规模资料中心回程传输需求
- 政府普遍服务和补贴计划(BEAD、RDOF、欧盟CEF-2)
- 重复利用传统铜管可降低土木工程成本(未经充分通报)
- 边缘运算密集化需要超低延迟的固定连结(未充分通报)
- 市场限制
- 最后一公里光纤铺设需要高资本投入和较长的投资回收期。
- 5G FWA 与卫星宽频之间的替代风险
- 光纤熔接和测试领域技术纯熟劳工短缺
- 市政道路通行权和电线杆安装延误(漏报)
- 价值链分析
- 监管格局
- 技术展望
- 波特五力分析
- 新进入者的威胁
- 买方的议价能力
- 供应商的议价能力
- 替代品的威胁
- 竞争对手之间的竞争
- 投资分析
第五章 市场规模与成长预测
- 依产品类型
- 传动设备
- 开关设备
- 接取设备(DSLAM、OLT 等)
- 用户端设备(路由器、机上盒、光网路终端)
- 光纤电缆
- 其他的
- 按服务类型
- 固定语音
- 固定宽频数据
- IPTV/附加价值服务
- 依技术
- 数位用户线路
- 同轴(Docsis)
- 光纤(FTTx/FTTH)
- 混合光纤同轴
- 最终用户
- 住宅
- 小型企业
- 大公司
- 政府和公共部门
- 资料中心
- 按地区
- 北美洲
- 美国
- 加拿大
- 墨西哥
- 南美洲
- 巴西
- 阿根廷
- 其他南美
- 欧洲
- 德国
- 英国
- 法国
- 俄罗斯
- 其他欧洲地区
- 亚太地区
- 中国
- 印度
- 日本
- 韩国
- ASEAN
- 其他亚太地区
- 中东和非洲
- 中东
- 沙乌地阿拉伯
- 阿拉伯聯合大公国
- 土耳其
- 其他中东地区
- 非洲
- 南非
- 奈及利亚
- 其他非洲国家
- 北美洲
第六章 竞争情势
- 市场集中度
- 策略趋势
- 市占率分析
- 公司简介
- Huawei Technologies Co. Ltd
- Cisco Systems Inc.
- Nokia Corp.
- ZTE Corp.
- Broadcom Inc.
- Arris(CommScope)
- Arista Networks Inc.
- Avaya Inc.
- Allied Telesis Inc.
- Corning Inc.
- Prysmian Group
- Adtran Inc.
- Calix Inc.
- DZS Inc.
- Ribbon Communications
- Telefonaktiebolaget LM Ericsson
- Juniper Networks Inc.
- FiberHome Telecommunication
- CommScope Holding Co.
- NEC Corp.
第七章 市场机会与未来展望
The fixed-line communications market size reaches USD 289.24 billion in 2025 and is forecast to touch USD 493.56 billion by 2030, advancing at an 11.28% CAGR over the period.
Sustained growth reflects how the fixed-line communications market underpins cloud computing, artificial intelligence workloads, and 5G back-haul requirements, cementing its role as foundational digital infrastructure. Symmetric gigabit targets adopted by the European Union, the United States, and multiple Asia-Pacific governments continue to accelerate fiber roll-outs, while data-sovereignty rules spur enterprises to keep latency-sensitive traffic on national networks. Rapid hyperscale data-center construction strains legacy backbones, pushing operators toward 800 G and terabit optical upgrades that lift equipment demand. In parallel, open-standards initiatives and software-defined networking shift competitive advantage from hardware features toward programmable platforms, creating opportunities for new vendors that can match low-latency service-level commitments. Mounting regulatory pressure to streamline right-of-way permits suggests that deployment speed, not end-user appetite, will determine how fast the fixed-line communications market captures its addressable demand.
Global Fixed-Line Communications Market Trends and Insights
Rising demand for gigabit-speed broadband in urban clusters
Key Highlights
- Remote work, multi-stream 4K video, and cloud gaming have made multi-gigabit service a baseline expectation in major cities. Operators can no longer rely on oversubscription rules that once kept capacity costs in check; instead, they push symmetric fiber deeper into apartment blocks to guarantee high-throughput paths. Enterprise tenants in mixed-use buildings additionally request guaranteed uplink speeds for cloud backup and video collaboration, allowing carriers to bundle premium SLAs at higher average revenue per user. Dense geography shortens fiber build paybacks, encouraging aggressive promotional pricing that locks in market share before 5G fixed-wireless alternatives gain traction. Municipal digital-equity policies further amplify adoption by underwriting low-income household connections, indirectly boosting take rates for premium tiers once the fiber is in place.
Massive fiber-to-the-home roll-outs by incumbents and altnets
Incumbent telcos have shifted from incremental copper upgrades to full-scale fiber replacement, as seen in AT&T's pledge to pass 30 million premises with FTTH by 2026. Challenger altnets, backed by infrastructure funds, pick off pockets of under-served suburbs, forcing faster reactions from legacy operators eager to defend their base. Subsidy frameworks such as BEAD in the United States redirect billions toward rural builds, further tilting the cost equation in favor of deep fiber. The combination of faster deployment techniques (micro-trenching, connectorized drops) and duct re-use lowers capex per home, keeping internal rates of return attractive even in mid-density territories. Longer term, establishing a ubiquitous fiber platform positions carriers to upsell edge-compute hosting and private 5G services.
High capex and long ROI cycles for last-mile fiber
Passing a single rural premise can cost more than USD 1,000, a figure that climbs sharply in rocky or mountainous terrain. Smaller carriers without scale economics shoulder significantly higher financing costs, and their debt covenants often dictate slower roll-out schedules. Where crews must attach fiber to utility poles, make-ready work and legal disputes over attachment fees add months of delay. Wage inflation for certified fiber splicers compounds the problem, with some markets offering signing bonuses that previously only mobile-network engineers received. Although government grants defray part of the build expense, restrictions on permissible vendors or technology can push total project cost back up, stretching payback periods beyond typical investor horizons.
Other drivers and restraints analyzed in the detailed report include:
- Cloud/hyperscale data-center back-haul requirements
- Government universal-service and subsidy programs (BEAD, RDOF, EU CEF-2)
- Substitution risk from 5G fixed-wireless and satellite broadband
For complete list of drivers and restraints, kindly check the Table Of Contents.
Segment Analysis
Fiber-optic cables generated 28.3% of revenue in 2024, cementing their position as the volume backbone of the fixed-line communications market. Intensifying demand for 800 G coherent transmission pushes operators to accelerate outside-plant upgrades, while associated optical line terminals and passive splitters lift access-equipment spend at a 13.9% CAGR. Transmission-equipment vendors benefit as carriers swap legacy 100 G optics for pluggables that halve power per bit, enhancing total network efficiency. Switching gear revenue expands in tandem because software-defined control planes require high-performance leaf-spine fabrics inside central offices.
Customer-premises equipment continues to ride the multi-gigabit wave as households adopt Wi-Fi 7 routers and mesh nodes. Vendors now bundle managed Wi-Fi analytics that let carriers troubleshoot in-home performance remotely, reducing truck rolls. Meanwhile, fixed-wireless CPE shipments overtook DOCSIS modems in 2024, showing that wireless substitution can capture specific deployment scenarios even as the fixed-line communications market size for fiber remains dominant.
Fixed broadband data services accounted for 68.9% of total 2024 revenue, confirming the irreversible pivot from minutes-based billing to bandwidth monetization. IPTV and other value-added platforms follow with a 12.4% CAGR, reflecting how carriers translate sunk fiber investments into recurring content and cloud-gaming revenue. Traditional fixed voice continues its secular slide as enterprises migrate to cloud PBX offerings and households rely exclusively on mobile.
Managed service bundles that merge connectivity with cybersecurity and edge-compute orchestration gain favor, especially among mid-sized enterprises lacking in-house IT teams. Enhanced video analytics powered by on-network AI engines enable ultra-targeted advertising, adding incremental margins without additional capex.
The Fixed-Line Communication Market Report is Segmented by Product Type (Transmission Equipment, Switching Equipment, and More), Service Type (Fixed Voice, Fixed Broadband Data, and More), Technology (Digital Subscriber Line, Coaxial (Docsis), and More), End User (Residential, Small and Medium Enterprises, Large Enterprises, and More), and Geography.
Geography Analysis
Asia Pacific retained 38.7% of 2024 revenue and is projected to expand at an 11.42% CAGR, cementing its position as the largest fixed-line communications market. China's mandate for 10 G city networks drives nationwide fiber deployment, while India's Digital Bharat program triggers public-private joint ventures that add more than 0.5 million route-kilometers annually. Japanese and Korean operators upgrade to 25 G and 50 G PON to support immersive media and industrial automation.
North America leverages the BEAD program to close rural gaps. Tier-1 carriers accelerate urban builds, racing satellite broadband players to lock in long-term subscribers. Verizon's fixed-wireless subscriber gains highlight substitution risk, yet fiber build counts hit new quarterly highs as pole-attachment reforms shorten permitting queues. Canadian open-access rules compel incumbents to wholesale fiber loops, fostering retail competition that stimulates take-rates without eroding network-owner economics.
Europe's Gigabit Infrastructure Act streamlines trenching approvals and enforces "dig-once" coordination, cutting civil-works costs by double digits. France and Spain now post FTTH take-up rates above 75%, proving demand elasticity once ubiquitous gigabit service is available. Germany's late start accelerates on the back of private-equity-funded altnets, while the United Kingdom's Project Gigabit auctions extend coverage to hard-to-reach hamlets.
- Huawei Technologies Co. Ltd
- Cisco Systems Inc.
- Nokia Corp.
- ZTE Corp.
- Broadcom Inc.
- Arris (CommScope)
- Arista Networks Inc.
- Avaya Inc.
- Allied Telesis Inc.
- Corning Inc.
- Prysmian Group
- Adtran Inc.
- Calix Inc.
- DZS Inc.
- Ribbon Communications
- Telefonaktiebolaget LM Ericsson
- Juniper Networks Inc.
- FiberHome Telecommunication
- CommScope Holding Co.
- NEC Corp.
Additional Benefits:
- The market estimate (ME) sheet in Excel format
- 3 months of analyst support
TABLE OF CONTENTS
1 INTRODUCTION
- 1.1 Study Assumptions and Market Definition
- 1.2 Scope of the Study
2 RESEARCH METHODOLOGY
3 EXECUTIVE SUMMARY
4 MARKET LANDSCAPE
- 4.1 Market Overview
- 4.2 Market Drivers
- 4.2.1 Rising demand for gigabit-speed broadband in urban clusters
- 4.2.2 Massive fiber-to-the-home (FTTH) roll-outs by incumbents and altnets
- 4.2.3 Cloud/hyperscale data-center back-haul requirements
- 4.2.4 Government universal-service and subsidy programs (BEAD, RDOF, EU CEF-2)
- 4.2.5 Repurposing of legacy copper ducts lowers civil-works cost (under-reported)
- 4.2.6 Edge-compute densification needs ultra-low-latency fixed links (under-reported)
- 4.3 Market Restraints
- 4.3.1 High capex and long ROI cycles for last-mile fiber
- 4.3.2 Substitution risk from 5G FWA and satellite broadband
- 4.3.3 Skilled-labor shortages for fiber splicing and testing
- 4.3.4 Municipal right-of-way and pole-attachment delays (under-reported)
- 4.4 Value Chain Analysis
- 4.5 Regulatory Landscape
- 4.6 Technological Outlook
- 4.7 Porter's Five Forces Analysis
- 4.7.1 Threat of New Entrants
- 4.7.2 Bargaining Power of Buyers
- 4.7.3 Bargaining Power of Suppliers
- 4.7.4 Threat of Substitutes
- 4.7.5 Competitive Rivalry
- 4.8 Investment Analysis
5 MARKET SIZE AND GROWTH FORECASTS (VALUE)
- 5.1 By Product Type
- 5.1.1 Transmission Equipment
- 5.1.2 Switching Equipment
- 5.1.3 Access Equipment (DSLAM, OLT, etc.)
- 5.1.4 Customer-Premises Equipment (Routers, STB, ONT)
- 5.1.5 Fiber-optic Cables
- 5.1.6 Others
- 5.2 By Service Type
- 5.2.1 Fixed Voice
- 5.2.2 Fixed Broadband Data
- 5.2.3 IPTV / Value-added Services
- 5.3 By Technology
- 5.3.1 Digital Subscriber Line
- 5.3.2 Coaxial (Docsis)
- 5.3.3 Fiber (FTTx/FTTH)
- 5.3.4 Hybrid Fiber-Coax
- 5.4 By End User
- 5.4.1 Residential
- 5.4.2 Small and Medium Enterprises
- 5.4.3 Large Enterprises
- 5.4.4 Government and Public Sector
- 5.4.5 Data Centers
- 5.5 By Geography
- 5.5.1 North America
- 5.5.1.1 United States
- 5.5.1.2 Canada
- 5.5.1.3 Mexico
- 5.5.2 South America
- 5.5.2.1 Brazil
- 5.5.2.2 Argentina
- 5.5.2.3 Rest of South America
- 5.5.3 Europe
- 5.5.3.1 Germany
- 5.5.3.2 United Kingdom
- 5.5.3.3 France
- 5.5.3.4 Russia
- 5.5.3.5 Rest of Europe
- 5.5.4 Asia Pacific
- 5.5.4.1 China
- 5.5.4.2 India
- 5.5.4.3 Japan
- 5.5.4.4 South Korea
- 5.5.4.5 ASEAN
- 5.5.4.6 Rest of Asia Pacific
- 5.5.5 Middle East and Africa
- 5.5.5.1 Middle East
- 5.5.5.1.1 Saudi Arabia
- 5.5.5.1.2 United Arab Emirates
- 5.5.5.1.3 Turkey
- 5.5.5.1.4 Rest of Middle East
- 5.5.5.2 Africa
- 5.5.5.2.1 South Africa
- 5.5.5.2.2 Nigeria
- 5.5.5.2.3 Rest of Africa
- 5.5.1 North America
6 COMPETITIVE LANDSCAPE
- 6.1 Market Concentration
- 6.2 Strategic Moves
- 6.3 Market Share Analysis
- 6.4 Company Profiles (includes Global level Overview, Market level overview, Core Segments, Financials, Strategic Information, Market Rank/Share, Products and Services, Recent Developments)
- 6.4.1 Huawei Technologies Co. Ltd
- 6.4.2 Cisco Systems Inc.
- 6.4.3 Nokia Corp.
- 6.4.4 ZTE Corp.
- 6.4.5 Broadcom Inc.
- 6.4.6 Arris (CommScope)
- 6.4.7 Arista Networks Inc.
- 6.4.8 Avaya Inc.
- 6.4.9 Allied Telesis Inc.
- 6.4.10 Corning Inc.
- 6.4.11 Prysmian Group
- 6.4.12 Adtran Inc.
- 6.4.13 Calix Inc.
- 6.4.14 DZS Inc.
- 6.4.15 Ribbon Communications
- 6.4.16 Telefonaktiebolaget LM Ericsson
- 6.4.17 Juniper Networks Inc.
- 6.4.18 FiberHome Telecommunication
- 6.4.19 CommScope Holding Co.
- 6.4.20 NEC Corp.
7 MARKET OPPORTUNITIES AND FUTURE OUTLOOK
- 7.1 White-space and Unmet-need Assessment
 LC连接器市场分析及预测(至2035年):依类型、产品类型、服务、技术、组件、应用、材质、製程、最终用户及功能划分
 射频同轴探头市场:按连接器类型、频率范围、应用、销售管道和最终用户划分,全球预测(2026-2032年)按组件、部署模式、应用程式和最终用户分類的直径路由代理市场 - 全球预测 2026-2032时钟恢復模组市场按应用、技术、产品类型、最终用户和分销管道划分 - 全球预测 2026-2032领先的铁路客製化服务市场按服务类型、铁路类型、分销管道、最终用户和应用划分 - 全球预测(2026-2032 年)高压PCB市场依最终用途产业、基板型、层数、基板、製造方法和组装类型划分,全球预测(2026-2032年)
 时钟同步与定时市场,全球预测至 2032 年:按网路环境、组件、技术、应用、最终用户和地区划分
 LIN收发器市场规模、份额和成长分析(按类型、车辆类型、销售管道和地区划分)-2026-2033年产业预测
 全球固定通讯服务:趋势与预测(2024年~2029年)2032 年固网通讯市场预测:按产品类型、网路类型、服务类型、技术、最终用户和地区进行的全球分析