


 |
市场调查报告书
商品编码
1850400
企业人工智慧:市场占有率分析、产业趋势、统计数据和成长预测(2025-2030 年)Enterprise AI - Market Share Analysis, Industry Trends & Statistics, Growth Forecasts (2025 - 2030) |
||||||
※ 本网页内容可能与最新版本有所差异。详细情况请与我们联繫。
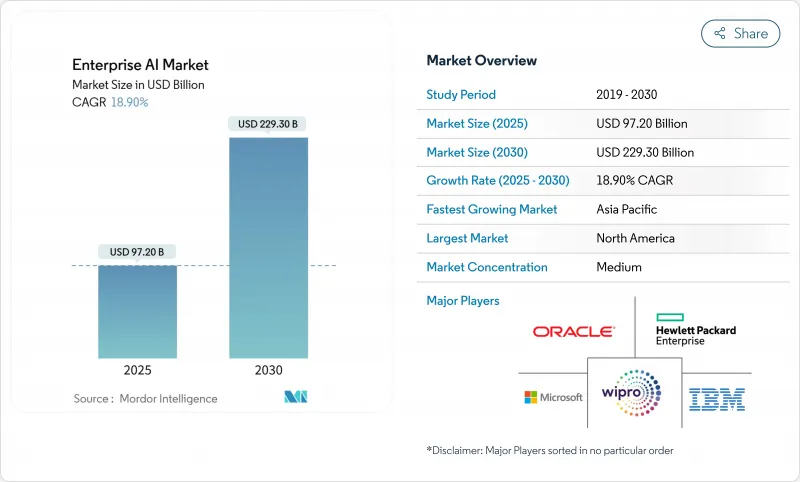
根据估计和预测,企业人工智慧市场在 2025 年的价值为 972 亿美元,预计到 2030 年将达到 2,293 亿美元,复合年增长率为 18.9%。
市场扩张的驱动力在于生成式人工智慧(一种能够自动执行多步骤任务的代理系统)的快速普及,以及对用于加速推理的专用晶片日益增长的需求。光是微软的人工智慧产品组合预计在2025财年就将以年化130亿美元的速度成长,年增175%。硬体供应商也反映了这一成长动能。儘管有出口限制,英伟达累计2026财年第一季的营收将达到441亿美元,证实了市场对高阶GPU的强劲需求。虽然云端运算仍然是主要的采用途径,但随着企业在资料主权和即时应用场景之间寻求平衡,混合云和边缘运算的采用正在加速。投资模式显示竞争格局日趋成熟。儘管2024年创业投资资金筹措超过1,000亿美元,但交易量集中在少数几家后进企业手中,这预示着未来将出现整合。
全球企业人工智慧市场趋势与洞察
对自动化和人工智慧解决方案的需求日益增长
企业自动化正从基于规则的RPA(机器人流程自动化)转向涵盖供应链、财务和客户营运的认知代理。在物流领域应用以代理为基础的人工智慧的企业,其收入成长比同业高出61%;像联合利华这样的製造商,透过人工智慧主导的优化,整体资产效率提高了85%。曾经需要数天的决策週期现在缩短到几分钟,从而能够更快地响应市场并控製成本。生成式人工智慧与工作流程引擎结合,正在创建自适应流程自动化,无需人工编写脚本即可自我改进。
分析指数级成长的企业资料集的必要性
资料成长速度已超过传统分析工具的处理能力,推动了对大规模语言模型介面的需求,这些介面允许业务使用者使用自然语言查询Petabyte级资料。金融公司正在部署GPT规模的模型,将交易资料、聊天记录和市场资讯整合起来,用于客户风险评分;医疗服务提供者正在合成影像和电子病历记录,以辅助诊断。现代人工智慧技术堆迭中内建的自动化资料发现功能,将资料准备工作从数月缩短至数天,从而更快释放资料价值。
文化和技能差距会减缓企业采用
人工智慧人才短缺问题仅次于网路安全和云端运算技能,71% 的公司表示专业知识缺口是其面临的最大瓶颈。仅有 21% 的公司针对人工智慧重新设计了工作流程,尤其是在传统领域。 LLMOps 工程师等新角色加剧了这项挑战,迫使公司加强培训倡议或寻求託管服务合作伙伴。
细分市场分析
到2024年,软体和平台将占企业人工智慧市场48%的份额,凸显了企业对预整合功能的需求。同时,硬体加速器将以23.11%的复合年增长率实现最快成长,显示基础设施投资正转向以性能为导向。由于出于隐私考虑,企业倾向于在本地运作大规模基础模型,预计企业人工智慧硬体市场规模将快速扩张。英伟达2025财年第二季的资料中心营收达到263亿美元,年增154%。
客製化ASIC的激增标誌着从通用CPU到矩阵最佳化处理器的结构性转变。云端供应商正在将这些加速器整合到其託管堆迭中,从而实现快速横向扩展,而无需企业承担折旧免税额成本。在边缘端,高效节能的SoC支援工业视觉和物联网闸道器中的本地推理,将企业AI市场扩展到核心资料中心之外。
儘管大型企业仍占据绝对支出主导地位,但中小企业如今正透过模板化模型和SaaS收费获取先进的人工智慧技术。垂直产业专属的基础设施模式降低了专业知识的门槛,使得咖啡连锁店和精品保险公司能够以极少的编码工作量部署人工智慧聊天机器人和需求预测功能。因此,企业级人工智慧市场正迎来越来越多的来自员工人数不到1000人的公司的贡献,同时,大量创业投资也涌入专注于中小企业的人工智慧平台。
云端市场正在打包拖放式资料管道,而託管服务公司则将资料准备、微调和监控打包在一起。随着人工智慧代理实现后勤部门营运自动化,中小企业也能享受到以往只有全球性企业才能获得的生产力提升,进而将企业级人工智慧的应用范围扩展到长尾产业。
企业与企业(软体/平台、服务、硬体加速器)、部署模式(本地部署、云端部署、混合/边缘部署)、组织规模(大型企业(1000 多名员工)、中型企业(100-999 名员工)、中小企业(100 名员工以下))、功能领域、技术、最终用户产业(银行业、金融服务和地区保险、製造业等地区和地区保险、製造业等地区和地区保险)。
市场预测以美元计价。
区域分析
到2024年,北美将占据企业人工智慧市场41.50%的收入份额,这得益于超过750亿美元的超大规模资本投资和深厚的创投生态系统。儘管美国政策导致对云端运算和人工智慧伙伴关係的审查日益严格,以防范反竞争锁定,但其创新引擎仍然强劲。加拿大正在推行一项平衡的管治蓝图,既维护伦理道德,又保持研究的弹性;而墨西哥则利用近岸外包将人工智慧投资引导至製造业走廊。
欧洲正围绕欧盟人工智慧法律建立信任平台,并专注于可解释性来製定解决方案。德国强大的工业基础推动了对人工智慧驱动的自动化需求,而英国的创新友好立场使其成为人工智慧测试的沙盒。法国和义大利的倡议将伦理框架与奖励相结合,以扶持新兴企业,但合规成本可能会延长产品上市週期。
亚太地区正经历着人工智慧积极应用的最快成长。中国生成式人工智慧的采用率已达83%,但美国公司在生产级部署方面处于领先地位,凸显了成熟度差距。日本和韩国正在扩大国内半导体製造厂的规模以确保硬体供应,而印度190亿美元的人工智慧资金筹措浪潮正在推动新兴企业的发展。同时,随着主权财富基金支持沙乌地阿拉伯和阿联酋的人工智慧中心,中东和非洲市场预计将以21.70%的复合年增长率成长。拉丁美洲正在製定以人权为中心的法规,为负责任的人工智慧平台供应商创造了閒置频段。
其他福利:
- Excel格式的市场预测(ME)表
- 3个月的分析师支持
目录
第一章 引言
- 研究假设和市场定义
- 调查范围
第二章调查方法
第三章执行摘要
第四章 市场情势
- 市场概览
- 市场驱动因素
- 对自动化和人工智慧解决方案的需求激增
- 分析指数级成长的企业资料集的必要性
- 云端基础的AI即服务平台的兴起
- 专用运算硬体(GPU、TPU、NPU)的进步
- 中小企业的产业特定平台模式,使人工智慧惠及更多企业
- 净零排放承诺推动人工智慧驱动的碳优化工具发展
- 市场限制
- 文化和技能差距会减缓企业采用
- 资料主权和隐私监管障碍
- 价值/供应链分析
- 监管环境
- 技术展望
- 模型操作与速动操作的演变
- 边缘推理加速
- 波特五力分析
- 买方的议价能力
- 供应商的议价能力
- 新进入者的威胁
- 替代品的威胁
- 竞争对手之间的竞争
- 评估宏观经济趋势对市场的影响
第五章 市场规模与成长预测
- 按组件
- 软体/平台
- 服务
- 硬体加速器
- 按公司规模
- 大型公司(员工超过1000人)
- 中型市场(100-999人)
- 小型企业(员工人数少于100人)
- 按功能领域
- 客户关係(客户体验、行销、销售)
- 营运和供应链
- 金融与风险
- 人事和人力资源
- 透过技术
- 机器学习/基础模型
- 自然语言处理
- 电脑视觉
- 决策智能/最佳化
- 按最终用户行业划分
- BFSI
- 製造业
- 汽车与出行
- 资讯科技和电信
- 媒体与广告
- 医疗保健和生命科学
- 零售与电子商务
- 能源与公共产业
- 其他的
- 按部署模式
- 本地部署
- 云
- 混合/边缘
- 按地区
- 北美洲
- 美国
- 加拿大
- 墨西哥
- 南美洲
- 巴西
- 阿根廷
- 其他南美洲
- 欧洲
- 英国
- 德国
- 法国
- 义大利
- 其他欧洲地区
- 亚太地区
- 中国
- 日本
- 印度
- 韩国
- 亚太其他地区
- 中东和非洲
- 北美洲
第六章 竞争情势
- 市场集中度和市场份额
- 策略发展
- 公司简介
- Microsoft Corporation
- IBM Corporation
- Amazon Web Services Inc.
- Google LLC
- Oracle Corporation
- Hewlett Packard Enterprise
- NVIDIA Corporation
- SAP SE
- Intel Corporation
- Wipro Limited
- NEC Corporation
- Accenture plc
- ServiceNow Inc.
- DataRobot Inc.
- UiPath Inc.
- C3.ai Inc.
- Palantir Technologies
- H2O.ai Inc.
- Sentient Technologies
- AiCure LLC
第七章 市场机会与未来展望
The enterprise AI market size is estimated at USD 97.2 billion in 2025 and is forecast to reach USD 229.3 billion by 2030, registering an 18.9% CAGR.
Expansion is propelled by rapid adoption of generative AI, agentic systems that automate multi-step tasks, and rising demand for specialised silicon that cuts inference times. Enterprises increasingly view AI as a route to cost optimisation, with Microsoft's AI portfolio alone running at a USD 13 billion annualised rate in fiscal 2025, a 175% year-on-year jump. Hardware suppliers mirror this momentum; NVIDIA posted USD 44.1 billion in Q1 FY2026 revenue despite export controls, underlining resilient demand for high-end GPUs. Cloud remains the primary deployment path, yet hybrid and edge rollouts are climbing fast as firms juggle data-sovereignty mandates with real-time use cases. Investment patterns hint at a maturing competitive environment: venture capital funding topped USD 100 billion in 2024, but deals are concentrating around fewer late-stage players, signalling future consolidation.
Global Enterprise AI Market Trends and Insights
Surging Demand for Automation & AI-Based Solutions
Corporate automation has moved beyond rule-based RPA toward cognitive agents spanning supply chain, finance, and customer operations. Organisations that embed agentic AI in logistics report 61% higher revenue growth than peers, while manufacturers such as Unilever lifted overall equipment effectiveness by 85% through AI-driven optimisation. Decision cycles that once took days now shrink to minutes, delivering not just cost control but faster market response. Coupling generative AI with workflow engines is spawning adaptive process automation that refines itself without human scripting.
Need to Analyse Exponentially Growing Enterprise Data Sets
Data growth outpaces traditional analytics tooling, creating pent-up demand for large-language-model interfaces that let business users query multi-petabyte stores in natural language. Financial firms deploy GPT-scale models to combine transactions, chat transcripts, and market feeds for in-flight risk scoring, while healthcare providers synthesise imaging and EHR records to support diagnostics. Automated data-discovery features in modern AI stacks now cut data-prep effort from months to days, unlocking value faster.
Cultural & Skills Gap Slowing Enterprise Adoption
Shortfalls in AI talent rank ahead of cybersecurity and cloud skills, with 71% of firms citing expertise gaps as the chief bottleneck. Compensation premiums of up to 20% for generative-AI roles widen disparities, especially in legacy sectors where only 21% of companies have re-engineered workflows for AI. Emerging roles such as LLMOps engineers compound the challenge, forcing enterprises to ramp training initiatives or pursue managed-service partners.
Other drivers and restraints analyzed in the detailed report include:
- Rise of Cloud-Based AI-as-a-Service Platforms
- Restraint % Impact on CAGR Forecast Geographic Relevance Impact Timeline Cultural & skills gap slowing enterprise adoption -2.8% Global, acute in traditional industries Medium term (2-4 years) Data-sovereignty and privacy-regulation hurdles -2.1% EU & North America, expanding to APAC Long term (>= 4 years)
- Data-Sovereignty and Privacy-Regulation Hurdles
For complete list of drivers and restraints, kindly check the Table Of Contents.
Segment Analysis
Software and platforms accounted for 48% of the enterprise AI market in 2024, underscoring enterprise demand for pre-integrated capabilities. Hardware accelerators, however, are growing the fastest at 23.11% CAGR, indicating a pivot toward performance-centric infrastructure investments. The enterprise AI market size for hardware is projected to climb sharply as organisations run larger foundation models on-premises for privacy. NVIDIA's data-center revenue hit USD 26.3 billion in Q2 FY2025, a 154% rise that highlights sustained capital allocation into GPUs.
Uptake of custom ASICs illustrates a structural shift from general CPUs to matrix-optimised processors. Cloud vendors integrate these accelerators into hosted stacks, giving enterprises rapid scale-out without bearing depreciation. At the edge, power-efficient SoCs enable local inference for industrial vision and IoT gateways, broadening the enterprise AI market beyond core data centers.
Large enterprises continue to dominate absolute spending, yet SMEs now access advanced AI through templated models and SaaS billing. Industry-specific foundation models slash the expertise threshold, enabling a cafe chain or boutique insurer to launch AI chatbots and demand forecasting with minimal coding. Consequently, the enterprise AI market records rising contribution from companies under 1,000 staff, aligning with venture-capital flows into SME-focused AI platforms.
Cloud marketplaces package drag-and-drop pipelines while managed-service firms bundle data prep, fine-tuning, and monitoring. As AI agents automate back-office tasks, smaller firms capture productivity benefits previously reserved for global corporations, extending the enterprise AI industry's reach into long-tail sectors.
Enterprise AI Market is Segmented by Component (Software / Platform, Services and Hardware Accelerators), Deployment Model (On-Premise, Cloud and Hybrid / Edge), Organization Size (Large Enterprise (>=1 000 Employees), Mid-Market (100-999) and Small Enterprise (<100)), Functional Area, Technology, End-User Industry (BFSI, Manufacturing and More), Geography. The Market Forecasts are Provided in Terms of Value (USD).
Geography Analysis
North America controlled 41.50% of 2024 enterprise AI market revenue, buoyed by hyperscaler capex exceeding USD 75 billion and a deep venture ecosystem. US policy now scrutinises cloud-AI partnerships for anticompetitive lock-ins, yet the innovation engine remains robust. Canada pursues a balanced governance blueprint that preserves research flexibility while safeguarding ethics, and Mexico leverages near-shoring to channel AI investment into manufacturing corridors.
Europe adopts a platform of trust anchored by the EU AI Act, shaping solutions that foreground explainability. Germany's strong industrial base fuels demand for AI-powered automation, while the UK positions itself as an AI testing sandbox under a pro-innovation stance. French and Italian initiatives combine ethical frameworks with incentives for startup creation, though compliance overhead can lengthen go-to-market cycles.
Asia-Pacific records the fastest uplift in active deployments. China shows 83% generative-AI adoption, yet US firms lead in production-grade rollouts, underscoring maturity gaps. Japan and South Korea scale domestic semiconductor fabs to secure hardware supply, and India's USD 19 billion AI funding wave accelerates startup momentum. Meanwhile, the Middle East and Africa enterprise AI market is forecast at 21.70% CAGR as sovereign wealth funds bankroll national AI hubs in Saudi Arabia and the UAE. Latin America crafts human-rights-oriented regulations, creating white spaces for responsible-AI platform vendors.
- Microsoft Corporation
- IBM Corporation
- Amazon Web Services Inc.
- Google LLC
- Oracle Corporation
- Hewlett Packard Enterprise
- NVIDIA Corporation
- SAP SE
- Intel Corporation
- Wipro Limited
- NEC Corporation
- Accenture plc
- ServiceNow Inc.
- DataRobot Inc.
- UiPath Inc.
- C3.ai Inc.
- Palantir Technologies
- H2O.ai Inc.
- Sentient Technologies
- AiCure LLC
Additional Benefits:
- The market estimate (ME) sheet in Excel format
- 3 months of analyst support
TABLE OF CONTENTS
1 INTRODUCTION
- 1.1 Study Assumptions and Market Definition
- 1.2 Scope of the Study
2 RESEARCH METHODOLOGY
3 EXECUTIVE SUMMARY
4 MARKET LANDSCAPE
- 4.1 Market Overview
- 4.2 Market Drivers
- 4.2.1 Surging demand for automation and AI-based solutions
- 4.2.2 Need to analyse exponentially growing enterprise data sets
- 4.2.3 Rise of cloud-based AI-as-a-Service platforms
- 4.2.4 Advances in specialised computing hardware (GPU, TPU, NPU)
- 4.2.5 Industry-specific foundation models democratising AI for SMEs
- 4.2.6 Net-Zero pledges driving AI-enabled carbon-optimisation tools
- 4.3 Market Restraints
- 4.3.1 Cultural and skills gap slowing enterprise adoption
- 4.3.2 Data-sovereignty and privacy-regulation hurdles
- 4.4 Value / Supply-Chain Analysis
- 4.5 Regulatory Landscape
- 4.6 Technological Outlook
- 4.6.1 Model-Ops and Prompt-Ops evolution
- 4.6.2 Edge inference acceleration
- 4.7 Porter's Five Forces Analysis
- 4.7.1 Bargaining Power of Buyers
- 4.7.2 Bargaining Power of Suppliers
- 4.7.3 Threat of New Entrants
- 4.7.4 Threat of Substitutes
- 4.7.5 Competitive Rivalry
- 4.8 Assessment of the Impact of Macroeconomic Trends on the Market
5 MARKET SIZE AND GROWTH FORECASTS (VALUE)
- 5.1 By Component
- 5.1.1 Software / Platform
- 5.1.2 Services
- 5.1.3 Hardware Accelerators
- 5.2 By Organisation Size
- 5.2.1 Large Enterprise (>=1 000 Employees)
- 5.2.2 Mid-market (100-999)
- 5.2.3 Small Enterprise (<100)
- 5.3 By Functional Area
- 5.3.1 Customer-facing (CX, marketing, sales)
- 5.3.2 Operations and Supply-chain
- 5.3.3 Finance and Risk
- 5.3.4 HR and Talent
- 5.4 By Technology
- 5.4.1 Machine Learning / Foundation Models
- 5.4.2 Natural-Language Processing
- 5.4.3 Computer Vision
- 5.4.4 Decision Intelligence / Optimisation
- 5.5 By End-user Industry
- 5.5.1 BFSI
- 5.5.2 Manufacturing
- 5.5.3 Automotive and Mobility
- 5.5.4 IT and Telecom
- 5.5.5 Media and Advertising
- 5.5.6 Healthcare and Life-sciences
- 5.5.7 Retail and e-Commerce
- 5.5.8 Energy and Utilities
- 5.5.9 Others
- 5.6 By Deployment Model
- 5.6.1 On-premise
- 5.6.2 Cloud
- 5.6.3 Hybrid / Edge
- 5.7 By Geography
- 5.7.1 North America
- 5.7.1.1 United States
- 5.7.1.2 Canada
- 5.7.1.3 Mexico
- 5.7.2 South America
- 5.7.2.1 Brazil
- 5.7.2.2 Argentina
- 5.7.2.3 Rest of South America
- 5.7.3 Europe
- 5.7.3.1 United Kingdom
- 5.7.3.2 Germany
- 5.7.3.3 France
- 5.7.3.4 Italy
- 5.7.3.5 Rest of Europe
- 5.7.4 Asia-Pacific
- 5.7.4.1 China
- 5.7.4.2 Japan
- 5.7.4.3 India
- 5.7.4.4 South Korea
- 5.7.4.5 Rest of Asia-Pacific
- 5.7.5 Middle East and Africa
- 5.7.1 North America
6 COMPETITIVE LANDSCAPE
- 6.1 Market Concentration and Share
- 6.2 Strategic Developments
- 6.3 Company Profiles (includes Global-level Overview, Market-level Presence, Core Segments, Financials, Strategic Information, Market Rank/Share, Products and Services, Recent Developments)
- 6.3.1 Microsoft Corporation
- 6.3.2 IBM Corporation
- 6.3.3 Amazon Web Services Inc.
- 6.3.4 Google LLC
- 6.3.5 Oracle Corporation
- 6.3.6 Hewlett Packard Enterprise
- 6.3.7 NVIDIA Corporation
- 6.3.8 SAP SE
- 6.3.9 Intel Corporation
- 6.3.10 Wipro Limited
- 6.3.11 NEC Corporation
- 6.3.12 Accenture plc
- 6.3.13 ServiceNow Inc.
- 6.3.14 DataRobot Inc.
- 6.3.15 UiPath Inc.
- 6.3.16 C3.ai Inc.
- 6.3.17 Palantir Technologies
- 6.3.18 H2O.ai Inc.
- 6.3.19 Sentient Technologies
- 6.3.20 AiCure LLC
7 MARKET OPPORTUNITIES AND FUTURE OUTLOOK
- 7.1 White-space and Unmet-need Assessment
 企业人工智慧市场按组件、技术、公司规模、部署类型、应用和产业划分-2025-2032年全球预测
 全球企业法学硕士 (LLM) 市场规模、份额和行业分析报告:2025 年至 2032 年按公司规模、模型类型、组件、部署类型、行业垂直和地区分類的展望和预测
 企业法学硕士市场机会、成长动力、产业趋势分析及 2025 - 2034 年预测
 2025年全球企业人工智慧市场报告
 企业AI服务:13通讯业者的案例研究与分析企业法学硕士 (LLM) 市场规模、份额和趋势分析报告:按组件、部署模式、模型类型、公司规模、行业垂直、地区和细分市场预测,2025 年至 2033 年
 2025-2029年全球金融服务代理人工智慧市场
 全球企业人工智慧市场研究报告 - 产业分析、规模、份额、成长、趋势及 2025 年至 2033 年预测企业人工智慧 (AI) 市场分析及预测(至 2034 年):类型、产品、服务、技术、组件、应用、部署、最终用户和功能
 企业人工智慧市场报告,按组件、部署模式、技术(自然语言处理、机器学习、电脑视觉、语音识别等)、组织规模、产业垂直和地区划分,2025 年至 2033 年