


 |
市场调查报告书
商品编码
1850402
智慧电视:市场占有率分析、产业趋势、统计数据和成长预测(2025-2030 年)Smart TV - Market Share Analysis, Industry Trends & Statistics, Growth Forecasts (2025 - 2030) |
||||||
※ 本网页内容可能与最新版本有所差异。详细情况请与我们联繫。
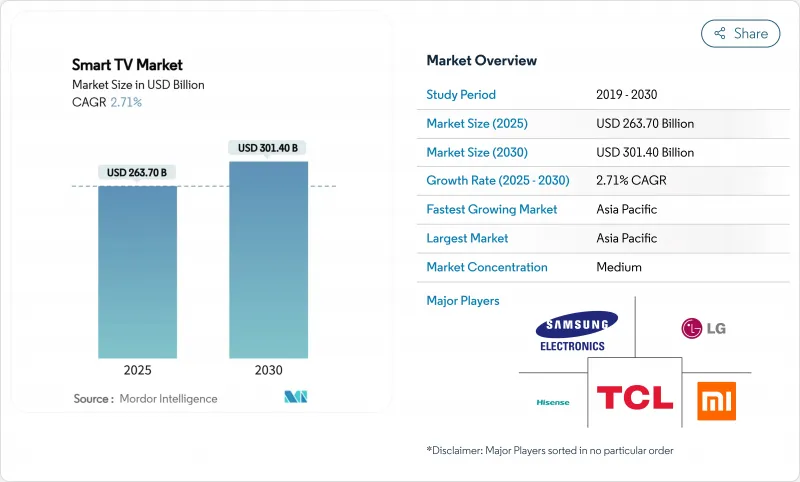
预计到 2025 年,智慧电视市场规模将达到 2,637 亿美元,到 2030 年将达到 3,014 亿美元,年复合成长率为 2.71%。
如今,推动成长的并非首次购机用户数量的激增,而是人工智慧影像处理、整合云端游戏功能以及价值链本地化等渐进式改进,这些改进在降低成本的同时还能保持净利率。印度扩大生产连结奖励,越南和墨西哥也推出类似的製造业信贷政策,这些措施正在扶持产地附近的组装中心,从而缩短前置作业时间并降低平均售价。显示器製造商正加大研发投入,改进mini-LED背光和量子点技术,以应对OLED的供应限制;通讯业者则将电视与光纤套餐捆绑销售,以扩大目标用户群。平台竞争的焦点正转向广告支援的内容服务和延长软体支援的承诺,这即使在成熟市场也促使用户进行高级更换。
全球智慧电视市场趋势与洞察
55-65吋4K电视价格的下降将推动印度和巴西的大规模普及。
中国OEM厂商已将55吋4K电视的零售价(曾经的高阶阈值)在2024年降至400美元以下。诸如TCL 98吋机型从5999美元降至1999美元等积极的促销,迫使竞争对手扩大入门级产品线,并透过在地采购来确保利润。三星印度分公司报告称,其2024年的电视销售额将达到1000亿卢比,凸显了品牌主导的AI功能将如何帮助其即使在通缩环境下也能保持价格分布。
电信主导的光纤部署推动东南亚首家拥有者
印尼、泰国和马来西亚的全国性光纤网路计画正在降低宽频订阅成本,并实现流畅的4K串流媒体播放。营运商目前将入门级43吋电视捆绑到100Mbps的宽频套餐中,打造绕过传统零售通路的一体化提案。随着观看方式从行动装置转向客厅萤幕,潜在需求将从城市中心转移到二线城市,预计到2030年,二线城市智慧电视市场将继续领先全球市场。
用于迷你LED背光灯的半导体供应紧张,限制了高端产品的供应。
Mini-LED电视需要数千个驱动晶片和高密度封装的二极管,但这些元件的晶圆产能远远无法满足预计在2024年出现的激增需求。 TrendForce预测,2024年Mini-LED电视的出货量将成长59%,达到640万台,这将使现有元件供应捉襟见肘。前置作业时间超过30週,导致各大品牌优先生产旗舰产品,延后推出中阶机型。供应缓解的关键在于一座计画于2026年下半年投产的12吋晶圆厂。
细分市场分析
预计到2024年,高画质/全高清电视仍将以37.8%的市占率领跑,主要得益于新兴经济体消费者对成本的关注。相比之下,8K超高清电视预计将以4.2%的速度成长,并在2030年之前超越整体智慧电视市场的成长速度。三星的Vision AI引擎将于2025年推出,它将把低解析度视讯串流提升至接近原生8K的画质,从而缓解超高码率内容短缺的问题。欧盟生态设计法规对峰值亮度的限制将促使厂商采用更有效率的背光设计,从而在高亮度合规性方面转向mini-LED而非OLED。
入门级4K电视也开始配备可变刷新率游戏模式等高阶功能,模糊了中阶市场的界限,并扩大了智慧电视市场的整体规模。内容平台也将其内容库升级到HDR10+和杜比视界,从而推动了对能够精确渲染动态元资料的高像素密度面板的需求。
到2024年,主流46-55吋智慧电视将占智慧电视市场32.1%的份额。由于印度和墨西哥本地组装的减少,该类别电视的平均售价将比去年同期下降9%。 65吋以上尺寸的电视将以3.8%的复合年增长率成长,并带动高阶技术(包括120Hz面板和物件追踪音效)的普及。
透过共用玻璃基板,製造商正将98吋液晶电视的价格降至2,000美元以下,让壁挂式电视也能惠及中等收入家庭。疫情期间家庭剧院的升级改造改变了客厅的布局,而这种空间变化更有利于大萤幕电视的使用。虽然小萤幕电视(32吋以下)在其他房间仍有市场,但收入结构正在向上转移,即使智慧电视市场整体成长放缓,大萤幕电视也能为利润池提供支撑。
区域分析
亚太地区预计到2024年将占全球营收的41.2%,以3.2%的复合年增长率引领成长。新德里的奖励机制在十年内推动本地生产成长了九倍,由此形成的规模经济将辐射至东协出口走廊。光纤网路的部署和在地化的OTT内容将协助印尼、越南和菲律宾等国的首次购机者进入智慧电视市场,从而扩大农村地区的普及率。
北美市场日趋成熟,人工智慧驱动的影像增强技术和FAST通道整合推动了电视的更换需求。广告商资助的服务补贴了高阶电视,而云端游戏延迟的改善将进一步提升更新率规格。欧洲正努力应对严格的节能法规EC 2024/1781,该法规限制了大型8K电视的亮度。遵守该法规将迫使电视峰值亮度降低,从而推动mini-LED技术的应用,并促进微透镜阵列的研究与开发。
中东和非洲的普及率仅为个位数,但基础设施投资的增加和可支配收入的成长领先提供了空间。区域广播公司推出高速阿拉伯语频道,消除了内容障碍。拉丁美洲的需求呈现两极化:高阶电视机受到富裕的都市区消费者的青睐,而低价串流媒体适配器则延缓了价格敏感型家庭的电视机升级。整体而言,外汇波动迫使製造商采取灵活的采购和避险策略,以保持市场竞争力。
其他福利:
- Excel格式的市场预测(ME)表
- 3个月的分析师支持
目录
第一章 引言
- 研究假设和市场定义
- 调查范围
第二章调查方法
第三章执行摘要
第四章 市场情势
- 市场概览
- 市场驱动因素
- 55-65吋4K电视价格的下降正在推动印度和巴西的普及。
- 电信业者主导的光纤部署推动东南亚首批光纤所有权公司成立
- 快速通路整合推动北美升级需求
- 在印度,政府的生产关联激励措施和在地化奖励正在拉低平均售价。
- 云端游戏伙伴关係(Xbox、GeForce Now)推动了120Hz高阶电视的销售
- Matter认证的互通性加快了欧盟的更换週期。
- 市场限制
- 微型LED背光半导体供应紧张限制了高端产品的供应。
- 作业系统生态系统碎片化推高了应用程式开发成本。
- 欧盟第二项能源法规限制了8K电视的亮度和普及率。
- 价格亲民的串流媒体加密狗延长了价格敏感型市场中的产品更换週期。
- 产业价值链分析
- 监理与技术展望
- 波特五力分析
- 供应商的议价能力
- 买方的议价能力
- 新进入者的威胁
- 替代品的威胁
- 竞争对手之间的竞争
第五章 市场规模与成长预测
- 通过决议
- 高清/全高清
- 4K UHD
- 8K UHD
- 按萤幕尺寸(英吋)
- 小于 32 英寸
- 33 至 45 英寸
- 46 至 55 英寸
- 56 至 65 英寸
- 65吋或以上
- 按下面板/显示技术
- LED/LCD
- 有机发光二极体
- QLED
- 迷你LED
- 微型LED
- 按萤幕形状
- 平坦的
- 曲线
- 按作业系统
- Android TV
- 其他/OEM特定规格
- 透过分销管道
- 线下零售(大卖场、品牌专卖店)
- 线上(电子商务、D2C)
- 按地区
- 北美洲
- 美国
- 加拿大
- 墨西哥
- 欧洲
- 德国
- 英国
- 法国
- 北欧国家
- 其他欧洲地区
- 南美洲
- 巴西
- 其他南美洲
- 亚太地区
- 中国
- 日本
- 印度
- 东南亚
- 亚太其他地区
- 中东和非洲
- 中东
- GCC
- 土耳其
- 其他中东地区
- 非洲
- 南非
- 其他非洲地区
- 北美洲
第六章 竞争情势
- 市场集中度
- 策略趋势
- 市占率分析
- 公司简介
- Samsung Electronics Co., Ltd.
- LG Electronics Inc.
- TCL Technology Group Corp.
- Hisense Group Co., Ltd.
- Xiaomi Corporation
- Sony Group Corporation
- Vizio Holding Corp.
- Panasonic Holdings Corporation
- Sharp Corporation
- TPV Technology Limited(Philips)
- Skyworth Group Ltd.
- Konka Group Co., Ltd.
- Haier Smart Home Co., Ltd.
- Changhong Electric Co., Ltd.
- Toshiba Corporation
- OnePlus Technology(Shenzhen)Co., Ltd.
- VU Technologies Pvt. Ltd.
第七章 市场机会与未来展望
The smart TV market size stands at USD 263.7 billion in 2025 and is projected to reach USD 301.4 billion by 2030, expanding at a 2.71% CAGR.
Momentum now comes less from first-time ownership surges and more from incremental improvements such as AI-driven picture processing, integrated cloud-gaming features and value-chain localization that compresses costs while preserving margins. India's expanded production-linked incentives and similar manufacturing credits in Vietnam and Mexico are fostering near-source assembly hubs that shorten lead times and lower average selling prices Ministry of Commerce & Industry. Display makers are steering R&D toward Mini-LED backlighting and quantum-dot enhancements that counter OLED's supply constraints, while telecom operators bundle televisions with fiber plans to widen addressable households. Platform competition is shifting toward ad-supported content services and extended software-support promises, encouraging premium replacements even in mature regions.
Global Smart TV Market Trends and Insights
Price Erosion of 55-65" 4 K Sets Accelerating Mass Adoption in India and Brazil
Chinese OEMs pushed 55-inch 4 K retail pricing below USD 400 in 2024, a threshold that once signaled the premium tier. Aggressive promotions, such as TCL's drop on 98-inch models from USD 5,999 to USD 1,999, compelled rivals to broaden entry-level line-ups while preserving margins through localized sourcing . Samsung's Indian unit still reported INR 10,000 crore television revenue in 2024, underscoring that brand-led AI features can hold price points even amid deflation Lower barriers entice middle-income households into larger-screen categories and compress replacement cycles across value-sensitive markets.
Telecom-Led Fiber Roll-outs Catalyzing First-Time Ownership in Southeast Asia
Nationwide fiber plans in Indonesia, Thailand and Malaysia are shrinking broadband subscription costs and enabling seamless 4 K streaming. Operators now bundle entry-level 43-inch televisions with 100 Mbps contracts, creating integrated service propositions that sidestep traditional retail channels. As viewing shifts from mobile devices to living-room screens, addressable demand moves beyond urban cores into tier-2 cities, sustaining outperformance against the global smart TV market through 2030.
Semiconductor Tightness for Mini-LED Backlights Limiting Premium Supply
Mini-LED sets need thousands of driver ICs and densely packed diodes; wafer-fab capacity for these parts lagged surging demand in 2024. TrendForce estimates Mini-LED television shipments grew 59% to 6.4 million units in 2024, overwhelming available component supply. Lead times stretched beyond 30 weeks, prompting brands to prioritise flagship lines and delay mid-tier adopters. Supply relief hinges on new 12-inch fabs slated to ramp only in late 2026.
Other drivers and restraints analyzed in the detailed report include:
- Government PLI and Localization Incentives Lowering ASPs in India
- Integration of FAST Channels Spurring Upgrade Demand in North America
- Low-Cost Streaming Dongles Extending Replacement Cycles in Price-Sensitive Markets
For complete list of drivers and restraints, kindly check the Table Of Contents.
Segment Analysis
HD/Full HD still led revenue with 37.8% in 2024, sustained by cost-sensitive buyers in developing economies. Conversely, 8 K UHD is projected to compound at 4.2% and outsprint overall smart TV market growth through 2030. Samsung's Vision AI engine, rolled out in 2025, enhances lower-resolution streams to near-native 8 K quality and mitigates the shortage of ultra-high-bitrate content . EU ecodesign rules that limit peak brightness add pressure to engineer more efficient backlights, nudging brands toward Mini-LED over OLED for high-nit compliance.
Entry-level 4 K sets inherit premium features such as variable-refresh-rate gaming modes, blurring the mid-tier and expanding the total smart TV market. Content platforms also upscale catalogues to HDR10+ and Dolby Vision, reinforcing demand for higher-pixel-density panels that can render dynamic metadata accurately.
Mainstream 46-55-inch models captured 32.1% of the smart TV market in 2024. Average selling prices in this category fell 9% year on year after local assembly scaled in India and Mexico. Sets above 65 inches are forecast for a 3.8% CAGR and pull most premium technology attach-rates, including 120 Hz panels and object-tracking sound.
Manufacturers leverage shared glass-substrate fabs to push 98-inch LCDs below USD 2,000, making wall-sized viewing accessible to middle-income households. Pandemic-era home-theatre upgrades reconfigured living-room layouts, and those spatial changes now lock in preference for larger screens. Smaller than 32 inch remains viable for secondary rooms, yet the revenue mix shifts upward, underpinning profit pools despite moderate headline growth for the smart TV market.
The Smart TV Market Report is Segmented by Resolution (HD/Full HD, 4K UHD, and 8K UHD), Screen Size (Up To 32 Inch, 33-45 Inch, 46-55 Inch, and More), Panel/Display Technology (LED/LCD, OLED, QLED, Mini-LED, and More), Screen Shape (Flat, and Curved), Operating System (Android TV, and Other/OEM Proprietary), Distribution Channel (Offline Retail, and Online), and Geography. The Market Forecasts are Provided in Terms of Value (USD).
Geography Analysis
Asia-Pacific generated 41.2% of 2024 revenue and leads growth at 3.2% CAGR as domestic panel fabs in China and assembly hubs in India lower regional landed costs. New Delhi's incentive ecosystem boosted local output nine-fold over a decade, creating scale that reverberates across ASEAN exporting corridors. Fiber roll-outs and OTT content localisation bring first-time buyers in Indonesia, Vietnam and the Philippines into the smart TV market, expanding rural penetration.
North America is mature; replacement demand hinges on AI-powered upscaling and FAST-channel integration. Advertiser-funded services subsidise premium sets, and cloud-gaming latency improvements elevate refresh-rate specifications. Europe wrestles with stringent energy-efficiency law EC 2024/1781 that caps brightness for large 8 K models. Compliance forces thinner peak-luminance levels, prompting Mini-LED adoption and spurring R&D into micro-lens arrays.
Middle East and Africa trail with low single-digit penetration, yet infrastructure investments and rising disposable incomes signal headroom. Regional broadcasters rolling out Arabic-language FAST channels remove content barriers. Latin America shows bifurcated demand: premium sets sell into affluent urban districts, while low-cost streaming dongles slow panel upgrades in price-sensitive households. Throughout, currency volatility steers manufacturers toward flexible sourcing and hedging strategies to keep the smart TV market competitive.
- Samsung Electronics Co., Ltd.
- LG Electronics Inc.
- TCL Technology Group Corp.
- Hisense Group Co., Ltd.
- Xiaomi Corporation
- Sony Group Corporation
- Vizio Holding Corp.
- Panasonic Holdings Corporation
- Sharp Corporation
- TPV Technology Limited (Philips)
- Skyworth Group Ltd.
- Konka Group Co., Ltd.
- Haier Smart Home Co., Ltd.
- Changhong Electric Co., Ltd.
- Toshiba Corporation
- OnePlus Technology (Shenzhen) Co., Ltd.
- VU Technologies Pvt. Ltd.
Additional Benefits:
- The market estimate (ME) sheet in Excel format
- 3 months of analyst support
TABLE OF CONTENTS
1 INTRODUCTION
- 1.1 Study Assumptions and Market Definition
- 1.2 Scope of the Study
2 RESEARCH METHODOLOGY
3 EXECUTIVE SUMMARY
4 MARKET LANDSCAPE
- 4.1 Market Overview
- 4.2 Market Drivers
- 4.2.1 Price Erosion of 55-65" 4K Sets Accelerating Mass Adoption in India and Brazil
- 4.2.2 Telecom-Led Fiber Roll-outs Catalyzing First-Time Ownership in Southeast Asia
- 4.2.3 Integration of FAST Channels Spurring Upgrade Demand in North America
- 4.2.4 Government PLI and Localization Incentives Lowering ASPs in India
- 4.2.5 Cloud-Gaming Partnerships (Xbox, GeForce Now) Driving 120 Hz Premium TV Sales
- 4.2.6 Matter-Certified Interoperability Boosting Replacement Cycles in EU
- 4.3 Market Restraints
- 4.3.1 Semiconductor Tightness for MiniLED Backlights Limiting Premium Supply
- 4.3.2 Fragmented OS Ecosystem Raising App Development Costs
- 4.3.3 EU Tier-2 Energy Rules Curbing 8K TV Brightness and Adoption Rates
- 4.3.4 Low-Cost Streaming Dongles Extending Replacement Cycles in Price-Sensitive Markets
- 4.4 Industry Value Chain Analysis
- 4.5 Regulatory and Technological Outlook
- 4.6 Porter's Five Forces Analysis
- 4.6.1 Bargaining Power of Suppliers
- 4.6.2 Bargaining Power of Buyers
- 4.6.3 Threat of New Entrants
- 4.6.4 Threat of Substitutes
- 4.6.5 Competitive Rivalry
5 MARKET SIZE AND GROWTH FORECASTS (VALUES)
- 5.1 By Resolution
- 5.1.1 HD/Full HD
- 5.1.2 4K UHD
- 5.1.3 8K UHD
- 5.2 By Screen Size (Inches)
- 5.2.1 Upto 32
- 5.2.2 33-45
- 5.2.3 46-55
- 5.2.4 56-65
- 5.2.5 Above 65
- 5.3 By Panel/Display Technology
- 5.3.1 LED/LCD
- 5.3.2 OLED
- 5.3.3 QLED
- 5.3.4 Mini-LED
- 5.3.5 Micro-LED
- 5.4 By Screen Shape
- 5.4.1 Flat
- 5.4.2 Curved
- 5.5 By Operating System
- 5.5.1 Android TV
- 5.5.2 Other/OEM Proprietary
- 5.6 By Distribution Channel
- 5.6.1 Offline Retail (Hypermarket, Brand Stores)
- 5.6.2 Online (E-commerce, D2C)
- 5.7 By Geography
- 5.7.1 North America
- 5.7.1.1 United States
- 5.7.1.2 Canada
- 5.7.1.3 Mexico
- 5.7.2 Europe
- 5.7.2.1 Germany
- 5.7.2.2 United Kingdom
- 5.7.2.3 France
- 5.7.2.4 Nordics
- 5.7.2.5 Rest of Europe
- 5.7.3 South America
- 5.7.3.1 Brazil
- 5.7.3.2 Rest of South America
- 5.7.4 Asia-Pacific
- 5.7.4.1 China
- 5.7.4.2 Japan
- 5.7.4.3 India
- 5.7.4.4 South-East Asia
- 5.7.4.5 Rest of Asia-Pacific
- 5.7.5 Middle East and Africa
- 5.7.5.1 Middle East
- 5.7.5.1.1 Gulf Cooperation Council Countries
- 5.7.5.1.2 Turkey
- 5.7.5.1.3 Rest of Middle East
- 5.7.5.2 Africa
- 5.7.5.2.1 South Africa
- 5.7.5.2.2 Rest of Africa
- 5.7.1 North America
6 COMPETITIVE LANDSCAPE
- 6.1 Market Concentration
- 6.2 Strategic Moves
- 6.3 Market Share Analysis
- 6.4 Company Profiles {(includes Global level Overview, Market level overview, Core Segments, Financials as available, Strategic Information, Market Rank/Share for key companies, Products and Services, and Recent Developments)}
- 6.4.1 Samsung Electronics Co., Ltd.
- 6.4.2 LG Electronics Inc.
- 6.4.3 TCL Technology Group Corp.
- 6.4.4 Hisense Group Co., Ltd.
- 6.4.5 Xiaomi Corporation
- 6.4.6 Sony Group Corporation
- 6.4.7 Vizio Holding Corp.
- 6.4.8 Panasonic Holdings Corporation
- 6.4.9 Sharp Corporation
- 6.4.10 TPV Technology Limited (Philips)
- 6.4.11 Skyworth Group Ltd.
- 6.4.12 Konka Group Co., Ltd.
- 6.4.13 Haier Smart Home Co., Ltd.
- 6.4.14 Changhong Electric Co., Ltd.
- 6.4.15 Toshiba Corporation
- 6.4.16 OnePlus Technology (Shenzhen) Co., Ltd.
- 6.4.17 VU Technologies Pvt. Ltd.
7 MARKET OPPORTUNITIES AND FUTURE OUTLOOK
- 7.1 White-Space and Unmet-Need Assessment
 2026年全球体育赛事线上影片市场报告
 智慧电视市场分析及预测(至2035年):依类型、产品类型、技术、组件、应用、功能、安装类型、最终用户及模式划分
 美国智慧电视:市场占有率分析、产业趋势与统计、成长预测(2026-2031)
 智慧电视市场规模、份额、趋势和预测(按解析度类型、萤幕大小、萤幕类型、技术、平台、分销管道、应用和地区划分),2026-2034年
 智慧电视市场规模、份额和趋势分析报告:按解析度、萤幕尺寸、作业系统、分销管道、技术、地区和细分市场预测(2026-2033 年)2026年全球智慧电视市场报告
 智慧电视市场-全球产业规模、份额、趋势、机会、预测:按解析度类型、萤幕大小、萤幕类型、分销管道、地区和竞争格局划分,2021-2031年智慧电视棒市场 - 全球产业规模、份额、趋势、机会及预测(按影片支援类型、销售管道、地区和竞争格局划分,2021-2031年)日本智慧电视市场报告(按解析度类型、萤幕尺寸、萤幕类型、技术、平台、配销通路、应用和地区划分,2026-2034年)
 智慧型电视棒市场规模、份额及成长分析(按产品类型、应用、通路和地区划分)-产业预测,2026-2033年