


 |
市场调查报告书
商品编码
1850967
AIOps:市场占有率分析、产业趋势、统计数据和成长预测(2025-2030 年)AIOps - Market Share Analysis, Industry Trends & Statistics, Growth Forecasts (2025 - 2030) |
||||||
※ 本网页内容可能与最新版本有所差异。详细情况请与我们联繫。
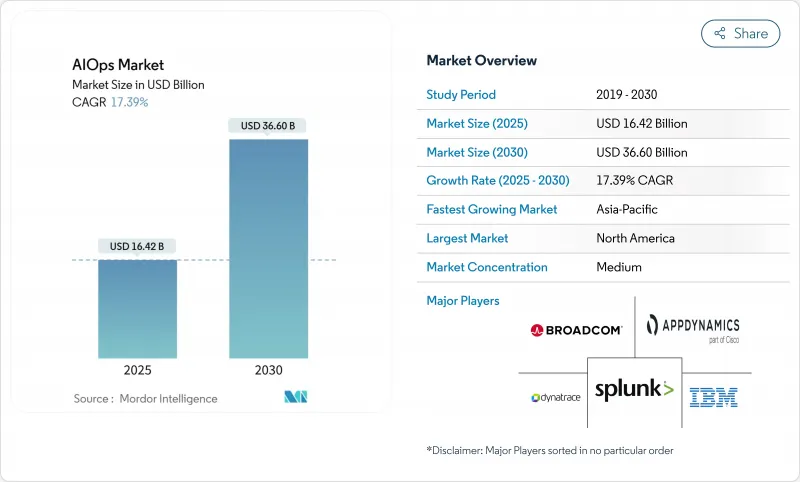
AIOps 市场预计到 2025 年将达到 164.2 亿美元,到 2030 年将达到 366 亿美元,复合年增长率为 17.39%。
随着企业面临混合云端复杂性、可观测资料量不断增长以及在提高服务弹性的同时降低营运成本的压力,市场需求日益增长。供应商正将大规模语言模型整合到传统监控中,以减少噪音、加速根本原因发现,并实现自主事件回应,从而优化容量规划。由于买家对分散的工具集感到厌倦,这些工具集不仅推高了许可成本,还拖慢了决策速度,平台整合正在加速进行。基于使用量的定价模式和 OpenTelemetry 等开放标准也降低了进入门槛,吸引中小企业参与采购流程。
全球AIOps市场趋势与洞察
对人工智慧驱动的可观测性的需求激增
如今,遥测资料量已达到每天Petabyte,传统监控方式难以应付。现代AIOps平台将日誌、指标和追踪资料关联起来,可将警报噪音降低高达75%。金融服务等关键业务产业整合到单一平台后,大型主机任务的自动化率已达99%。随着云端原生应用产生的资料量是单体应用的10倍,手动分类变得不切实际,这种能力变得至关重要。供应商将机器学习技术应用于跨资料孤岛的异常模式侦测,从而防止使用者可见的故障,并确保运作时间。
向混合/多重云端架构迁移
约 82% 的公司正在实施混合云策略,92% 的公司正在使用多个公共云端,这导致可见性分散且 API 介面多样化。 45% 的公司已经采用 AIOps 来集中监控,早期采用者报告称,跨域关联自动化后,事件解决速度提高了 38%。不断增长的云端支出带来了经济紧迫性,使得演算法资源优化成为董事会层面的优先事项。
工具激增与投资报酬率不确定性
许多公司仍使用五种或更多监控工具,导致资讯脱节,行动迟缓。在AIOps能够兑现其承诺的价值之前,整合成本就已经不断攀升,这令经营团队犹豫不决。这种压力在北美尤其突出,因为当地预算紧张,采购团队在核准任何新平台之前,都会要求提供清晰的商业案例。
细分市场分析
平台产品将占2024年收入的82.4%,这进一步印证了整合遥测资料收集和分析将优于独立解决方案的观点。剩余的17.6%将来自服务,买家寻求配置、模型训练和变更管理的支援。企业发现,单一主机可以减少频繁操作带来的疲劳,并加快决策流程。供应商目前正在整合预训练模型,这些模型透过联邦学习不断演进,从而随着时间的推移提高检测精度。咨询顾问则负责将旧有系统映射到现代管道,并实施最佳实践管治。
这种以平台为中心的转变吸取了以往工具氾滥的教训。核心套件所采用的专有引擎能够提供精细的异常评分,而这种评分很难透过自订整合来实现。随着专家们建构承包仪表板和代理附加元件,合作伙伴生态系统也不断深化。 RapDev 基于 Datadog 的原生 AI 代理在增值层面展现了获利潜力,而 IBM 管道正在引入 Instana 以获取相关业务收益。
到2024年,本地部署仍将维持56.2%的市场份额,这主要得益于金融和政府领域严格的资料居住规则。然而,随着用户转向基于使用量的合约模式(这种模式可以减轻基础设施管理的负担),云端运算云端领域到2030年将以18.7%的复合年增长率快速成长。云端供应商不断更新人工智慧模型,在无需用户进行大规模升级的情况下提高准确率。混合配置目前在概念验证占据主导地位,敏感资料集保留在本地,而云端分析引擎则大规模地执行关联和推理。
云端运算的发展势头预示着向弹性架构的更广泛转变。当突发事件激增时,平台可以部署突增的运算资源,并在数秒内完成多方面的根本原因分析。加密和零信任控制措施降低了传统的安全顾虑,鼓励即使是受监管的企业也尝试试用託管可观测性。成本管治功能会在资料摄取量接近预算阈值时向维运团队发出警报,从而减少意外帐单。
AIOps市场按元件(平台和服务)、部署类型(本地部署和云端部署)、组织规模(中小企业和大型企业)、最终用户产业(IT和通讯、银行、金融服务和保险等)以及地区进行细分。市场预测以美元计价。
区域分析
北美将在2024年引领AIOps市场,占据38.2%的市占率。早期采用者、强大的供应商生态系统以及充足的云端预算正在推动该地区实现规模经济。联邦机构已记录超过1200个AI用例,其中228个已投入运作,这表明AIOps在关键任务环境中已具备成熟的营运能力。併购活动依然活跃,例如ServiceNow收购Logik.ai,旨在增强即时工作流程自动化能力。
亚太地区预计将成为成长最快的地区,复合年增长率将达到19.2%。中国、印度和东南亚各国政府正在资助人工智慧加速器并津贴云端基础设施,推动企业实现营运现代化。亚太地区在可观测性方面的年度投资中位数高达1,008万美元,超过其他地区,凸显了数位转型的规模。电讯正在将AIOps整合到5G核心网路中,以减少网路中断造成的损失;金融超级应用则正在部署异常检测技术,以遏制大规模诈欺行为。
在ESG(环境、社会和治理)法规、严格的资料主权规则以及对开放标准的偏好等因素的推动下,欧洲市场持续保持稳定成长。该地区高度重视演算法的可解释性,要求供应商公开模型逻辑并提供本地部署的训练选项。各公司正将AIOps部署与绿色营运目标结合,并衡量每GB遥测资料的能耗。与NTT DATA和HPE Aruba等公司的伙伴关係,提供了可根据需求自动扩展资源的、针对永续性最佳化的观测套件。虽然严格的监管可能会延缓初始采购,但获得合规认证最终将增强供应商的信誉。
其他福利:
- Excel格式的市场预测(ME)表
- 3个月的分析师支持
目录
第一章 引言
- 研究假设和市场定义
- 调查范围
第二章调查方法
第三章执行摘要
第四章 市场情势
- 市场概览
- 市场驱动因素
- 对人工智慧主导的可观测性的需求激增
- 向混合/多重云端架构迁移
- 需要加快平均修復时间 (MTTR) 和 SRE 部署速度
- 用于营运的 Gen-AI 副驾驶
- 用于边缘即时推理的FPGA/DPU
- 与ESG相关的「绿色营运」合规性
- 市场限制
- 工具激增与投资报酬率不确定性
- AIOps 人才短缺
- 资料主权/人工智慧管治障碍
- 供应商黑盒演算法与锁定风险
- 供应链分析
- 监管环境
- 技术展望
- 波特五力分析
- 供应商的议价能力
- 买方的议价能力
- 新进入者的威胁
- 替代品的威胁
- 竞争对手之间的竞争
- 对宏观经济趋势的市场评估
第五章 市场规模与成长预测
- 按组件
- 平台
- 服务
- 透过部署模式
- 本地部署
- 云
- 按组织规模
- 小型企业
- 大公司
- 按最终用户行业划分
- 资讯科技和通讯
- BFSI
- 卫生保健
- 零售与电子商务
- 媒体与娱乐
- 製造业
- 政府和公共部门
- 其他的
- 按地区
- 北美洲
- 美国
- 加拿大
- 墨西哥
- 南美洲
- 巴西
- 阿根廷
- 其他南美洲
- 欧洲
- 德国
- 英国
- 法国
- 其他欧洲地区
- 亚太地区
- 中国
- 印度
- 日本
- 韩国
- 亚太其他地区
- 中东和非洲
- 中东
- 沙乌地阿拉伯
- 阿拉伯聯合大公国
- 其他中东地区
- 非洲
- 南非
- 奈及利亚
- 其他非洲地区
- 北美洲
第六章 竞争情势
- 市场集中度
- 策略趋势
- 市占率分析
- 公司简介
- IBM
- Cisco(AppDynamics)
- Splunk
- Dynatrace
- Broadcom(incl. VMware, CA)
- BMC
- BigPanda
- Moogsoft
- Elastic
- New Relic
- Datadog
- PagerDuty
- ServiceNow(Loom Systems)
- ExtraHop
- StackState
- OpsRamp
- Juniper(Mist AI)
- Microsoft Azure Monitor
- Amazon DevOps Guru
- Google Cloud AIOps(Operations Suite)
- SolarWinds
第七章 市场机会与未来展望
The AIOps market stood at USD 16.42 billion in 2025 and is forecast to reach USD 36.60 billion by 2030, advancing at a 17.39% CAGR.
Demand rises as enterprises struggle with complex hybrid clouds, escalating observability data, and the pressure to cut operating costs while raising service resilience. Vendors now embed large language models into traditional monitoring, enabling autonomous incident response that reduces noise, accelerates root-cause discovery, and optimizes capacity planning. Platform consolidation is gathering pace as buyers tire of fragmented tool sets that inflate license spend and slow decision-making. Consumption-based pricing and open standards such as OpenTelemetry also lower entry barriers, pulling small and medium enterprises into the purchasing cycle.
Global AIOps Market Trends and Insights
AI-Driven Observability Demand Surge
Telemetry volume now runs into petabytes per day, overwhelming traditional monitoring. Modern AIOps platforms correlate logs, metrics, and traces to cut alert noise by up to 75%, while mission-critical sectors such as financial services record 99% mainframe task automation after consolidation onto a single platform. The capability becomes pivotal as cloud-native applications generate 10 times more data than monoliths, making manual triage impractical. Vendors embed machine learning that detects anomalous patterns across data silos, preventing user-visible failures and sustaining uptime requirements.
Shift to Hybrid/Multi-Cloud Architectures
About 82% of enterprises run hybrid strategies and 92% use multiple public clouds, creating fragmented visibility and diverse API surfaces.Forty-five percent already deploy AIOps to unify monitoring, and early adopters report 38% faster incident resolution once cross-domain correlation is automated. Economic urgency mounts as cloud expenditure climbs, making algorithmic resource optimization a board-level priority.
Tool Sprawl and ROI Uncertainty
Many organizations still juggle five or more monitoring tools, fragmenting context and delaying action. Integration costs rise before AIOps delivers its promised value, creating executive hesitation. The pressure is most visible in North America, where budgets tighten and procurement teams demand clear business-case evidence before greenlighting new platforms.
Other drivers and restraints analyzed in the detailed report include:
- Need for Faster MTTR and SRE Adoption
- Gen-AI Copilots for Ops
- Shortage of AIOps-Savvy Talent
For complete list of drivers and restraints, kindly check the Table Of Contents.
Segment Analysis
Platform offerings captured 82.4% of 2024 revenue, reinforcing the view that unified telemetry ingestion and analytics trump point solutions. Services made up the remaining 17.6% as buyers sought configuration, model training, and change-management assistance. Enterprises confirm that a single console cuts swivel-chair fatigue and accelerates decision loops. Vendors now embed pretrained models that evolve through federated learning, raising detection accuracy over time. Services growth tracks the complexity of hybrid estates, where consultants map legacy systems into modern pipelines and enforce best-practice governance.
The platform-centric shift addresses lessons from earlier tool sprawl. Proprietary engines inside leading suites deliver granular anomaly scoring that is difficult to replicate via custom integration. Partner ecosystems deepen as specialists build turnkey dashboards and agentic add-ons. RapDev's Datadog-native AI agents illustrate the monetization potential in value-added layers, while IBM channels showcase Instana to capture adjacent service revenue.
On-premise deployments retained 56.2% share in 2024, upheld by strict data-residency rules in finance and government. The cloud segment, however, is scaling at an 18.7% CAGR to 2030 as buyers pivot to usage-based contracts that offload infrastructure management. Cloud vendors refresh AI models continuously, meaning subscribers gain incremental accuracy without forklift upgrades. Hybrid configurations now dominate proof-of-concept discussions, letting sensitive datasets stay on site while cloud analytics engines run correlation and inference at scale.
Cloud momentum signals a broader shift toward elasticity. When incidents spike, the platform can burst compute, completing multidimensional causal analysis in seconds. Encryption and zero-trust controls assuage prior security objections, encouraging even regulated entities to pilot managed observability. Cost governance features alert operations teams when ingestion volumes threaten budget thresholds, reducing surprise invoices.
Aiops Market is Segmented by Component (Platform and Services), Deployment Mode (On-Premises and Cloud), Organization Size (Small and Medium Enterprises and Large Enterprises), End-User Industry (IT and Telecom, BFSI, and More), and by Geography. The Market Forecasts are Provided in Terms of Value (USD).
Geography Analysis
North America led the AIOps market with 38.2% revenue in 2024. Early adopter enterprises, a robust vendor ecosystem, and sizable cloud budgets give the region scale advantages. Federal agencies log more than 1,200 AI use cases, 228 of which run in production, proving operational maturity in mission-critical settings. Mergers and acquisitions remain active, typified by ServiceNow's purchase of Logik.ai to enhance real-time workflow automation.
Asia-Pacific is the fastest-growing geography, forecasting a 19.2% CAGR. Governments in China, India, and Southeast Asian nations sponsor AI accelerators and subsidize cloud infrastructure, pushing enterprises to modernize operations. Observability investments deliver a median annual value of USD 10.08 million, exceeding other regions and highlighting the scale of digital transformation. Telecom operators integrate AIOps into 5G core networks to reduce outage penalties, while financial super-apps deploy anomaly detection to curb fraud at scale.
Europe maintains steady expansion propelled by ESG mandates, stringent data-sovereignty rules, and a preference for open standards. The region insists on algorithmic explainability, pressuring vendors to expose model logic and offer on-prem training options. Enterprises align AIOps rollouts with green-ops targets, measuring power consumption per telemetry gigabyte. Partnerships such as NTT DATA and HPE Aruba deliver sustainability-tuned observability suites that auto-scale resources in line with demand. Regulatory rigor slows initial procurement but ultimately cements vendor credibility when compliance certification is achieved.
- IBM
- Cisco (AppDynamics)
- Splunk
- Dynatrace
- Broadcom (incl. VMware, CA)
- BMC
- BigPanda
- Moogsoft
- Elastic
- New Relic
- Datadog
- PagerDuty
- ServiceNow (Loom Systems)
- ExtraHop
- StackState
- OpsRamp
- Juniper (Mist AI)
- Microsoft Azure Monitor
- Amazon DevOps Guru
- Google Cloud AIOps (Operations Suite)
- SolarWinds
Additional Benefits:
- The market estimate (ME) sheet in Excel format
- 3 months of analyst support
TABLE OF CONTENTS
1 INTRODUCTION
- 1.1 Study Assumptions and Market Definition
- 1.2 Scope of the Study
2 RESEARCH METHODOLOGY
3 EXECUTIVE SUMMARY
4 MARKET LANDSCAPE
- 4.1 Market Overview
- 4.2 Market Drivers
- 4.2.1 AI-driven observability demand surge
- 4.2.2 Shift to hybrid / multi-cloud architectures
- 4.2.3 Need for faster MTTR and SRE adoption
- 4.2.4 Gen-AI copilots for ops
- 4.2.5 FPGA/DPUs enabling real-time inference at edge
- 4.2.6 ESG-linked "green ops" compliance
- 4.3 Market Restraints
- 4.3.1 Tool sprawl and ROI uncertainty
- 4.3.2 Shortage of AIOps-savvy talent
- 4.3.3 Data-sovereignty/AI-governance hurdles
- 4.3.4 Vendor black-box algorithms and lock-in risk
- 4.4 Supply-Chain Analysis
- 4.5 Regulatory Landscape
- 4.6 Technological Outlook
- 4.7 Porter's Five Force Analysis
- 4.7.1 Bargaining Power of Suppliers
- 4.7.2 Bargaining Power of Buyers
- 4.7.3 Threat of New Entrants
- 4.7.4 Threat of Substitutes
- 4.7.5 Competitive Rivalry
- 4.8 Assesment of Macroeconomic Trends on the Market
5 MARKET SIZE AND GROWTH FORECASTS
- 5.1 By Component
- 5.1.1 Platform
- 5.1.2 Services
- 5.2 By Deployment Mode
- 5.2.1 On-premise
- 5.2.2 Cloud
- 5.3 By Organization Size
- 5.3.1 Small and Medium Enterprises
- 5.3.2 Large Enterprises
- 5.4 By End-User Industry
- 5.4.1 IT and Telecom
- 5.4.2 BFSI
- 5.4.3 Healthcare
- 5.4.4 Retail and E-commerce
- 5.4.5 Media and Entertainment
- 5.4.6 Manufacturing
- 5.4.7 Government and Public Sector
- 5.4.8 Others
- 5.5 By Geography
- 5.5.1 North America
- 5.5.1.1 United States
- 5.5.1.2 Canada
- 5.5.1.3 Mexico
- 5.5.2 South America
- 5.5.2.1 Brazil
- 5.5.2.2 Argentina
- 5.5.2.3 Rest of South America
- 5.5.3 Europe
- 5.5.3.1 Germany
- 5.5.3.2 United Kingdom
- 5.5.3.3 France
- 5.5.3.4 Rest of Europe
- 5.5.4 Asia-Pacific
- 5.5.4.1 China
- 5.5.4.2 India
- 5.5.4.3 Japan
- 5.5.4.4 South Korea
- 5.5.4.5 Rest of Asia-Pacific
- 5.5.5 Middle East and Africa
- 5.5.5.1 Middle East
- 5.5.5.1.1 Saudi Arabia
- 5.5.5.1.2 United Arab Emirates
- 5.5.5.1.3 Rest of Middle East
- 5.5.5.2 Africa
- 5.5.5.2.1 South Africa
- 5.5.5.2.2 Nigeria
- 5.5.5.2.3 Rest of Africa
- 5.5.1 North America
6 COMPETITIVE LANDSCAPE
- 6.1 Market Concentration
- 6.2 Strategic Moves
- 6.3 Market Share Analysis
- 6.4 Company Profiles (includes Global-level Overview, Market-level Overview, Core Segments, Financials, Strategic Info, Market Rank, Products and Services, Recent Developments)
- 6.4.1 IBM
- 6.4.2 Cisco (AppDynamics)
- 6.4.3 Splunk
- 6.4.4 Dynatrace
- 6.4.5 Broadcom (incl. VMware, CA)
- 6.4.6 BMC
- 6.4.7 BigPanda
- 6.4.8 Moogsoft
- 6.4.9 Elastic
- 6.4.10 New Relic
- 6.4.11 Datadog
- 6.4.12 PagerDuty
- 6.4.13 ServiceNow (Loom Systems)
- 6.4.14 ExtraHop
- 6.4.15 StackState
- 6.4.16 OpsRamp
- 6.4.17 Juniper (Mist AI)
- 6.4.18 Microsoft Azure Monitor
- 6.4.19 Amazon DevOps Guru
- 6.4.20 Google Cloud AIOps (Operations Suite)
- 6.4.21 SolarWinds
7 MARKET OPPORTUNITIES AND FUTURE OUTLOOK
- 7.1 White-space and Unmet-need Assessment
 IT 营运人工智慧市场(按组件、部署类型、企业规模和最终用户划分)—全球预测,2025 年至 2032 年
 全球AIOps市场报告,2025年AIOps 平台市场(按组件、组织规模、应用程式、产业和部署)—2025 年至 2030 年全球预测
 AIOps 平台市场按组件、组织规模、垂直产业和地区划分
 演算法IT营运的全球市场AIOps 市场机会、成长动力、产业趋势分析及 2025 - 2034 年预测
 全球人工智慧 IT 营运平台市场研究报告 - 产业分析、规模、份额、成长、趋势及 2025 年至 2033 年预测
 AIOps 市场规模、份额及成长分析(按产品、部署模式、应用、垂直领域和地区)-2025 年至 2032 年产业预测2025年IT营运平台人工智慧全球市场报告2025年电信营运资讯科技营运人工智慧(AIOps)全球市场报告