


 |
市场调查报告书
商品编码
1851063
废弃物管理:全球市场份额分析、行业趋势、统计数据和成长预测(2025-2030 年)Global Waste Management - Market Share Analysis, Industry Trends & Statistics, Growth Forecasts (2025 - 2030) |
||||||
※ 本网页内容可能与最新版本有所差异。详细情况请与我们联繫。
预计到 2025 年,废弃物管理市场将创造 1.43 兆美元的收入,到 2030 年将达到 1.97 兆美元,2025 年至 2030 年的复合年增长率为 6.62%。
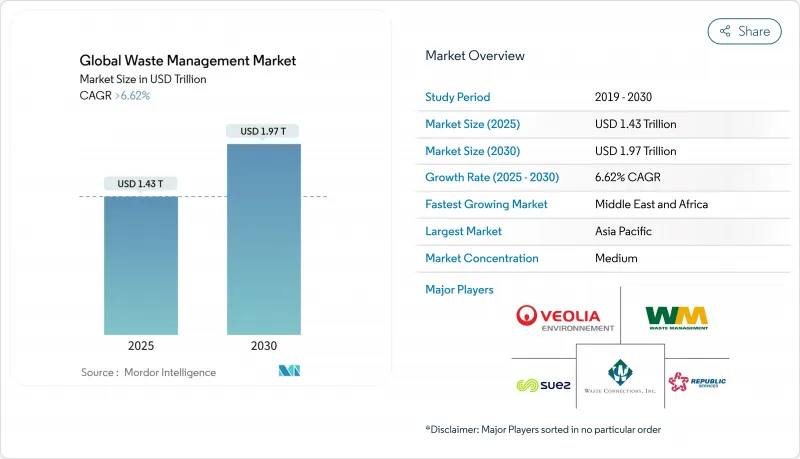
持续的监管压力、企业日益增长的废弃物承诺以及回收材料的商业化,正推动废弃物管理市场从以掩埋为中心的模式转向综合收集系统。欧盟和美国多个州已颁布生产者延伸责任制(EPR)法规,将处置成本转移给品牌所有者,并设立专门的资金池用于回收基础设施建设。同时,美国环保署(EPA)和欧盟强制推行的数位追踪平台正在催生一个全新的数据主导服务产业,而对配备碳捕获技术的垃圾焚化发电(WtE)设施的投资则正在释放负碳收入来源。预计到2024年,亚太地区将成为最大的区域,而中东和非洲(MEA)地区将在2030年之前成为成长最快的地区。受电动车电池即将淘汰的影响,电子废弃物是成长最快的废弃物流。
全球废弃物管理市场趋势与洞察
欧盟和北美地区的生产者延伸责任法规
强制性生产者责任延伸制度(EPR)正在重塑废弃物管理市场的成本结构,要求生产者资金筹措收集和回收的费用。加州SB 54法案规定,到2032年,塑胶包装的使用量必须减少25%,回收率必须达到65%。明尼苏达州于2024年与其他五个美国一同颁布了EPR法案。欧盟于2023年将EPR扩展到纺织品领域,由此催生了一个新的合规市场,鼓励废弃物处理业者整合并投资光学分拣和聚合物识别生产线,以赢得EPR资助的合约。肯亚于2024年推出的类似法规表明,这种模式正在全球范围内得到应用。
碳负排放目标推动垃圾焚化发电投资
净零排放承诺正推动资本流向配备燃烧后碳捕集技术的垃圾焚化发电厂。温哥华都会区一家日处理量720吨垃圾的工厂斥资1.01亿美元购置了一套每年可去除30万吨二氧化碳的设备,使其碳排放由正转负。在沙乌地阿拉伯,一项将300万吨城市固态废弃物转化为燃料的垃圾焚化发电计画旨在每年减少179万吨二氧化碳排放,同时向电网输送可再生电力。进入碳信用市场为营运商创造了新的收入来源。
南亚和非洲非正规部门的碎片化主导地位
普遍存在的非正规劳动力限制了正规废弃物管理市场的发展。在南非,每年有367万吨生活废弃物无人收集,助长了非法倾倒,并侵蚀了市政收入。在南亚,非正规的电子废弃物回收使工人暴露于重金属环境中,也阻碍了机构投资者为现代化工厂提供资金。将这些工人纳入规范的价值链需要培训和资金,而许多当地经营者无法承担,导致垃圾收集率低,损失严重。
细分市场分析
预计2024年工业废弃物将维持最强劲的成长势头,到2030年将以8.3%的复合年增长率成长,而同年生活废弃物在废弃物管理市场中占比最大,达到46.54%。企业排放要求正促使製造商将生产废弃物视为资源,增加了对现场包装、溶剂回收和闭合迴路物流的需求。酵母公司价值22.5亿美元的分子回收企业发展,旨在每年处理2.5亿磅复杂塑料,充分展现了工业领域的巨大机会。这种转变在中国和东南亚国协的电子、汽车和消费品工厂尤为明显。
儘管居民生活垃圾处理体系已趋于成熟,但由于都市化进程的加快,它们对于扩大整体废弃物管理市场规模仍然至关重要。各国政府正在实施颜色编码的路边垃圾收集计画和厨余垃圾垃圾厌氧消化设施,以达到减少掩埋的目标。零售连锁店的商业废弃物持续稳定成长,因为生产者责任延伸(EPR)费用用于资助门市前部垃圾收集基础设施。建筑和拆除废弃物正受到政策关注。印度修订后的建筑和拆除垃圾法规将于2025年4月生效,该法规将强制大型专案使用再生骨材,从而为破碎机提供可预测的垃圾量。废弃物和农业废弃物虽然是小众但成长迅速的通讯协定,计划传染性废弃物的强化处理规程促使农村地区的农业生物质被送往厌氧消化厂。
废弃物管理市场报告按产生来源(居民、商业(零售、办公室等)、工业及其他)、服务类型(收集、运输、分类/分离、处置/处理)、废弃物类型(城市固态废弃物、电子废弃物及其他)和地区(北美、欧洲及其他)进行细分。报告提供了上述所有细分市场的市场规模和预测(以美元计)。
区域分析
亚太地区预计到2024年将占全球销售额的56%,这主要得益于密集的製造业丛集和快速的城市化进程,由此产生了需要先进处理的多种材料废弃物。中国的《循环经济促进法》和日本的《塑胶资源回收法》要求生产商在设计产品时考虑可回收性,而印度的新规则要求公共基础设施建设使用再生砂和骨材。深圳、东京和班加罗尔等城市的政府部门正在推行垃圾倾倒系统,以鼓励居民进行生活垃圾分类。像微软这样的跨国公司,其位于新加坡的新资料中心已实现了85%的建筑废弃物回收率,这些公司正在签署区域性回收协议,以履行其零废弃物承诺。
中东和非洲是成长最快的地区,预计到2030年复合年增长率将达到9.1%。沙乌地阿拉伯投资与回收公司(SIRC)正在投资6.25亿美元建造固态制燃料和轮胎製油设施,以实现「2030愿景」中循环经济的里程碑目标。海湾合作委员会(GCC)于2025年2月签署的《废弃物发电合作协议》设定了40%的掩埋转移目标,并为阿布达比、麦纳麦和吉达的工厂建设工程总承包(EPC)计画提供了支持。同时,南非和肯亚正在试行推行数位化註册系统,以正式登记非正式垃圾收集者。
北美和欧洲是成熟但监管严格的市场。美国环保署 (EPA) 将于 2025 年要求所有危险废弃物出口都必须使用电子舱单,这将增加资料合规收入。白宫计划在 2027 年前逐步淘汰联邦采购中的一次性塑胶製品,预计将对供应商合约产生影响。欧洲将于 2024 年 5 月生效的废弃物运输法规将限制向非经合组织国家的出口,并要求在 2026 年前实现端到端的数位化追踪。
其他福利:
- Excel格式的市场预测(ME)表
- 3个月的分析师支持
目录
第一章 引言
- 调查范围
第二章调查方法
第三章执行摘要
第四章 市场洞察与动态
- 市场驱动因素
- 欧盟和北美地区的生产者延伸责任法规
- 碳负排放目标推动了对废弃物发电的投资
- 企业零废弃物承诺推动亚洲工业回收交易
- 美国环保署(EPA)和欧盟(EU)强制要求对废弃物流进行数位化追踪。
- 按需消费者运输应用程式促进了城市特大城市的货物收集。
- 电动车的普及导致锂离子电池废弃物迅速增加,从而催生了对专业回收的需求。
- 市场限制
- 南亚和非洲分散的非正规部门的优势
- 西欧对新建掩埋的监管禁令增加了合规成本。
- 回收产品价格不稳定阻碍了全球的回收投资。
- 禁止跨境废弃物运输削弱了盈利的贸易路线
- 价值/供应链分析
- 监理展望
- 技术展望
- Start-Ups生态系分析
- 主要新兴趋势
- 地缘政治衝击的影响
- 产业吸引力—五力分析
- 新进入者的威胁
- 买方的议价能力
- 供应商的议价能力
- 替代品的威胁
- 竞争对手之间的竞争
第五章 市场规模与成长预测
- 按排放源
- 住房
- 商业(零售、办公等)
- 工业的
- 医疗(健康和医药)
- 建设与拆除
- 其他(用于设施、农业等)
- 按服务类型
- 收集、运输、分类和分离
- 处置/处置
- 掩埋
- 回收和资源回收
- 焚烧和垃圾焚化发电
- 其他(化学处理、堆肥等)
- 其他(咨询、审核、训练等)
- 依废弃物类型
- 都市固态废弃物
- 工业用危险废弃物
- 电子废弃物
- 塑胶废弃物
- 医疗废弃物
- 建筑和拆除废弃物
- 农业废弃物
- 其他特殊废弃物(放射性物质等)
- 按地区
- 北美洲
- 美国
- 加拿大
- 墨西哥
- 南美洲
- 巴西
- 阿根廷
- 其他南美洲
- 亚太地区
- 中国
- 日本
- 印度
- 韩国
- 东协(印尼、泰国、菲律宾、马来西亚、越南)
- 澳洲
- 亚太其他地区
- 欧洲
- 英国
- 德国
- 法国
- 义大利
- 西班牙
- 俄罗斯
- 比荷卢经济联盟(比利时、荷兰、卢森堡)
- Nordix(丹麦、芬兰、冰岛、挪威、瑞典)
- 其他欧洲地区
- 中东和非洲
- 沙乌地阿拉伯
- 阿拉伯聯合大公国
- 卡达
- 土耳其
- 南非
- 埃及
- 奈及利亚
- 其他中东和非洲地区
- 北美洲
第六章 竞争情势
- 策略趋势
- 市占率分析
- 公司简介
- Veolia Environment SA
- Waste Management Inc.
- Suez SA
- Republic Services Inc.
- Waste Connections Inc.
- Clean Harbors Inc.
- Covanta Holding Corporation
- Biffa Group
- Remondis SE & Co. KG
- Stericycle Inc.
- GFL Environmental Inc.
- FCC Environment
- Cleanaway Waste Management Ltd
- Hitachi Zosen Inova AG
- Sims Limited
- Renewi PLC
- Averda
- Daiseki Co. Ltd
- Tatweer Environmental Services
- Waste Pro USA
- Recology
第七章 市场机会与未来展望
The Waste Management Market generated USD 1.43 trillion in 2025 and is forecast to reach USD 1.97 trillion by 2030, advancing at a 6.62% CAGR between 2025-2030.
Persistent regulatory pressure, expanding corporate zero-waste pledges, and the monetization of recovered materials are steering the waste management market away from landfill-centric models and toward integrated recovery systems. Extended Producer Responsibility (EPR) statutes in the European Union and several U.S. states are transferring disposal costs to brand owners, creating dedicated funding pools for recycling infrastructure. At the same time, the roll-out of mandatory digital tracking platforms by the U.S. EPA and the EU is spawning new data-driven service niches, while investments in waste-to-energy (WtE) facilities equipped with carbon-capture technology are unlocking carbon-negative revenue streams. Asia-Pacific held the largest regional position in 2024, and Middle East & Africa (MEA) is on track to be the fastest-growing geography through 2030 as governments allocate capital to diversion targets. E-waste represents the highest-velocity waste stream, propelled by looming electric-vehicle battery retirements.
Global Waste Management Market Trends and Insights
Extended Producer Responsibility regulations in EU & North America
Mandatory EPR schemes now require producers to finance collection and recycling, reshaping the cost base for the waste management market. California's SB 54 compels a 25% plastic-packaging reduction by 2032 along with a 65% recycling rate, and Minnesota joined five other U.S. states with its own 2024 EPR law. The EU extended EPR to textiles in 2023, creating new compliance markets that have encouraged waste-management operators to consolidate and invest in optical-sorting and polymer-identification lines to capture EPR-funded contracts. Comparable rules introduced in Kenya in 2024 demonstrate global diffusion of the model.
Carbon-negative targets driving WtE investments
Net-zero commitments are channeling capital toward WtE plants equipped with post-combustion carbon capture. Metro Vancouver's facility, processing 720 t/day of refuse, placed a USD 101 million price tag on equipment that will remove 300,000 tCO2 annually, flipping the emissions balance from positive to negative. In Saudi Arabia, a WtE program converting 3 million t of municipal solid waste into fuel aims to cut 1.79 million tCO2 per year while delivering renewable electricity to the grid. Access to carbon credit markets adds a new income layer for operators.
Fragmented informal sector dominance in South Asia & Africa
An extensive informal workforce limits formal penetration of the waste management market. South Africa leaves 3.67 million t of household waste uncollected each year, fostering illegal dumping and eroding municipal revenues. Informal e-waste recycling in South Asia exposes workers to heavy metals, discouraging institutional investors from funding modern plants. Integrating these workers into regulated value chains requires training and capital that many local operators cannot finance, keeping collection rates low and leakage high.
Other drivers and restraints analyzed in the detailed report include:
- Corporate zero-waste pledges spurring industrial recycling contracts in Asia
- Mandatory digital tracking of waste flows in the U.S. and EU
- Volatile recovered-commodity prices disincentivizing recycling investment
For complete list of drivers and restraints, kindly check the Table Of Contents.
Segment Analysis
Industrial waste retained the highest momentum in 2024 and is on course to post an 8.3% CAGR to 2030, while residential waste accounted for the largest 46.54% waste management market share that same year. Corporate emissions-reduction mandates are causing manufacturers to treat production scrap as a resource, boosting demand for on-site baling, solvent recovery, and closed-loop logistics. Eastman's USD 2.25 billion molecular-recycling roll-out, designed to handle 250 million lb of complex plastics annually, illustrates the scale of industrial opportunities. The shift is especially notable in electronics, automotive, and consumer-goods plants concentrated in China and ASEAN nations.
Residential streams, although mature, remain essential to the overall waste management market size because of rising urbanization. Governments are installing color-coded curbside programs and food-waste digesters to comply with landfill-diversion targets. Commercial waste from retail chains adds stable growth as EPR fees fund front-of-store collection infrastructure. Construction-and-demolition waste has gained policy attention; India's revised C&D rules, effective April 2025, oblige megaprojects to use recycled aggregates, generating predictable tonnage for crushers. Medical and agricultural wastes represent niche but expanding categories, with infectious-waste protocols tightened post-pandemic and agricultural biomass feeding anaerobic-digestion plants in rural zones.
The Waste Management Market Report is Segmented by Source (Residential, Commercial [Retail, Office, Etc. ], Industrial and More), by Service Type (Collection, Transportation, Sorting & Segregation and Disposal/Treatment), by Waste Type (Municipal Solid Waste, E-Waste and More) and by Geography (North America, Europe and More). The Report Offers Market Size and Forecasts in Value (USD) for all the Above Segments.
Geography Analysis
Asia-Pacific contributed 56% of global revenue in 2024, powered by dense manufacturing clusters and rapid urban migration that generate multi-material waste flows requiring advanced processing. China's Circular-Economy Promotion Law and Japan's Plastic Resource-Circulation Act obligate producers to design for recyclability, while India's new rules demand recycled sand and aggregate in public infrastructure. Urban authorities in Shenzhen, Tokyo, and Bengaluru have introduced pay-as-you-throw pricing that boosts household separation at source. Multinationals such as Microsoft, which achieved an 85% construction-waste diversion rate at its new Singapore data center, are executing regional recycling contracts to fulfill zero-waste pledges.
The Middle East & Africa is the fastest-expanding region, flashing a 9.1% CAGR outlook through 2030. Saudi Investment Recycling Company (SIRC) is deploying USD 625 million across refuse-derived-fuel and tire-to-oil facilities to meet Vision 2030 circular-economy milestones. The GCC Waste-to-Energy Cooperation Protocol, signed in February 2025, sets a 40% landfill-diversion target, galvanising plant EPC pipelines in Abu Dhabi, Manama, and Jeddah. Simultaneously, South Africa and Kenya are piloting digital registry systems to formalise informal collectors, though capacity gaps persist outside capital regions.
North America and Europe are mature but regulation-intensive markets. The U.S. EPA's 2025 mandate that all hazardous-waste exports traverse the e-Manifest expands data-compliance revenue. The White House strategy to phase out single-use plastics from federal procurement by 2027 is expected to ripple through supplier contracts. Europe's Waste Shipments Regulation, effective May 2024, restricts exports to non-OECD countries and requires end-to-end digital tracking by 2026.
- Veolia Environment SA
- Waste Management Inc.
- Suez SA
- Republic Services Inc.
- Waste Connections Inc.
- Clean Harbors Inc.
- Covanta Holding Corporation
- Biffa Group
- Remondis SE & Co. KG
- Stericycle Inc.
- GFL Environmental Inc.
- FCC Environment
- Cleanaway Waste Management Ltd
- Hitachi Zosen Inova AG
- Sims Limited
- Renewi PLC
- Averda
- Daiseki Co. Ltd
- Tatweer Environmental Services
- Waste Pro USA
- Recology
Additional Benefits:
- The market estimate (ME) sheet in Excel format
- 3 months of analyst support
TABLE OF CONTENTS
1 Introduction
- 1.1 Scope of the Study
2 Research Methodology
3 Executive Summary
4 Market Insights and Dynamics
- 4.1 Market Drivers
- 4.1.1 Extended Producer Responsibility Regulations in EU & North America
- 4.1.2 Carbon-Negative Targets Driving Waste-to-Energy Investments
- 4.1.3 Corporate Zero-Waste Pledges Spurring Industrial Recycling Contracts in Asia
- 4.1.4 Digital Tracking of Waste Flows Mandated by US EPA & EU
- 4.1.5 On-Demand Consumer Hauling Apps in Urban Mega-Cities Boosting Collection Volumes
- 4.1.6 Surge in Lithium-Ion Battery Waste from EV Adoption Creating Specialized Recycling Demand
- 4.2 Market Restraints
- 4.2.1 Fragmented Informal Sector Dominance in South Asia & Africa
- 4.2.2 Regulatory Moratoria on New Landfills in Western Europe Increasing Compliance Costs
- 4.2.3 Volatile Recovered Commodity Prices Disincentivizing Recycling Investments Globally
- 4.2.4 Cross-border Waste Shipment Bans Curtailing Profitable Trade Routes
- 4.3 Value / Supply-Chain Analysis
- 4.4 Regulatory Outlook
- 4.5 Technological Outlook
- 4.6 Startup Ecosystem Analysis
- 4.7 Key Emerging Trends
- 4.8 Impact of Geopolitical Shocks
- 4.9 Industry Attractiveness - Porter's Five Forces
- 4.9.1 Threat of New Entrants
- 4.9.2 Bargaining Power of Buyers
- 4.9.3 Bargaining Power of Suppliers
- 4.9.4 Threat of Substitute Products
- 4.9.5 Intensity of Competitive Rivalry
5 Market Size & Growth Forecasts (Value, In USD Billion)
- 5.1 By Source
- 5.1.1 Residential
- 5.1.2 Commercial (Retail, Office, etc.)
- 5.1.3 Industrial
- 5.1.4 Medical (Health and Pharmaceutical)
- 5.1.5 Construction & Demolition
- 5.1.6 Others (Institutional, Agricultural, etc)
- 5.2 By Service Type
- 5.2.1 Collection, Transportation, Sorting & Segregation
- 5.2.2 Disposal / Treatment
- 5.2.2.1 Landfill
- 5.2.2.2 Recycling & Resource Recovery
- 5.2.2.3 Incineration & Waste-to-Energy
- 5.2.2.4 Others (Chemical Treatment, Composting, etc.)
- 5.2.3 Others (Consulting, Audit & Training, etc.)
- 5.3 By Waste Type
- 5.3.1 Municipal Solid Waste
- 5.3.2 Industrial Hazardous Waste
- 5.3.3 E-waste
- 5.3.4 Plastic Waste
- 5.3.5 Biomedical Waste
- 5.3.6 Construction & Demolition Waste
- 5.3.7 Agricultural Waste
- 5.3.8 Other Specialized Waste (Radio Active, etc.)
- 5.4 By Geography
- 5.4.1 North America
- 5.4.1.1 United States
- 5.4.1.2 Canada
- 5.4.1.3 Mexico
- 5.4.2 South America
- 5.4.2.1 Brazil
- 5.4.2.2 Argentina
- 5.4.2.3 Rest of South America
- 5.4.3 Asia-Pacific
- 5.4.3.1 China
- 5.4.3.2 Japan
- 5.4.3.3 India
- 5.4.3.4 South Korea
- 5.4.3.5 ASEAN (Indonesia, Thailand, Philippines, Malaysia, Vietnam)
- 5.4.3.6 Australia
- 5.4.3.7 Rest of Asia-Pacific
- 5.4.4 Europe
- 5.4.4.1 United Kingdom
- 5.4.4.2 Germany
- 5.4.4.3 France
- 5.4.4.4 Italy
- 5.4.4.5 Spain
- 5.4.4.6 Russia
- 5.4.4.7 BENELUX (Belgium, Netherlands, and Luxembourg)
- 5.4.4.8 NORDICS (Denmark, Finland, Iceland, Norway, and Sweden)
- 5.4.4.9 Rest of Europe
- 5.4.5 Middle East and Africa
- 5.4.5.1 Saudi Arabia
- 5.4.5.2 United Arab Emirates
- 5.4.5.3 Qatar
- 5.4.5.4 Turkey
- 5.4.5.5 South Africa
- 5.4.5.6 Egypt
- 5.4.5.7 Nigeria
- 5.4.5.8 Rest of Middle East and Africa
- 5.4.1 North America
6 Competitive Landscape
- 6.1 Strategic Moves
- 6.2 Market Share Analysis
- 6.3 Company Profiles {(includes Global level Overview, Market level overview, Core Segments, Financials as available, Strategic Information, Products & Services, and Recent Developments)}
- 6.3.1 Veolia Environment SA
- 6.3.2 Waste Management Inc.
- 6.3.3 Suez SA
- 6.3.4 Republic Services Inc.
- 6.3.5 Waste Connections Inc.
- 6.3.6 Clean Harbors Inc.
- 6.3.7 Covanta Holding Corporation
- 6.3.8 Biffa Group
- 6.3.9 Remondis SE & Co. KG
- 6.3.10 Stericycle Inc.
- 6.3.11 GFL Environmental Inc.
- 6.3.12 FCC Environment
- 6.3.13 Cleanaway Waste Management Ltd
- 6.3.14 Hitachi Zosen Inova AG
- 6.3.15 Sims Limited
- 6.3.16 Renewi PLC
- 6.3.17 Averda
- 6.3.18 Daiseki Co. Ltd
- 6.3.19 Tatweer Environmental Services
- 6.3.20 Waste Pro USA
- 6.3.21 Recology
7 Market Opportunities & Future Outlook
 2026年全球放射性废弃物管理系统市场报告
 废弃物管理市场分析及预测(至2035年):按类型、产品、服务、技术、应用、材料类型、製程及最终用户划分
 南美洲废弃物管理:市场份额分析、行业趋势和统计数据、成长预测(2026-2031 年)新加坡废弃物管理市场:市场占有率分析、产业趋势与统计、成长预测(2026-2031年)越南废弃物管理:市场占有率分析、产业趋势与统计、成长预测(2026-2031)非洲废弃物管理:市场份额分析、行业趋势和统计数据、成长预测(2026-2031 年)
 全球多氟烷基物质(PFAS)废弃物管理市场规模、份额、趋势和成长分析报告(2026-2034年)
 废弃物管理市场规模、份额和趋势分析报告:按服务类型、废弃物类型、地区和细分市场预测,2026-2033年
 2026-2030年全球有机废弃物处理设备市场
 废弃物管理软体市场:2026-2032年全球预测(按服务模式、部署类型、组织规模、定价模式、应用程式和最终用户划分)