


 |
市场调查报告书
商品编码
1851069
演算法交易:市场份额分析、行业趋势、统计数据和成长预测(2025-2030 年)Algorithmic Trading - Market Share Analysis, Industry Trends & Statistics, Growth Forecasts (2025 - 2030) |
||||||
※ 本网页内容可能与最新版本有所差异。详细情况请与我们联繫。
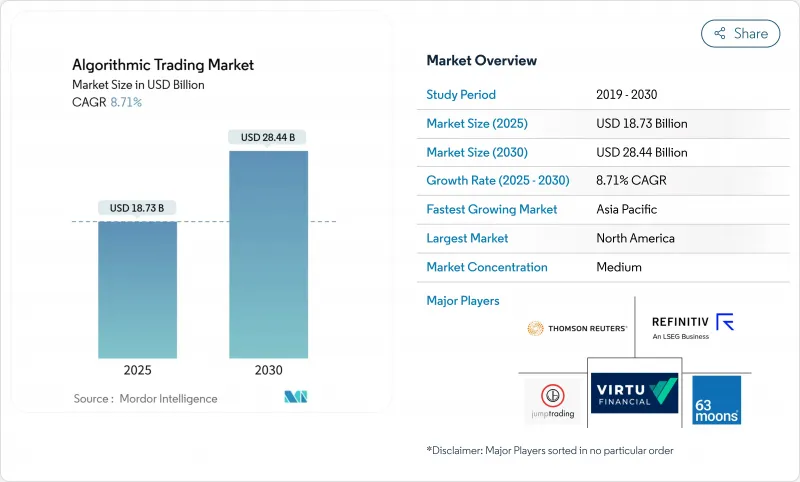
预计到 2025 年,演算法交易市场规模将达到 187.3 亿美元,到 2030 年将达到 284.4 亿美元,年复合成长率为 8.71%。
随着人工智慧技术提升执行品质并帮助交易员应对市场波动,其应用正在加速发展。北美交易所引领创新,而亚太地区的强劲需求正在扩大潜在用户群。儘管机构交易部门仍然是交易量的主要驱动力,但散户投资者对低程式码自动化的利用正在重塑竞争格局。与模型设计和合规相关的服务收入成长速度超过了平台收入,抵消了企业在安全本地基础设施方面不断增长的支出。同时,云端延迟的快速下降也吸引了那些曾经持观望态度的小型企业加入。
全球演算法交易市场趋势与洞察
对亚毫秒订单执行的需求日益增长
在美国和日本股市,延迟竞赛的焦点正从微秒转移到皮秒。各公司纷纷部署现场可编程闸阵列(FPGA)和客製化光纤线路,以缩短延迟,并试图从每年价值50亿美元的全球延迟套利市场中分一杯羹。专利诉讼凸显了速度的策略价值。但资本密集的升级可能会使天平向资金雄厚的企业倾斜,并加剧市场集中度。
被动投资资产的快速成长推动了指数再平衡演算法的更新换代
到2024年,全球ETF资产规模将达到13.8兆美元。资金再平衡流动会形成庞大且时间紧迫的订单簿,这需要复杂的演算法执行才能在不影响价格的情况下追踪基准权重。过去十年,被动型UCITS基金在欧洲的份额增长了一倍以上,这增加了对能够应对复杂相关性并最大限度减少市场衝击的跨资产模型的需求。
交易所託管成本不断上涨,对中型交易平台带来压力。
更高的费用,例如MIAX PEARL的10Gb超长距离光纤网路月费涨至13,500美元,可能会给中型自营网路营运商的资产负债表带来压力,并迫使它们缩减规模。高昂的进入门槛虽然保护了现有营运商,但也缩小了竞争范围,并可能降低低销售产品的价差。
细分市场分析
到2024年,机构投资者将占据演算法交易市场61%的份额,这得益于雄厚的资本和完善的基础设施。然而,随着易于使用的平台不断复製机构套件,散户交易者正以10.8%的复合年增长率快速成长。经纪商入口网站现在将策略建构器、订单路由演算法和回测库捆绑在一起,降低了技术门槛。教育倡议将透过建立信任和普及自动化技术来促进其应用。监管机构将继续保持警惕,确保为非专业用户提供充分的保障。
零售参与能够带来新的订单流,并促进价格竞争。然而,零售交易量的增加也提高了对稳健风险管理的需求,因为众包模式可能导致意想不到的价格趋同。经纪商分析显示,他们越来越倾向于利用日内微观结构进行短週期交易的策略,这与机构的超短线交易策略类似。随着时间的推移,零售交易量的涌入可能会削弱传统交易部门在某些流动性热点领域的主导地位。
到2024年,整合了执行引擎、分析仪錶板和连接适配器的解决方案将占据演算法交易市场73.5%的份额。然而,服务领域的复合年增长率预计将达到11.6%,反映出市场对客製化模型调优、监管报告和自订资料整合的需求。客户越来越多地将强化学习策略校准和交易后场所分析等专业任务外包给兼具金融工程和特定领域人工智慧技能的专业顾问。
服务业的兴起源自于规则的快速变化,需要持续不断的重新编码。缺乏内部量化能力的公司依赖咨询团队来维护程式码库、检验模型风险、审核可解释性等等。随着向云端原生管道的转变,同时具备DevOps和交易逻辑专业知识的服务公司正在获得更广泛的收入来源。
演算法交易市场按交易者类型(机构、零售、长期、短期)、组件(解决方案、服务)、部署类型(云端、本地部署)、组织规模(小型、中型、大型企业)和地区进行细分。市场预测以美元(USD)计价。
区域分析
到2024年,北美将占全球收入的47.3%。监管透明度的提高、密集的交易所网络以及资产管理公司与技术供应商之间的紧密合作,都为这一增长提供了支撑。美国证券交易委员会(SEC)对《全国市场体系监管条例》(Regulation NMS)的更新提高了透明度标准,并强化了演算法交易作为合规要求的条款。人工智慧驱动的情绪分析已经开始影响大型股的订单簿,而对中点指标的机器学习研究正在催生新的流动性寻求策略。
亚太地区是最具活力的地区,预计到2030年将以12.4%的复合年增长率成长。日本成熟的证券交易所基础设施支援皮秒交易实验,而中国则在扩张的同时提高高频交易费用,旨在抑制过度交易。东南亚的加密货币交易所正在输出标准化应用程式介面(API),将数位资产流动性与股票和外汇交易流程整合。印度监管机构正在製定指导方针,在维持系统性保障措施的前提下,向更广泛的零售用户开放演算法交易。
由于MiFID II的实施,欧洲正处于关键地位。严格的透明度和熔断机制要求推动了对审核程式码的需求。被动投资资金流主导交易量,迫使服务提供者改进指数再平衡演算法以减少追踪误差。欧洲中央银行(ECB)的稳定性评估报告警告称,随着自动资金流的退出,高估值可能会加剧风险,凸显了情境测试的必要性。中东和非洲的多交易商外汇交易平台正开始弥合历史性的流动性缺口,系统性基金正在部署先前难以企及的交叉货币利差。
其他福利:
- Excel格式的市场预测(ME)表
- 3个月的分析师支持
目录
第一章 引言
- 研究假设和市场定义
- 调查范围
第二章调查方法
第三章执行摘要
第四章 市场情势
- 市场概览
- 市场驱动因素
- 美国和日本股票市场对亚毫秒订单执行的需求日益增长
- 被动投资余额激增推动欧洲指数再平衡演算法的发展
- 扩大东南亚加密货币交易所API流动性池
- 透过中东和非洲的多交易商平台整合分散的外汇流动性
- 人工智慧主导的情绪资讯来源(另类数据)在美国大型股票交易中的普及
- 加强最佳执行的监管(MiFID II、SEC Reg NMS现代化)
- 市场限制
- 交易所託管成本不断上涨,对中型自营交易平台带来压力。
- 「闪崩」期间流动性瞬间丧失
- 欧盟对高频交易欺骗行为处以严厉的市场监管罚款
- 新兴交易所资料馈送的延迟差异
- 监理展望
- 波特五力分析
- 供应商的议价能力
- 买方/投资者的议价能力
- 新进入者的威胁
- 替代品的威胁
- 竞争对手之间的竞争
- 技术概览
- 演算法交易策略
- 动量交易
- 套利
- 趋势追踪
- 执行导向型策略
- 情绪分析
- 指数型基金再平衡
- 基于数学模型
- 其他策略
- 演算法交易策略
- 宏观经济因素如何影响市场
第五章 市场规模与成长预测
- 按交易者类型
- 机构投资者
- 散户投资者
- 长期交易者
- 短期交易者
- 按组件
- 解决方案
- 平台
- 软体工具
- 服务
- 解决方案
- 透过部署
- 云
- 本地部署
- 按公司规模
- 小型企业
- 大公司
- 按地区
- 北美洲
- 美国
- 加拿大
- 墨西哥
- 南美洲
- 巴西
- 阿根廷
- 智利
- 秘鲁
- 其他南美洲
- 欧洲
- 德国
- 英国
- 法国
- 义大利
- 西班牙
- 其他欧洲地区
- 亚太地区
- 中国
- 日本
- 韩国
- 印度
- 澳洲
- 纽西兰
- 亚太其他地区
- 中东和非洲
- 阿拉伯聯合大公国
- 沙乌地阿拉伯
- 土耳其
- 南非
- 其他中东和非洲地区
- 北美洲
第六章 竞争情势
- 策略发展
- 供应商定位分析
- 公司简介
- Thomson Reuters Corp.
- Refinitiv Ltd
- Virtu Financial Inc.
- Jump Trading LLC
- Citadel Securities LLC
- Hudson River Trading LLC
- Tower Research Capital LLC
- XTX Markets Ltd
- Goldman Sachs Group Inc.
- JPMorgan Chase and Co.
- IG Group Holdings plc
- 63 Moons Technologies Ltd
- MetaQuotes Software Corp.
- Symphony Fintech Solutions Pvt Ltd
- InfoReach Inc.
- AlgoTrader AG
- ARGO SE
- Kuberre Systems Inc.
- KCG Holdings LLC
- DRW Holdings LLC
第七章 市场机会与未来展望
The algorithmic trading market size is estimated at USD 18.73 billion in 2025 and is forecast to reach USD 28.44 billion by 2030, expanding at an 8.71% CAGR.
Uptake is accelerating as artificial-intelligence techniques boost execution quality and allow traders to cope with volatile conditions. Exchanges in North America lead innovation, while robust demand from Asia-Pacific widens the addressable user base. Institutional desks still anchor volumes, yet retail access to low-code automation is reshaping competitive dynamics. Services linked to model design and compliance are outpacing platform revenues, counterbalancing heavier spending on secure on-premise infrastructure. At the same time, cloud latency is falling fast enough to tempt smaller firms that once sat on the sidelines.
Global Algorithmic Trading Market Trends and Insights
Rising demand for sub-millisecond order execution
Latency competition has moved from microseconds to picoseconds in US and Japanese equities. Firms deploy field-programmable gate arrays and bespoke fibre routes to shave time, aiming to capture part of the USD 5 billion global value tied to latency arbitrage each year . Litigation over patent rights underscores the strategic value of speed. Capital-intensive upgrades, however, tilt the advantages toward well-funded players and may heighten market concentration.
Surging passive-investment AUM fuelling index-rebalance algos
Global ETF assets touched USD 13.8 trillion in 2024 . Rebalancing flows trigger large, time-compressed orders that demand sophisticated algorithmic execution able to track benchmark weights without moving prices. Europe's share of passive UCITS funds more than doubled over the past decade, intensifying the need for cross-asset models that minimise market impact while coping with complex correlations.
Rising exchange colocation costs squeezing mid-tier desks
Fee hikes such as the increase to USD 13,500 per month for 10 Gb ULL fibre at MIAX PEARL weigh on balance sheets and may force mid-sized proprietary shops to scale back. High entry costs protect incumbents but thin the competitive field, potentially reducing spread tightness in less-traded instruments.
Other drivers and restraints analyzed in the detailed report include:
- Expansion of crypto-exchange API liquidity pools
- Regulatory push for best-execution
- Instant loss of liquidity during flash-crash events
For complete list of drivers and restraints, kindly check the Table Of Contents.
Segment Analysis
Institutional investors commanded 61% of the algorithmic trading market in 2024, anchored by deep capital and infrastructure. Retail traders, however, are growing fastest at a 10.8% CAGR as easy-to-use platforms replicate institutional toolkits. Brokerage portals now bundle strategy builders, order-routing algos, and back-testing libraries, lowering technical barriers. Educational initiatives reinforce adoption by boosting trust and demystifying automation. Regulatory bodies remain vigilant to ensure adequate safeguards for non-professional users.
Retail participation injects fresh order flow and fosters competitive quoting. Yet heavier retail turnover also magnifies the need for robust risk controls because crowd-sourced models can unintentionally converge. Brokerage analytics show rising preference for short-cycle strategies that exploit intraday micro-structure, often mirroring institutional scalping tactics. Over time, the influx of retail volumes can dilute traditional desk advantages in certain liquidity pockets.
Solutions captured 73.5% of the algorithmic trading market share in 2024, bundling execution engines, analytics dashboards, and connectivity adapters. Still, the services segment is on an 11.6% CAGR trajectory, reflecting appetite for bespoke model tuning, regulatory reporting, and custom data integration. Clients increasingly outsource niche tasks such as reinforcement-learning policy calibration or post-trade venue analysis to specialist consultants, who combine financial engineering with domain-specific AI skills.
The rise in services is reinforced by rapid rule changes that require continual recoding. Firms lacking in-house quant bandwidth lean on advisory teams to maintain code bases, validate model risk, and conduct explainability audits. Coupled with the shift to cloud-native pipelines, service firms that master both DevOps and trading logic find a widening revenue pool.
Algorithmic Trading Market is Segmented by Types of Traders (Institutional Investors, Retail Investors, Long-Term Traders, Short-Term Traders), Component (Solutions, Services), Deployment (Cloud, On-Premise), Organisation Size (Small and Medium Enterprises, Large Enterprises), Geography. The Market Forecasts are Provided in Terms of Value (USD).
Geography Analysis
North America contributed 47.3% of global turnover in 2024. Regulatory clarity, a dense exchange network, and close integration between asset managers and technology vendors sustain growth. The SEC's update to Regulation NMS raises transparency standards, reinforcing algorithmic execution as a compliance necessity. AI-based sentiment analytics already influence large-cap order books, while research into machine-learning midpoint indicators fosters novel liquidity-seeking strategies.
Asia-Pacific delivers the strongest momentum, projected at a 12.4% CAGR through 2030. Japan's mature equity venue infrastructure supports picosecond experimentation, whereas China balances expansion with higher HFT fees aimed at curbing excess churn. South-East Asian crypto venues export standardised APIs, blending digital-asset liquidity with equities and FX workflows. India's regulator is drafting guidelines to open algorithmic trading to a broader retail base while preserving systemic safeguards.
Europe occupies a pivotal position shaped by MiFID II. Stringent transparency and circuit-breaker obligations heighten demand for auditable code. Passive-investment flows dominate turnover, pushing providers to refine index-rebalance algos that mitigate tracking error. The European Central Bank's stability review warns that high valuations could amplify risks when automated flows unwind, underscoring the need for scenario testing . Multi-dealer FX portals in the Middle East and Africa begin to close historical liquidity gaps, inviting systematic funds to deploy cross-currency spreads previously deemed infeasible.
- Thomson Reuters Corp.
- Refinitiv Ltd
- Virtu Financial Inc.
- Jump Trading LLC
- Citadel Securities LLC
- Hudson River Trading LLC
- Tower Research Capital LLC
- XTX Markets Ltd
- Goldman Sachs Group Inc.
- JPMorgan Chase and Co.
- IG Group Holdings plc
- 63 Moons Technologies Ltd
- MetaQuotes Software Corp.
- Symphony Fintech Solutions Pvt Ltd
- InfoReach Inc.
- AlgoTrader AG
- ARGO SE
- Kuberre Systems Inc.
- KCG Holdings LLC
- DRW Holdings LLC
Additional Benefits:
- The market estimate (ME) sheet in Excel format
- 3 months of analyst support
TABLE OF CONTENTS
1 INTRODUCTION
- 1.1 Study Assumptions and Market Definition
- 1.2 Scope of the Study
2 RESEARCH METHODOLOGY
3 EXECUTIVE SUMMARY
4 MARKET LANDSCAPE
- 4.1 Market Overview
- 4.2 Market Drivers
- 4.2.1 Rising demand for sub-millisecond order execution across US and Japanese equity venues
- 4.2.2 Surging passive-investment AUM fuelling index-rebalance algos in Europe
- 4.2.3 Expansion of crypto-exchange API liquidity pools in South-East Asia
- 4.2.4 Consolidation of fragmented FX liquidity via multi-dealer platforms in ME and Africa
- 4.2.5 Proliferation of AI-driven sentiment feeds (alt-data) in US large-cap trading
- 4.2.6 Regulatory push for best-execution (MiFID II, SEC Reg NMS modernisation)
- 4.3 Market Restraints
- 4.3.1 Rising exchange colocation costs squeezing mid-tier prop desks
- 4.3.2 Instant loss of liquidity during "flash-crash" events
- 4.3.3 Stringent market-surveillance fines on HFT spoofing in EU
- 4.3.4 Data-feed latency differentials in emerging exchanges
- 4.4 Regulatory Outlook
- 4.5 Porter's Five Forces Analysis
- 4.5.1 Bargaining Power of Suppliers
- 4.5.2 Bargaining Power of Buyers / Investors
- 4.5.3 Threat of New Entrants
- 4.5.4 Threat of Substitutes
- 4.5.5 Intensity of Competitive Rivalry
- 4.6 Technology Snapshot
- 4.6.1 Algorithmic Trading Strategies
- 4.6.1.1 Momentum Trading
- 4.6.1.2 Arbitrage Trading
- 4.6.1.3 Trend Following
- 4.6.1.4 Execution-based Strategies
- 4.6.1.5 Sentiment Analysis
- 4.6.1.6 Index-fund Rebalancing
- 4.6.1.7 Mathematical-model-based
- 4.6.1.8 Other Strategies
- 4.6.1 Algorithmic Trading Strategies
- 4.7 Impact of Macroeconomic Factors on the Market
5 MARKET SIZE AND GROWTH FORECASTS (VALUE)
- 5.1 By Types of Traders
- 5.1.1 Institutional Investors
- 5.1.2 Retail Investors
- 5.1.3 Long-term Traders
- 5.1.4 Short-term Traders
- 5.2 By Component
- 5.2.1 Solutions
- 5.2.1.1 Platforms
- 5.2.1.2 Software Tools
- 5.2.2 Services
- 5.2.1 Solutions
- 5.3 By Deployment
- 5.3.1 Cloud
- 5.3.2 On-premise
- 5.4 By Organisation Size
- 5.4.1 Small and Medium Enterprises
- 5.4.2 Large Enterprises
- 5.5 By Geography
- 5.5.1 North America
- 5.5.1.1 United States
- 5.5.1.2 Canada
- 5.5.1.3 Mexico
- 5.5.2 South America
- 5.5.2.1 Brazil
- 5.5.2.2 Argentina
- 5.5.2.3 Chile
- 5.5.2.4 Peru
- 5.5.2.5 Rest of South America
- 5.5.3 Europe
- 5.5.3.1 Germany
- 5.5.3.2 United Kingdom
- 5.5.3.3 France
- 5.5.3.4 Italy
- 5.5.3.5 Spain
- 5.5.3.6 Rest of Europe
- 5.5.4 Asia-Pacific
- 5.5.4.1 China
- 5.5.4.2 Japan
- 5.5.4.3 South Korea
- 5.5.4.4 India
- 5.5.4.5 Australia
- 5.5.4.6 New Zealand
- 5.5.4.7 Rest of Asia-Pacific
- 5.5.5 Middle East and Africa
- 5.5.5.1 United Arab Emirates
- 5.5.5.2 Saudi Arabia
- 5.5.5.3 Turkey
- 5.5.5.4 South Africa
- 5.5.5.5 Rest of Middle East and Africa
- 5.5.1 North America
6 COMPETITIVE LANDSCAPE
- 6.1 Strategic Developments
- 6.2 Vendor Positioning Analysis
- 6.3 Company Profiles (includes Global level Overview, Market level overview, Core Segments, Financials as available, Strategic Information, Products and Services, and Recent Developments)
- 6.3.1 Thomson Reuters Corp.
- 6.3.2 Refinitiv Ltd
- 6.3.3 Virtu Financial Inc.
- 6.3.4 Jump Trading LLC
- 6.3.5 Citadel Securities LLC
- 6.3.6 Hudson River Trading LLC
- 6.3.7 Tower Research Capital LLC
- 6.3.8 XTX Markets Ltd
- 6.3.9 Goldman Sachs Group Inc.
- 6.3.10 JPMorgan Chase and Co.
- 6.3.11 IG Group Holdings plc
- 6.3.12 63 Moons Technologies Ltd
- 6.3.13 MetaQuotes Software Corp.
- 6.3.14 Symphony Fintech Solutions Pvt Ltd
- 6.3.15 InfoReach Inc.
- 6.3.16 AlgoTrader AG
- 6.3.17 ARGO SE
- 6.3.18 Kuberre Systems Inc.
- 6.3.19 KCG Holdings LLC
- 6.3.20 DRW Holdings LLC
7 MARKET OPPORTUNITIES AND FUTURE OUTLOOK
- 7.1 White-space and Unmet-need Assessment
 演算法交易市场规模、份额、趋势和预测:按交易类型、组成部分、部署模式、组织规模和地区划分,2026-2034 年
 演算法交易市场分析及至2035年预测:按类型、产品类型、服务、技术、组件、应用、部署类型、最终用户、功能及解决方案划分
 金融交易软体市场:按解决方案、资产类别、部署方式、组织规模和最终用户划分,全球预测(2026-2032 年)
 演算法交易市场规模、份额和成长分析(按组件、公司规模、类型、部署类型、最终用户和地区划分)—产业预测(2026-2033 年)
 演算法交易市场-2025-2030年预测全球演算法交易市场(按组件、部署、交易模型、应用程式和最终用户划分)—2025-2032 年全球预测
 2025年全球演算法交易软体市场报告2025年演算法交易全球市场报告2025年自动演算法交易全球市场报告全球演算法交易市场规模(按类型、部署、最终用户、区域覆盖和预测)