


 |
市场调查报告书
商品编码
1851109
智慧型手机:市场占有率分析、产业趋势、统计数据和成长预测(2025-2030 年)Smartphones - Market Share Analysis, Industry Trends & Statistics, Growth Forecasts (2025 - 2030) |
||||||
※ 本网页内容可能与最新版本有所差异。详细情况请与我们联繫。
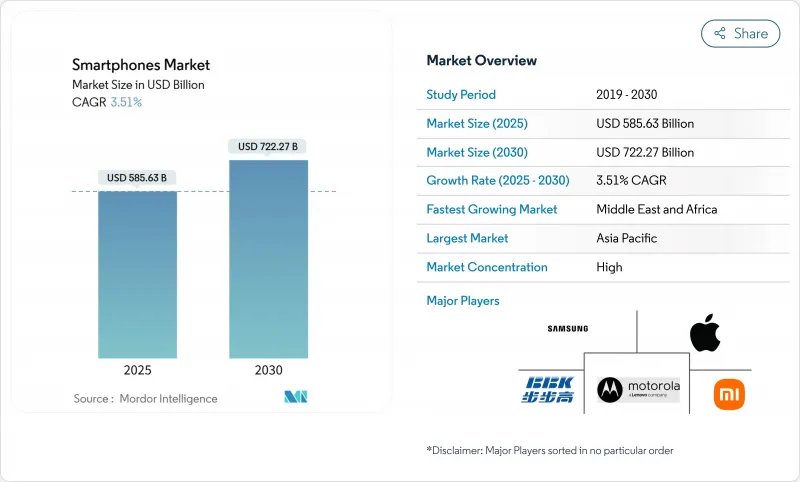
预计到 2025 年智慧型手机市场规模将达到 5,856.3 亿美元,到 2030 年将达到 7,222.7 亿美元,在预测期(2025-2030 年)内复合年增长率为 3.51%。
由于用户倾向于选择更高记忆体配置、多摄影机阵列和嵌入式人工智慧 (AI) 引擎,并对高阶产品提出更高的价格要求,因此收入成长速度超过了出货量成长速度。儘管售价超过 800 美元的设备在全球销量中所占比例不高,但它们在行业利润中所占的份额却越来越大。到 2024 年,亚太地区的智慧型手机市占率将达到 56.9%,但成长方向正在分化:中国目前是一个更换主导的市场,而印度、印尼和越南仍拥有大量首次购买智慧型手机的用户。近期零售价格和关税数据显示,一些新兴国家本币贬值正在刺激国内组装,在外汇波动的情况下维持入门级产品价格的稳定。
未来十年,三大结构性因素将塑造智慧型手机产业。首先,5G网路覆盖范围正从4G网路覆盖不足的低人口密度地区扩展至全国,使得后发厂商能够跳过一代网路。其次,即时翻译、影像产生和会议记录摘要等生成式人工智慧功能正从云端处理转向设备端处理,引发了神经网路处理单元和记忆体频宽的新一轮规格之争。第三,先进半导体的地缘政治限制迫使各大品牌实现采购多元化并重新设计供应链。这些因素共同作用,使得智慧型手机产业虽然整体渗透率已趋于成熟,但随着厂商将功能部署与灵活的生产布局相匹配,仍能找到盈利的细分市场。 2024-2025年的产品发表计画便体现了这种调整。许多品牌将旗舰产品的发布间隔从12个月延长至大约18个月。
全球智慧型手机市场趋势与洞察
5G网路商业化:加速设备升级週期
5G的广泛应用推动了消费者对更高吞吐量和更低延迟的需求,缩短了更换週期。目前全球已有近300个商用网路运作,通讯业者也已开始取代老旧的3G频谱,以扩展中频段5G容量。随着代工厂提供更具成本效益的6nm和4nm製程工艺,设备平均售价持续下降,即使在价格敏感型市场,也推动了主流市场的普及。虽然增强型行动宽频仍然是主要应用场景,但固定无线存取(FWA)用户数量正在快速增长,满足了服务不足的农村地区不断增长的设备需求。这项发展动能将提振整体无线存取投资,并确保一系列功能丰富的中阶智慧型手机能够满足升级用户的需求。
印度和东南亚对中高阶设备的需求激增
印度、印尼和越南消费者可支配收入的成长和消费意愿的提升,推动了200-499美元价位段智慧型手机的蓬勃发展。消费者希望以实惠的价格分布获得高更新率OLED面板、多镜头成像和5G功能,而中国OEM厂商正积极瞄准这一市场。预计到2023年,印度智慧型手机的平均售价将上涨至255美元,这标誌着消费者对入门级设备的消费需求将显着下降。在地化的线上管道和精准的新品发布计划,使得智慧型手机销售出现週期性高峰,且往往与节日季节相吻合。因此,中高阶机型在电商平台的限时抢购活动中占据了更大的份额,进一步强化了网路升级和设备功能需求的循环。
全球经济放缓影响更换週期
通膨压力和外汇波动促使消费者延长手机使用寿命至三年以上。厂商纷纷承诺提供七年安全更新和电池更换服务以应对,但整体销售成长乏力。翻新智慧型手机市场受益于向通讯业者提供支援4G或5G频段的低成本入门级设备。高利率也抑制了发展中地区的资金筹措活动,并促使主要零售商谨慎管理库存。儘管平均售价(ASP)有所上涨,但不断上涨的零件成本限制了利润率的扩张。
细分市场分析
预计到2024年,Android仍将维持84.1%的市场份额,但iOS将以4.5%的复合年增长率成为成长最快的市场,从而支撑其营收成长动能。随着苹果在中价格分布拓展销售,并在新兴国家支援在地化支付方式,iOS智慧型手机市场规模预计将迅速扩张。近95%的专利使用费确保了稳定的升级换代,而苹果晶片的持续整合将带来更高的能效,延长设备寿命并提升残值。 Android将与完全运行在装置端的Gemini AI引擎竞争,后者能够增强隐私保护和情境感知能力。 OEM厂商正在利用开放原始码的灵活性来实现差异化,但係统碎片化仍然阻碍着及时发布安全性修补程式。
苹果带着全新SE系列进军小萤幕市场,目标客群是那些在经济衰退期间更换购机的用户。鸿蒙操作系统Next采用微核心架构,使华为成为中国唯一垂直整合的替代生态系统。 KaiOS仍然非常适合对成本敏感的市场中功能丰富的4G设备,它以极低的记忆体占用提供以语音为中心的服务。儘管未来互通的AI框架可能会模糊作业系统之间的界限,但iOS和Android成熟的应用程式库将继续支援开发者的投入,并巩固两家公司在智慧型手机市场的主导地位。
入门级智慧型手机(售价低于200美元)预计在2024年将占出货量的38.5%,为数百万用户提供首次网路存取。然而,超高阶智慧型手机市场将实现6.2%的复合年增长率,显示消费者愿意在更长的使用週期内分摊更高的支出。儘管在上市初期销售份额下降,但高阶旗舰机型将贡献高达75%的收入,进而提升厂商的盈利。由于折迭式和人工智慧手机等需要昂贵组件的产品也受到强劲需求,预计超高阶智慧型手机市场规模将稳定成长。
售价在 200 至 499 美元之间的中阶如今也配备了高解析度显示器、大尺寸感测器和即时充电功能,这些功能以往通常只出现在价格分布更高的机型上。随着中国 OEM 厂商每季更新换代产品以维持市场热度,竞争动态激烈。在巴西等市场,进口关税推高了成本,促使消费者转向翻新的中高端机型。售价在 500 至 799 美元之间的高阶机型则扮演着光环产品的角色,吸引用户加入一个能够透过云端储存等售后服务实现盈利的生态系统。这条产业链平衡了销售和价值,这是智慧型手机市场中各个细分市场盈利健康的先决条件。
区域分析
2024年,亚太地区将占全球智慧型手机出货量的56.9%,主要得益于中国和印度庞大的装置量以及5G的快速普及。中国本土品牌凭藉极具竞争力的价格和摄影机创新赢得了市场份额,而印度政府支持的生产连结奖励计画吸引了新工厂入驻并降低了进口关税。农村宽频倡议鼓励了新厂商首次进入智慧型手机市场,从而提升了整体渗透率。以旧换新方案和分期付款选项进一步刺激了用户升级换代,尤其是在二线城市。日益严格的本地化要求将促使供应商在国内采购显示器和电池,从而增强区域供应的韧性。加强资料本地化的监管措施可能会增加合规成本,但也可能透过自主云端集成为供应商创造机会。
北美市场按以金额为准排名第二,但由于市场高度饱和,销售成长正在放缓。 iOS 57.9% 的市占率反映了硬体、服务和内容生态系统的整合。通讯业者正在偏远地区试验卫星通讯作为安全功能,这需要支援L波段链路的数据机。企业采用人工智慧设备进行现场诊断,使得企业更换週期接近 24 个月,部分抵销了消费者较长的更换週期。中频段 5G 频谱竞标正在进行中,确保了网路持续增强,并支撑了对相容旗舰设备的需求。
预计到2030年,中东和非洲智慧型手机市场将以5.2%的复合年增长率成长。年轻化人口结构、5G网路的逐步普及以及透过小额贷款应用程式进行的设备资金筹措的兴起将支撑市场需求。埃及正在崛起为区域组装中心,为洲内分销提供海关优势。与发薪日相契合的限时抢购活动刺激了销售快速成长,使那些能够有效协调物流的品牌受益。在撒哈拉以南非洲地区,太阳能充电亭提供离网充电服务,并提高了农村地区的设备普及率。营运商与金融科技平台之间的合作促进了小额信贷的发展,使入门级智慧型手机价格更加亲民,从而提升了智慧型手机市场的整体普及率。
其他福利:
- Excel格式的市场预测(ME)表
- 3个月的分析师支持
目录
第一章 引言
- 研究假设和市场定义
- 调查范围
第二章调查方法
第三章执行摘要
第四章 市场情势
- 市场概览
- 市场驱动因素
- 5G网路的商业化将加快设备升级週期。
- 印度和东南亚对中高阶设备的需求激增
- 来自轻晶圆代工厂(例如台积电 6nm)的低成本 5G 晶片组的兴起
- 营运商主导的设备融资模式在北美地区扩展
- 非洲的电子商务闪购和促销活动推动了销售量。
- 企业移动性计画提升了澳洲矿业领域对加强型智慧型手机的采用率
- 市场限制
- 全球经济放缓将影响更换週期
- 美国和中国的技术制裁限制了高端零件的供应。
- 记忆体和显示面板价格上涨对OEM厂商利润率带来压力。
- 对更长软体支援期限的更严格监管将增加成本结构。
- 价值/供应链分析
- 宏观经济影响分析(新冠疫情与通货膨胀率)
- 监理与技术展望
- 无线电频谱分配趋势
- ESIM和物联网相容作业系统的发展趋势
- 智慧型手机设备生命週期分析
- 相关人员生命週期图
- 相关人员关键痛点分析
- 技术蓝图
- 波特五力分析
- 供应商的议价能力
- 买方的议价能力
- 新进入者的威胁
- 替代品的威胁
- 竞争对手之间的竞争
第五章 市场规模与成长预测
- 按作业系统
- Android
- iOS
- 其他系统(KaiOS、HarmonyOS 等)
- 价格分布范围
- 入门级(200 美元以下)
- 中阶(200-499 美元)
- 高级版(500-799 美元)
- 超高端(超过 800 美元)
- 透过技术
- 5G
- 4G/LTE
- 3G 或更低
- 按外形规格
- 酒吧
- 折迭式/翻转
- 坚固耐用/工业
- 透过分销管道
- 营运商/承运商商店
- 品牌零售
- 多品牌零售
- 线上D2C
- 按地区
- 北美洲
- 美国
- 加拿大
- 拉丁美洲
- 墨西哥
- 巴西
- 阿根廷
- 其他拉丁美洲地区
- 欧洲
- 英国
- 德国
- 法国
- 义大利
- 西班牙
- 其他欧洲地区
- 中东和非洲
- 阿拉伯聯合大公国
- 沙乌地阿拉伯
- 南非
- 其他中东和非洲地区
- 亚太地区
- 中国
- 日本
- 韩国
- 印度
- 亚太其他地区
- 北美洲
第六章 竞争情势
- 市场集中度
- 策略趋势
- 市占率分析
- 公司简介
- Samsung Electronics Co. Ltd
- Apple Inc.
- BBK Electronics Corp. Ltd(Oppo, Vivo, Realme, OnePlus)
- Xiaomi Corp.
- Transsion Holdings
- Huawei Technologies Co. Ltd
- Motorola Mobility LLC(Lenovo Group Ltd)
- Google LLC(Pixel)
- Sony Corp.
- ZTE Corp.
- HMD Global Oy(Nokia)
- ASUSTeK Computer Inc.
- Honor Device Co. Ltd
- TCL Technology(Group)Co. Ltd(Alcatel)
- Sharp Corp.
- Panasonic Holding Corp.
- Nothing Technology Ltd
- Fairphone BV
- CAT Phones(Bullitt Group)
- Meizu Technology Co. Ltd
第七章 市场机会与未来展望
The Smartphones Market size is estimated at USD 585.63 billion in 2025, and is expected to reach USD 722.27 billion by 2030, at a CAGR of 3.51% during the forecast period (2025-2030).
Revenue is rising more quickly than unit shipments because users are selecting higher memory configurations, multi-camera arrays, and embedded artificial-intelligence (AI) engines that command premium prices. Devices priced above USD 800 now generate a widening share of industry profit, even though they account for a minority of global volume. Asia-Pacific holds 56.9 % smartphone market share in 2024, yet growth vectors vary: China is now a replacement-driven arena, while India, Indonesia, and Vietnam continue to welcome large cohorts of first-time buyers. A review of recent retail-pricing and customs-duty data implies that local-currency weakness across several emerging economies is accelerating domestic assembly, keeping entry-level pricing stable despite exchange-rate volatility.
Three structural forces will shape the smartphone industry through the remainder of the decade. First, nationwide 5G coverage is extending into sparsely populated districts that never enjoyed robust 4G, enabling late adopters to leapfrog one network generation. Second, generative-AI functions real-time translation, image creation, and meeting-note summarization, are shifting from cloud reliance to handset-level processing, sparking a new specification race around neural-processing units and memory bandwidth. Third, geopolitical restrictions on advanced semiconductors are prompting brands to diversify component sourcing and redesign supply chains. The combined effect is a sector that, while mature in headline penetration, still delivers profitable niches when vendors align feature roll-outs with flexible manufacturing footprints. Product-launch calendars for 2024-2025 illustrate this adjustment: many brands are spacing flagship introductions by roughly eighteen months rather than twelve, a cadence that lengthens accessory-sales tails and improves return on research expenditure.
Global Smartphones Market Trends and Insights
5G Network Commercialization: Accelerating Device Upgrade Cycles
Widespread 5G availability is shortening replacement intervals as consumers seek higher throughput and lower latency. Nearly 300 commercial networks now operate worldwide, and operators have begun switching off older 3G spectrum to widen mid-band 5G capacity. Device ASPs continue to fall as foundries offer cost-efficient 6 nm and 4 nm nodes, driving mainstream adoption even in price sensitive markets. Enhanced Mobile Broadband remains the anchor use case, yet FWA subscriptions are scaling quickly and support incremental device demand in underserved rural zones. The momentum raises overall radio access investment, guaranteeing a healthy pipeline of feature rich mid-range smartphones that appeal to upgrade-minded users.
Surging Demand for Mid-Premium Devices in India and SEA
Rising disposable income and aspirational consumption in India, Indonesia, and Vietnam are lifting the USD 200-499 sweet spot. Consumers seek high refresh-rate OLED panels, multi-lens imaging, and 5G at accessible price points, a window that Chinese OEMs actively target. The average selling price in India rose to USD 255 in 2023, underscoring migration away from entry devices. Localized online channels and targeted launch calendars align with festival seasons, creating periodic spikes in smartphone market sales. Consequently, mid-premium models now account for a larger share of e-commerce flash events, reinforcing the cycle of network upgrades and device capability demand.
Global Economic Slowdown Impacting Replacement Cycles
Inflationary pressure and currency volatility encourage consumers to extend handset life beyond three years. Vendors respond by promising seven years of security updates and offering battery replacement services, yet overall unit volumes remain subdued. The refurbished smartphone market benefits, providing operators with low-cost entry devices that still support 4G or 5G bands. High-interest rates also dampen financing uptake in developing regions, leading to cautious inventory management among retailers. Although ASPs rise, margin expansion is tempered by elevated component costs.
Other drivers and restraints analyzed in the detailed report include:
- Rise of Affordable 5G Chipsets from Fab-Lite Foundries
- Carrier-Led Device Financing Models Expanding in North America
- US-China Tech Sanctions Limiting High-End Component Supply
For complete list of drivers and restraints, kindly check the Table Of Contents.
Segment Analysis
Android retained 84.1% unit leadership in 2024, but iOS delivered the fastest 4.5% CAGR outlook, underpinning revenue momentum. The smartphone market size for iOS devices is expected to climb quickly as Apple widens distribution in mid-price bands and supports localized payments in emerging economies. Loyalty rates near 95% ensure stable upgrade flows, and sustained integration of Apple Silicon delivers power efficiency gains that lengthen device lifespans and boost residual values. Android counters with the Gemini AI engine running entirely on-device, enhancing privacy and context awareness. OEM skins leverage open-source flexibility to differentiate, though fragmentation still complicates timely security patches.
Apple's push into smaller-screen markets via a new SE line targets replacement cycles for users who postponed purchases during macro downturns. HarmonyOS Next adopts a microkernel architecture and positions Huawei as the only vertically integrated alternative ecosystem in China. KaiOS remains relevant for feature-rich 4G devices in cost-sensitive markets, powering voice-centric services that require minimal memory. Over the forecast horizon, interoperable AI frameworks could blur OS boundaries, but the established application libraries of iOS and Android will continue to anchor developer commitment, reinforcing their shared dominance in the smartphone market.
The entry tier below USD 200 accounted for 38.5% of shipments in 2024, providing first-time internet access to millions. Nonetheless, the ultra-premium tier generated 6.2% CAGR, underlining consumer willingness to amortize higher outlays over longer ownership spans. During launch weeks, premium flagships contribute up to 75% of revenue despite lower unit share, cushioning vendor profitability. The smartphone market size for the ultra-premium category is projected to rise steadily as foldables and AI-centric models command higher bills of materials yet enjoy robust demand.
Mid-range devices at USD 200-499 now include high-refresh displays, large sensors, and instant charging that were previously reserved for costlier products. Competitive dynamics intensify as Chinese OEMs orchestrate quarterly refreshes to preserve buzz. In markets such as Brazil, import duties inflate costs, nudging buyers toward refurbished mid-premium devices. Premium models priced at USD 500-799 serve as halo products, encouraging users into ecosystems that monetize after-sales services like cloud storage. This cascading structure balances volume and value, a prerequisite for healthy segment profitability in the smartphone market.
The Smartphone Market Report is Segmented by Operating System (Android, IOS, and More), Price Band (Entry-Level [Less Than USD 200], Mid-Range [USD 200 - 499], and More), Technology (5G, 4G/LTE, and 3G and Below), Form Factor (Bar, Foldable/Flip, and Rugged/Industrial), Distribution Channel (Operator/Carrier Stores, Brand-Owned Retail, and More) and Geography. The Market Forecasts are Provided in Terms of Value (USD).
Geography Analysis
Asia Pacific commanded 56.9% of global shipments in 2024, driven by China's and India's vast install bases and rapid 5G adoption. Domestic Chinese brands expanded their share via competitive pricing and camera innovation, while India's government-backed production-linked incentives attracted new factories that lowered import duties. Rural broadband initiatives encourage first-time smartphone market entrants, lifting overall penetration. Trade-in programs and EMI options further stimulate upgrades, particularly in tier-2 cities. Rising localization mandates push suppliers to source displays and batteries domestically, bolstering regional supply resilience. Regulatory moves to tighten data localization may increase compliance costs but also create vendor opportunities via sovereign cloud integrations.
North America ranked second by value but faces slower unit growth due to high saturation. Here, financing plans underpin premium shipments, and average selling prices are the world's highest. iOS enjoys a 57.9% share, reflecting cohesive ecosystem integration across hardware, services, and content. Carriers trial satellite messaging as a safety feature in remote areas, requiring modems capable of L-band links. Enterprise adoption of AI-enabled devices for field diagnostics keeps corporate replacement cycles closer to 24 months, partly offsetting consumer lengthening. Ongoing spectrum auctions for mid-band 5G ensure continued network enhancement, supporting demand for compatible flagships.
The Middle East & Africa smartphone market is forecast to expand at a 5.2% CAGR by 2030. Youthful demographics, gradual 5G rollout, and the rise of device financing through micro-lending apps underpin demand. Egypt is emerging as a regional assembly hub, offering customs advantages for intracontinental distribution. Flash-sale events aligned with pay-day cycles spur short bursts of volume, benefiting brands that coordinate logistics effectively. In Sub-Saharan Africa, solar-powered kiosks provide off-grid charging, increasing device utility in rural zones. Carrier partnerships with fintech platforms enable nano-credit, making entry-level smartphones affordable for first-time buyers, thereby enlarging overall smartphone market penetration.
- Samsung Electronics Co. Ltd
- Apple Inc.
- BBK Electronics Corp. Ltd (Oppo, Vivo, Realme, OnePlus)
- Xiaomi Corp.
- Transsion Holdings
- Huawei Technologies Co. Ltd
- Motorola Mobility LLC (Lenovo Group Ltd)
- Google LLC (Pixel)
- Sony Corp.
- ZTE Corp.
- HMD Global Oy (Nokia)
- ASUSTeK Computer Inc.
- Honor Device Co. Ltd
- TCL Technology (Group) Co. Ltd (Alcatel)
- Sharp Corp.
- Panasonic Holding Corp.
- Nothing Technology Ltd
- Fairphone BV
- CAT Phones (Bullitt Group)
- Meizu Technology Co. Ltd
Additional Benefits:
- The market estimate (ME) sheet in Excel format
- 3 months of analyst support
TABLE OF CONTENTS
1 INTRODUCTION
- 1.1 Study Assumptions and Market Definition
- 1.2 Scope of the Study
2 RESEARCH METHODOLOGY
3 EXECUTIVE SUMMARY
4 MARKET LANDSCAPE
- 4.1 Market Overview
- 4.2 Market Drivers
- 4.2.1 5G Network Commercialisation Accelerating Device Upgrade Cycles
- 4.2.2 Surging Demand for Mid-Premium Devices in India and SEA
- 4.2.3 Rise of Affordable 5G Chipsets from Fab-Lite Foundries (e.g., TSMC 6 nm)
- 4.2.4 Carrier-Led Device Financing Models Expanding in North America
- 4.2.5 E-commerce Flash-Sale Events Driving Volume in Africa
- 4.2.6 Enterprise Mobility Programmes Increasing Rugged Smartphone Adoption in Mining (Australia)
- 4.3 Market Restraints
- 4.3.1 Global Economic Slow-down Impacting Replacement Cycles
- 4.3.2 US-China Tech Sanctions Limiting High-end Component Supply
- 4.3.3 Escalating Memory and Display Panel Prices Squeezing OEM Margins
- 4.3.4 Regulatory Push for Longer Software Support Raising Cost Structures
- 4.4 Value / Supply-Chain Analysis
- 4.5 Macroeconomic Impact Analysis (COVID-19 and Inflation)
- 4.6 Regulatory and Technological Outlook
- 4.6.1 Radio-frequency Spectrum Allocation Trends
- 4.6.2 ESIM and IOT-Ready OS Developments
- 4.7 Smartphone Device Lifecycle Analysis
- 4.7.1 Stakeholder Lifecycle Mapping
- 4.7.2 Key Pain-Point Analysis by Stakeholder
- 4.8 Technology Roadmap
- 4.9 Porter's Five Forces Analysis
- 4.9.1 Bargaining Power of Suppliers
- 4.9.2 Bargaining Power of Buyers
- 4.9.3 Threat of New Entrants
- 4.9.4 Threat of Substitutes
- 4.9.5 Intensity of Competitive Rivalry
5 MARKET SIZE AND GROWTH FORECASTS (VALUE)
- 5.1 By Operating System
- 5.1.1 Android
- 5.1.2 iOS
- 5.1.3 Others (KaiOS, HarmonyOS, etc.)
- 5.2 By Price Band
- 5.2.1 Entry-level ( Less than USD 200)
- 5.2.2 Mid-range (USD 200 - 499)
- 5.2.3 Premium (USD 500 - 799)
- 5.2.4 Ultra-premium (Greater than or equal to USD 800)
- 5.3 By Technology
- 5.3.1 5G
- 5.3.2 4G/LTE
- 5.3.3 3G and Below
- 5.4 By Form Factor
- 5.4.1 Bar
- 5.4.2 Foldable/Flip
- 5.4.3 Rugged/Industrial
- 5.5 By Distribution Channel
- 5.5.1 Operator/Carrier Stores
- 5.5.2 Brand-Owned Retail
- 5.5.3 Multi-brand Physical Retail
- 5.5.4 Online Direct-to-Consumer
- 5.6 By Geography
- 5.6.1 North America
- 5.6.1.1 United States
- 5.6.1.2 Canada
- 5.6.2 Latin America
- 5.6.2.1 Mexico
- 5.6.2.2 Brazil
- 5.6.2.3 Argentina
- 5.6.2.4 Rest of Latin America
- 5.6.3 Europe
- 5.6.3.1 United Kingdom
- 5.6.3.2 Germany
- 5.6.3.3 France
- 5.6.3.4 Italy
- 5.6.3.5 Spain
- 5.6.3.6 Rest of Europe
- 5.6.4 Middle East and Africa
- 5.6.4.1 United Arab Emirates
- 5.6.4.2 Saudi Arabia
- 5.6.4.3 South Africa
- 5.6.4.4 Rest of Middle East and Africa
- 5.6.5 Asia-Pacific
- 5.6.5.1 China
- 5.6.5.2 Japan
- 5.6.5.3 South Korea
- 5.6.5.4 India
- 5.6.5.5 Rest of Asia-Pacific
- 5.6.1 North America
6 COMPETITIVE LANDSCAPE
- 6.1 Market Concentration
- 6.2 Strategic Moves
- 6.3 Market Share Analysis
- 6.4 Company Profiles {(includes Global level Overview, Market level overview, Core Segments, Financials as available, Strategic Information, Market Rank/Share, Products and Services, Recent Developments)}
- 6.4.1 Samsung Electronics Co. Ltd
- 6.4.2 Apple Inc.
- 6.4.3 BBK Electronics Corp. Ltd (Oppo, Vivo, Realme, OnePlus)
- 6.4.4 Xiaomi Corp.
- 6.4.5 Transsion Holdings
- 6.4.6 Huawei Technologies Co. Ltd
- 6.4.7 Motorola Mobility LLC (Lenovo Group Ltd)
- 6.4.8 Google LLC (Pixel)
- 6.4.9 Sony Corp.
- 6.4.10 ZTE Corp.
- 6.4.11 HMD Global Oy (Nokia)
- 6.4.12 ASUSTeK Computer Inc.
- 6.4.13 Honor Device Co. Ltd
- 6.4.14 TCL Technology (Group) Co. Ltd (Alcatel)
- 6.4.15 Sharp Corp.
- 6.4.16 Panasonic Holding Corp.
- 6.4.17 Nothing Technology Ltd
- 6.4.18 Fairphone BV
- 6.4.19 CAT Phones (Bullitt Group)
- 6.4.20 Meizu Technology Co. Ltd
7 Market Opportunities and Future Outlook
- 7.1 White-space and Unmet-need Assessment
 5G处理器市场-全球产业规模、份额、趋势、机会与预测:按类型、运作频率、处理节点类型、部署类型、垂直市场、地区和竞争格局划分,2021-2031年智慧型手机市场-全球产业规模、份额、趋势、竞争格局、机会及预测:依作业系统、显示技术、通路、地区及竞争格局划分,2021-2031年
 全球地磅配件及周边设备市场(按产品类型、技术水准、安装类型、容量、应用、分销管道和最终用户划分)预测(2026-2032年)
 智慧型手机市场规模、份额和成长分析(按作业系统、价格分布、分销管道和地区划分):产业预测(2026-2033 年)
 2032 年平板手机和超级手机市场预测:按作业系统、萤幕大小、RAM 容量、价格分布、分销管道、最终用户和地区进行的全球分析平板手机和超级手机市场(按最终用户、作业系统、萤幕大小、分销管道和价格分布范围)—2025-2032 年全球预测智慧型手机市场按组件、作业系统、储存容量、显示器类型、显示器尺寸、记忆体容量和分销管道划分——2025-2032年全球预测模组化智慧型手机租赁市场预测(至 2032 年):按类型、租赁模式、作业系统、定价、应用和地区进行的全球分析
 智慧型手机市场规模、份额和趋势分析报告:按作业系统、分销管道、价格分布范围、地区和细分市场预测,2025-2030 年
 全球智慧型手机维修市场