


 |
市场调查报告书
商品编码
1851153
云端计费:市场占有率分析、产业趋势、统计数据和成长预测(2025-2030 年)Cloud Billing - Market Share Analysis, Industry Trends & Statistics, Growth Forecasts (2025 - 2030) |
||||||
※ 本网页内容可能与最新版本有所差异。详细情况请与我们联繫。
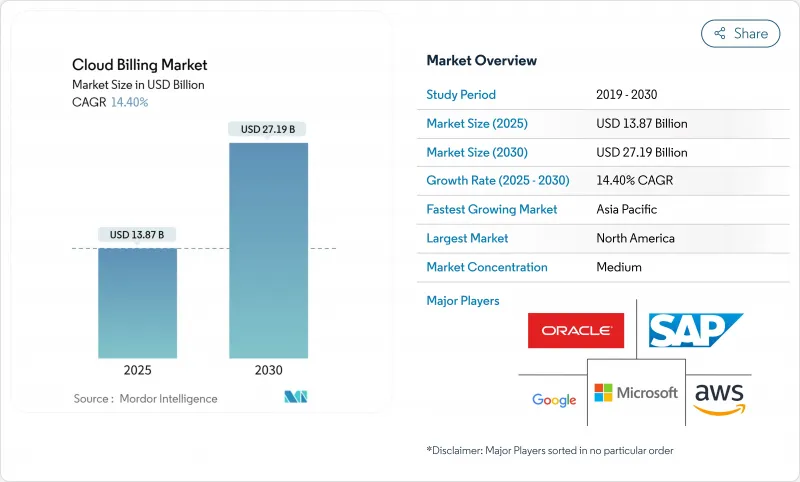
据估计,2025 年云端计费市场规模为 138.7 亿美元,预计到 2030 年将达到 271.9 亿美元,预测期(2025-2030 年)复合年增长率为 14.40%。
企业正将支出转向客製化的商业模式,以便将数百万笔计量记录无延迟地转化为发票。向多重云端环境的迁移以及由此产生的对精细化成本归因的需求,是推动这两位数成长的关键因素。超大规模企业加大基础设施投资、即时计量技术的进步,以及采购模式从基于容量向基于结果的显着转变,都提升了云端计费市场的重要性。同时,采用机器学习驱动的成本优化功能的专业供应商正在缩短部署週期,并减轻企业财务营运团队的技能负担。
全球云端计费市场趋势与洞察
加速多重云端采用
随着企业分散工作负载以平衡弹性、价格和资料居住义务,多重云端策略正日益普及。 Kubernetes 基于策略的资源控製表明,细粒度的自动扩展能够在保持管治的同时,有效控制不可预测的支出。收费平台现在可以即时协调不同的价格手册、货币和分类标准,并提供有助于实现单元级责任制的扣回争议帐款报告。随着超大规模云端服务商开放消费 API 以缩短资料撷取週期,以及企业为避免单一供应商风险而采用多种云端服务供应商,云端计费市场正在蓬勃发展。这将推动对能够规范多重云端远端检测并提供统一仪錶板的收费引擎的需求。
电子商务订阅模式的兴起
订阅式商务不再局限于SaaS。零售商正在整合实体商品、内容包、混合会员模式,这些都需要复杂的定价、分级附加元件和定期促销活动。平台必须协调行为触发定价,并针对特定国家/地区的支付方式、PSD2义务和GDPR要求对结帐流程进行在地化。循环型商务的成长透过拓展使用者群体,从软体发行商扩展到销售实体产品的商家,从而增强了云端发票市场。
从传统本地收费到新系统的复杂迁移
长期沿用的本地收费系统通常包含未记录的业务逻辑,导致资料映射和规则转换困难。对于受监管行业的公司而言,PCI-DSS、SOX 和 HIPAA 等迁移要求同时适用,需要双重营运环境,从而增加计划预算。这些资源负担阻碍了全面迁移,并减缓了云端计费市场的近期成长。
细分市场分析
混合环境正以 16.3% 的复合年增长率成长,它将本地资产与超大规模弹性相结合。预计从 2025 年到 2030 年,混合解决方案的云端计费市场规模也将以 16.3% 的复合年增长率成长。企业重视在不牺牲资料驻留或延迟敏感型处理的情况下迁移工作负载的能力,但却面临成本结构片段化的问题。收费供应商正在透过发布适配器来应对这项挑战,这些适配器能够协调私有云端云遥测资料与公共云端费率表。
公共云端凭藉其简易性和广泛的工俱生态系统,保持着 66.7% 的收入领先优势。然而,合规性、边缘用例和地缘政治因素都强化了混合支出管治的重要性。因此,云端计费市场正在转向统一的编配引擎,以计算混合有效费率并显示跨地域的差异报告。
随着企业将蓝图规划、整合和优化外包,服务收入正以17.1%的复合年增长率成长。服务提供者将咨询、实施和营运管理打包,以更快地实现投资回报。平台仍占60.8%的市场份额,但在客製化管理至关重要的监管领域,以服务主导的合作模式正逐渐站稳脚步。
云端计费市场受益于服务专家将领域细微差别转化为配置基准,从而降低部署风险。将平台许可与生命週期服务相结合的捆绑服务有助于建立更牢固的合同,并支持扩展到相邻的成本管治模组,例如碳排放追踪和合作伙伴支付。
云端计费市场按部署方式(公共云端、私有云端、混合云端)、组件(平台和服务)、收费模式(基于订阅、基于使用量、混合)、云端服务模式(SaaS收费、PaaS收费、IaaS收费)、组织规模(大型企业和中小企业)、最终用户垂直行业(零售和电子商务、银行、金融服务和电子商务地区进行市场进行细分、金融和地区进行金融服务和电子商务地区。
区域分析
北美地区预计到2024年将占全球营收的37.2%,并将继续受益于超大规模资料中心、创业投资资金和金融营运(FinOps)人才的集中。该地区重视遵守《萨班斯-奥克斯利法案》等框架以及州级隐私法的供应商。人工智慧工作负载的高利用率也推动了收费服务的普及,并增加了对即时计费的需求。
亚太地区以16.8%的复合年增长率成为成长最快的地区,这主要得益于公共部门数位化、行动优先的消费群以及政府的人工智慧运算倡议。印度的国家GPU计画展现了政府补贴如何推动云端运算能力的发展。日本的Carbon Link电池网路凸显了该地区对成本和环境关键绩效指标(KPI)兼顾的重视。提供本地化和语言支援的供应商抢占了先机。
欧洲正努力在GDPR领导地位与数位主权倡议兴起之间寻求平衡。企业需要本地资料中心和透明的资料处理链,因此,能够确保在地化的收费平台成为重中之重。鼓励碳排放优化调度的倡议正推动云端居住市场向环境扣回争议帐款报告模式发展。各国法规的碎片化延长了采购週期,但也增加了新进入者的门槛,并巩固了客户对那些能够驾驭合规细微之处的供应商的忠诚度。
其他福利:
- Excel格式的市场预测(ME)表
- 3个月的分析师支持
目录
第一章 引言
- 研究假设和市场定义
- 调查范围
第二章调查方法
第三章执行摘要
第四章 市场情势
- 市场概览
- 市场驱动因素
- 加速多重云端采用
- 电子商务订阅模式的兴起
- 对即时按使用量定价的需求日益增长
- 面向Web3Start-Ups的凭证式的云端消费模式
- 考虑碳排放的工作负载调度奖励
- 市场限制
- 从传统本地收费迁移的复杂性
- 数据主权和跨境合规成本
- FinOps 工具的兴起蚕食了原生收费利润
- 产业价值链分析
- 监管环境
- 技术视角(用于自动开票的生成式人工智慧)
- 产业吸引力:波特五力分析
- 供应商的议价能力
- 买方的议价能力
- 新进入者的威胁
- 替代品的威胁
- 竞争对手之间的竞争
- 宏观经济因素如何影响市场
第五章 市场规模及成长预测(金额)
- 透过部署
- 公有云
- 私有云端
- 混合云
- 按组件
- 平台
- 服务
- 按收费模式
- 基于订阅
- 使用群体
- 混合模式(订阅+使用量)
- 透过云端服务模式
- SaaS收费
- PaaS收费
- IaaS收费
- 按组织规模
- 大公司
- 中小企业
- 按最终用户行业划分
- 零售与电子商务
- BFSI
- 通讯业
- 医疗保健和生命科学
- 能源与公共产业
- 政府/公共部门
- 媒体与娱乐
- 其他终端用户产业
- 按地区
- 北美洲
- 美国
- 加拿大
- 墨西哥
- 南美洲
- 巴西
- 阿根廷
- 智利
- 其他南美洲
- 欧洲
- 德国
- 英国
- 法国
- 义大利
- 西班牙
- 俄罗斯
- 其他欧洲地区
- 亚太地区
- 中国
- 印度
- 日本
- 韩国
- 新加坡
- 马来西亚
- 澳洲
- 亚太其他地区
- 中东和非洲
- 中东
- 阿拉伯聯合大公国
- 沙乌地阿拉伯
- 土耳其
- 其他中东地区
- 非洲
- 南非
- 奈及利亚
- 埃及
- 其他非洲地区
- 北美洲
第六章 竞争情势
- 市场集中度
- 策略趋势
- 市占率分析
- 公司简介
- Amazon Web Services(AWS)Inc.
- Microsoft Corporation(Azure)
- Google Cloud Platform
- Oracle Corporation
- SAP SE
- Salesforce Inc.(Revenue Cloud)
- Zuora Inc.
- Aria Systems Inc.
- BillingPlatform LLC
- FinancialForce LLC
- IBM Corporation
- Comarch SA
- Tencent Cloud
- Huawei Cloud
- Alibaba Cloud
- CloudBlue(An Ingram Micro Co.)
- CloudHealth(Vmware)
- Chargebee Inc.
- Recurly Inc.
- Stripe Billing
- Paddle.com Market Ltd.
- ChargeOver LLC
- Vertex Inc.
- GoCardless Ltd.
- Orb Inc.
- SaaSOptics(An Ramped Co.)
- LogiSense Corp.
- Gotransverse LLC
- Rev.io Technologies
第七章 市场机会与未来趋势
- 閒置频段与未满足需求评估
The Cloud Billing Market size is estimated at USD 13.87 billion in 2025, and is expected to reach USD 27.19 billion by 2030, at a CAGR of 14.40% during the forecast period (2025-2030).
Enterprises are diverting spending toward usage-aligned commercial models that can translate millions of metering records into invoices without latency. Migration toward multi-cloud environments and the attendant demand for granular cost attribution are the pivotal forces behind this double-digit expansion. Heightened infrastructure outlays by hyperscalers, advances in real-time metering, and a pronounced shift from capacity-based to outcome-based purchasing have all amplified the relevance of the cloud billing market. In parallel, specialized vendors that embed machine-learning cost-optimization features are compressing implementation timelines and easing the skills burden on enterprise FinOps teams.
Global Cloud Billing Market Trends and Insights
Accelerating Multi-Cloud Adoption
Multi-cloud strategies are rising as organizations distribute workloads to balance resilience, pricing, and data-residency mandates. Policy-driven resource controls inside Kubernetes have demonstrated that finely tuned autoscaling curbs unpredictable spend while maintaining governance. Billing platforms now reconcile divergent price books, currencies, and taxonomies in real time and supply chargeback reports that promote unit-level accountability. The cloud billing market gains tailwinds as hyperscalers publish consumption APIs that shorten data-ingestion cycles and as enterprises escape single-vendor risk by embracing provider diversity. Demand, therefore, concentrates on billing engines that normalise multi-cloud telemetry and present unified dashboards.
Expansion of E-Commerce Subscription Models
Subscription commerce no longer applies exclusively to SaaS. Retailers integrate physical goods, content bundles, and hybrid memberships that require intricate proration, tiered add-ons, and cyclical promotions. Platforms must orchestrate price adjustments triggered by customer behaviour and localise checkout in line with country-specific payment methods, PSD2 mandates, and GDPR obligations. Growth in recurring commerce strengthens the cloud billing market by broadening the user base from software publishers to merchants that ship tangible products.
Migration Complexities from Legacy On-Premises Billing
Long-standing on-prem billing stacks often carry undocumented business logic, making data mapping and rule translation difficult. Enterprises in regulated verticals simultaneously uphold PCI-DSS, SOX, or HIPAA mandates during cut-over, obliging dual-run environments that inflate project budgets. The resource burden deters some organisations from full transition and tempers the near-term expansion pace of the cloud billing market.
Other drivers and restraints analyzed in the detailed report include:
- Rising Demand for Real-Time Usage-Based Pricing
- Token-Based Cloud Consumption Models in Web3 Startups
- Data-Sovereignty and Cross-Border Compliance Costs
For complete list of drivers and restraints, kindly check the Table Of Contents.
Segment Analysis
Hybrid environments are recording a 16.3% CAGR as organisations pair on-prem assets with hyperscale elasticity. The cloud billing market size for hybrid solutions is projected to expand at a 16.3% CAGR between 2025-2030. Enterprises value the capacity to shift workloads without forfeiting data residency or latency-sensitive processing, yet they encounter fractured cost structures. Billing vendors respond by releasing adapters that harmonise private-cloud telemetry with public-cloud rate cards.
Public deployment retains a 66.7% revenue lead thanks to simplicity and broad tooling ecosystems. Nevertheless, compliance triggers, edge use cases, and geopolitics strengthen the case for hybrid spend governance. The cloud billing market, therefore, pivots toward unified orchestration engines that calculate blended effective rates and surface variance reports across locations.
Services revenue is climbing at 17.1% CAGR as enterprises outsource roadmap planning, integration, and optimisation. Providers bundle advisory, implementation, and managed operations that target rapid payback. Platforms continue to dominate with a 60.8% share, yet service-led engagement secures footholds in regulated domains where bespoke controls are pivotal.
The cloud billing market benefits because service specialists translate domain nuances into configuration baselines that shrink deployment risk. Bundled offerings that pair platform licences with lifecycle services foster stickier contracts and unlock expansion into adjacent cost-governance modules such as carbon tracing and partner settlement.
Cloud Billing Market is Segmented by Deployment (Public Cloud, Private Cloud, and Hybrid Cloud), Component (Platform and Services), Billing Model (Subscription-Based, Usage-Based, and Hybrid), Cloud Service Model (SaaS Billing, Paas Billing, and IaaS Billing), Organization Size (Large Enterprises and Small and Medium Enterprises), End-User Industry (Retail and E-Commerce, BFSI, and More), and Geography.
Geography Analysis
North America generated 37.2% of 2024 revenue and continues to benefit from a concentration of hyperscalers, venture funding, and FinOps talent. The region rewards vendors that comply with frameworks such as SOX and state-level privacy statutes. High usage of AI workloads also catalyses the adoption of token-metered services, reinforcing demand for real-time rating.
Asia-Pacific posts the fastest 16.8% CAGR due to public-sector digitisation, mobile-first consumer bases, and sovereign AI compute initiatives. India's national GPU programme exemplifies how government grants catalyse cloud capacity that must be monetised through scalable billing. Japan's carbon-linked battery network highlights regional appetite for merging cost with environmental KPIs. Providers that bundle localisation and language support gain early footholds.
Europe balances GDPR leadership with emerging digital sovereignty plans. Enterprises require local data centres and transparent data-processing chains, so billing platforms that guarantee regional residency gain preference. Initiatives encouraging carbon-aware scheduling drive the cloud billing market toward environmental chargeback reports. Fragmented national rules prolong procurement cycles, yet they also amplify barriers for newcomers and solidify loyalty to vendors adept at navigating compliance nuances.
- Amazon Web Services (AWS) Inc.
- Microsoft Corporation (Azure)
- Google Cloud Platform
- Oracle Corporation
- SAP SE
- Salesforce Inc. (Revenue Cloud)
- Zuora Inc.
- Aria Systems Inc.
- BillingPlatform LLC
- FinancialForce LLC
- IBM Corporation
- Comarch SA
- Tencent Cloud
- Huawei Cloud
- Alibaba Cloud
- CloudBlue (An Ingram Micro Co.)
- CloudHealth (Vmware)
- Chargebee Inc.
- Recurly Inc.
- Stripe Billing
- Paddle.com Market Ltd.
- ChargeOver LLC
- Vertex Inc.
- GoCardless Ltd.
- Orb Inc.
- SaaSOptics (An Ramped Co.)
- LogiSense Corp.
- Gotransverse LLC
- Rev.io Technologies
Additional Benefits:
- The market estimate (ME) sheet in Excel format
- 3 months of analyst support
TABLE OF CONTENTS
1 INTRODUCTION
- 1.1 Study Assumptions and Market Definition
- 1.2 Scope of the Study
2 RESEARCH METHODOLOGY
3 EXECUTIVE SUMMARY
4 MARKET LANDSCAPE
- 4.1 Market Overview
- 4.2 Market Drivers
- 4.2.1 Accelerating multi-cloud adoption
- 4.2.2 Expansion of e-commerce subscription models
- 4.2.3 Rising demand for real-time usage-based pricing
- 4.2.4 Token-based cloud consumption models in Web3 startups
- 4.2.5 Carbon-aware workload scheduling incentives
- 4.3 Market Restraints
- 4.3.1 Migration complexities from legacy on-prem billing
- 4.3.2 Data-sovereignty and cross-border compliance costs
- 4.3.3 Rising FinOps tooling cannibalising native billing margins
- 4.4 Industry Value Chain Analysis
- 4.5 Regulatory Landscape
- 4.6 Technological Outlook (Generative AI for automated invoicing)
- 4.7 Industry Attractiveness - Porter's Five Forces Analysis
- 4.7.1 Bargaining Power of Suppliers
- 4.7.2 Bargaining Power of Buyers
- 4.7.3 Threat of New Entrants
- 4.7.4 Threat of Substitutes
- 4.7.5 Intensity of Competitive Rivalry
- 4.8 Impact of Macroeconomic Factors on the Market
5 MARKET SIZE AND GROWTH FORECASTS (VALUES)
- 5.1 By Deployment
- 5.1.1 Public Cloud
- 5.1.2 Private Cloud
- 5.1.3 Hybrid Cloud
- 5.2 By Component
- 5.2.1 Platform
- 5.2.2 Services
- 5.3 By Billing Model
- 5.3.1 Subscription-based
- 5.3.2 Usage-based
- 5.3.3 Hybrid (Subscription + Usage)
- 5.4 By Cloud Service Model
- 5.4.1 SaaS Billing
- 5.4.2 PaaS Billing
- 5.4.3 IaaS Billing
- 5.5 By Organization Size
- 5.5.1 Large Enterprises
- 5.5.2 Small and Medium Enterprises (SMEs)
- 5.6 By End-user Industry
- 5.6.1 Retail and E-commerce
- 5.6.2 BFSI
- 5.6.3 Telecommunications
- 5.6.4 Healthcare and Life Sciences
- 5.6.5 Energy and Utilities
- 5.6.6 Government and Public Sector
- 5.6.7 Media and Entertainment
- 5.6.8 Other End-user Industries
- 5.7 By Geography
- 5.7.1 North America
- 5.7.1.1 United States
- 5.7.1.2 Canada
- 5.7.1.3 Mexico
- 5.7.2 South America
- 5.7.2.1 Brazil
- 5.7.2.2 Argentina
- 5.7.2.3 Chile
- 5.7.2.4 Rest of South America
- 5.7.3 Europe
- 5.7.3.1 Germany
- 5.7.3.2 United Kingdom
- 5.7.3.3 France
- 5.7.3.4 Italy
- 5.7.3.5 Spain
- 5.7.3.6 Russia
- 5.7.3.7 Rest of Europe
- 5.7.4 Asia-Pacific
- 5.7.4.1 China
- 5.7.4.2 India
- 5.7.4.3 Japan
- 5.7.4.4 South Korea
- 5.7.4.5 Singapore
- 5.7.4.6 Malaysia
- 5.7.4.7 Australia
- 5.7.4.8 Rest of Asia-Pacific
- 5.7.5 Middle East and Africa
- 5.7.5.1 Middle East
- 5.7.5.1.1 United Arab Emirates
- 5.7.5.1.2 Saudi Arabia
- 5.7.5.1.3 Turkey
- 5.7.5.1.4 Rest of Middle East
- 5.7.5.2 Africa
- 5.7.5.2.1 South Africa
- 5.7.5.2.2 Nigeria
- 5.7.5.2.3 Egypt
- 5.7.5.2.4 Rest of Africa
- 5.7.1 North America
6 COMPETITIVE LANDSCAPE
- 6.1 Market Concentration
- 6.2 Strategic Moves
- 6.3 Market Share Analysis
- 6.4 Company Profiles (includes Global level Overview, Market level overview, Core Segments, Financials as available, Strategic Information, Market Rank/Share for key companies, Products and Services, and Recent Developments)
- 6.4.1 Amazon Web Services (AWS) Inc.
- 6.4.2 Microsoft Corporation (Azure)
- 6.4.3 Google Cloud Platform
- 6.4.4 Oracle Corporation
- 6.4.5 SAP SE
- 6.4.6 Salesforce Inc. (Revenue Cloud)
- 6.4.7 Zuora Inc.
- 6.4.8 Aria Systems Inc.
- 6.4.9 BillingPlatform LLC
- 6.4.10 FinancialForce LLC
- 6.4.11 IBM Corporation
- 6.4.12 Comarch SA
- 6.4.13 Tencent Cloud
- 6.4.14 Huawei Cloud
- 6.4.15 Alibaba Cloud
- 6.4.16 CloudBlue (An Ingram Micro Co.)
- 6.4.17 CloudHealth (Vmware)
- 6.4.18 Chargebee Inc.
- 6.4.19 Recurly Inc.
- 6.4.20 Stripe Billing
- 6.4.21 Paddle.com Market Ltd.
- 6.4.22 ChargeOver LLC
- 6.4.23 Vertex Inc.
- 6.4.24 GoCardless Ltd.
- 6.4.25 Orb Inc.
- 6.4.26 SaaSOptics (An Ramped Co.)
- 6.4.27 LogiSense Corp.
- 6.4.28 Gotransverse LLC
- 6.4.29 Rev.io Technologies
7 MARKET OPPORTUNITIES AND FUTURE TRENDS
- 7.1 White-Space and Unmet-Need Assessment
 云端计费市场:2025-2032年全球预测(依服务类型、计费方式、产业垂直领域及组织规模划分)通讯收费和收益管理市场(按部署模式、收费类型、服务类型、最终用户、组件和垂直行业)—全球预测 2025-2032
 2025年全球云端发票市场报告按使用收费软体市场(收费模式、功能、企业规模、部署模式、使用者角色和最终用户)-2025 年至 2030 年全球预测直接营运商计费市场按组件、类型、支付类型、平台类型、身份验证类型、应用程式和最终用户划分 - 2025-2030 年全球预测
 云端发票市场规模、份额、成长分析(按部署模式、发票类型、付款方式和地区)- 2025 年至 2032 年产业预测
 云端计费市场 - 全球产业规模、份额、趋势、机会和预测(按部署、按计费类型、按最终用户、按地区和竞争情况,2020-2030 年预测)
 2025-2029年全球直接营运商计费市场
 全球直接营运商计费市场:按类型、平台、最终用户、区域覆盖范围和预测电信计费和收益管理市场规模(按组件、营运商、部署类型、区域范围和预测):2020 年至 2026 年