


 |
市场调查报告书
商品编码
1939031
随选视讯(VOD):市场占有率分析、产业趋势与统计数据、成长预测(2026-2031)Video-on-Demand - Market Share Analysis, Industry Trends & Statistics, Growth Forecasts (2026 - 2031) |
||||||
※ 本网页内容可能与最新版本有所差异。详细情况请与我们联繫。
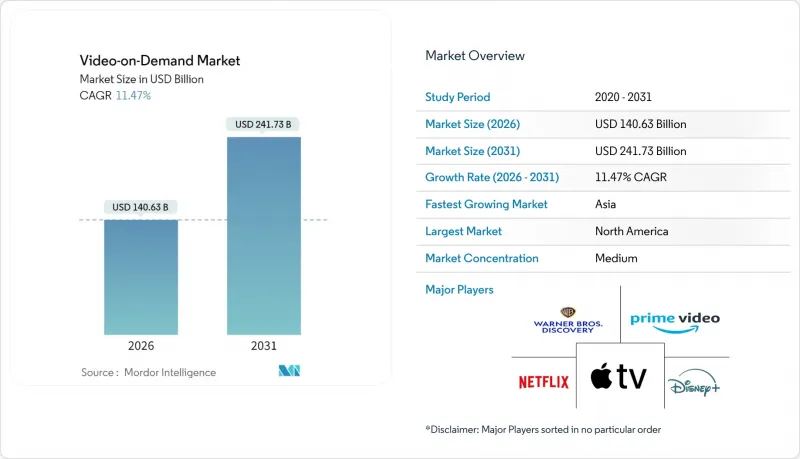
2025 年视讯点播 (VOD) 市值为 1261.6 亿美元,预计到 2031 年将达到 2417.3 亿美元,而 2026 年为 1406.3 亿美元。
预计在预测期(2026-2031 年)内,复合年增长率将达到 11.47%。
这种加速成长反映了观众观看习惯从固定时段电视节目向点播串流媒体的稳定转变,而宽频的快速普及、设备多样化和丰富的节目库是推动这一转变的主要动力。北美和西欧的超高速光纤和5G网路普及促进了4K影片播放,而亚洲地区本地语言节目的製作预算则持续吸引当地观众。广告支援型套餐的普及为价格敏感型家庭提供了新的选择,而拉丁美洲的捆绑销售模式则降低了用户获取成本。市场领导透过内容独家、跨服务捆绑和高性价比的配送网路来规避用户流失风险,因此竞争依然激烈。
全球视讯点播市场趋势与洞察
亚太新兴市场AVOD平台的快速普及
由于平台采取了以低费用换取高覆盖率的策略,亚太地区的观众越来越倾向接受广告支援型服务。预计到2023年,这项策略将推动全部区域影片收入达到244亿美元(avia.org)。广告商认为,当年该地区拥有14亿独立观众,他们总合观看了约140亿小时的亚洲内容(avia.org)。预计到2030年,在AVOD库存扩张的推动下,该地区的影片收入将额外增加210亿美元(advanced-television.com)。多语言广告加载个人化和基于受众的购买策略提高了CPM(每千次展示成本),使平台能够弥补订阅收入的不足。这些协同效应正在将AVOD从新兴经济体的补充收入来源提升为核心收入来源。
在北美和西欧扩大超高速宽频部署
光纤到户普及率的不断提高、5G固定无线存取的普及以及动态CDN路由技术,共同推动了超高清视讯的无缝传输。西欧的OTT剧集和电影收入预计将从2023年的310亿美元飙升至2029年的480亿美元(digitaltvnews.net)。业者正在试行多播辅助单播传输技术,该技术可在直播高峰期将频宽使用量降低高达90%(streamtvinsider.com)。观众将受益于更快的启动速度和更少的缓衝,无论是在电视、智慧型手机还是车载萤幕上。这些品质的提升转化为更长的观看时长,从而直接有助于稳定视讯点播(VOD)市场的平均每用户收入(ARPU)。
内容授权成本上涨对平台利润率带来压力。
多年来,热门内容的竞标战导致最低保障金额飙升,对服务盈利造成压力。一些中型服务商正在整合其内容库,将自身定位为独家热门内容的买家或透过出售其庞大的历史片库来获利的卖家。儘管欧盟委员会指出,生成式人工智慧工具未来可能降低製作成本,但短期内支出与收入之间的不平衡依然存在(ec.europa.eu)。因此,营运商被迫在提高价格或引入广告支援的子套餐之间做出选择,从而强化了视讯点播市场普遍存在的双层获利模式。
细分市场分析
儘管到2025年,SVOD将占总收入的83.92%,体现了其先发优势,但AVOD预计11.01%的复合年增长率表明,消费者对低成本娱乐的需求正在加速增长。随着全球广告支出转向联网萤幕,由AVOD驱动的视讯点播(VOD)市场规模预计将进一步扩大。结合少量广告和低价策略的混合套餐正在兴起,既能确保可预测的现金流,又能降低定期订阅疲劳。小众电视点播(TVOD)分发对于热门大片的首映仍然至关重要,而按次付费的体育赛事则保持着较高的价格稳定性。
新兴经济体的消费者越来越倾向将AVOD视为首选而非替代方案,这促使平台进行广告创新在地化并减少广告投放量。同时,广告商获得了类似社群媒体的精准定向投放能力。对于现有的SVOD业者而言,逐步引入广告分级制度将有助于缓解ARPU(每用户收入)的下滑。这些变化将优化获利模式,同时不会降低用户体验在整个视讯点播(VOD)市场中的重要性。
预计到2025年,OTT串流媒体将占总营收的71.35%,并在2031年之前以11.22%的复合年增长率成长。与託管式IPTV不同,OTT可透过开放的网际网路和自适应位元率通讯协定在全球范围内实现可扩展性。 MAUD试验可将尖峰时段频宽需求降低高达90%,进而进一步提高实况活动的成本效益(streamtvinsider.com)。因此,即使在付费电视点播服务仍然存在的地区,OTT频道的视讯点播(VOD)市场规模也预计将超过传统有线电视和卫星电视。
在配套服务覆盖的地区,IPTV已获得广泛应用;而HbbTV在欧洲的普及以及巴西即将推出的TV 3.0则凸显了混合模式,该模式结合了广播的覆盖范围和宽频的柔软性(advanced-television.com)。展望未来,视讯点播(VOD)产业将整合边缘运算节点,以显着降低身临其境型体验(例如体感视讯)的延迟。
区域分析
北美仍将是最大的贡献地区,预计到2025年将占据41.10%的收入份额,这得益于其宽频的早期普及和丰富的原创内容供应链。 2025年推出的行业捆绑套餐将多项关键服务整合到折扣套餐中,有效缓解了用户的订阅疲劳。联邦政府的基础设施津贴将继续推动光纤网路向遍远地区的扩展,进一步巩固主导地位。
亚太地区是成长最快的地区,预计到2031年将维持12.05%的复合年增长率。涵盖5G、云端运算和本地语言製作等国家级措施将推动该地区2023年的收入达到244亿美元(avia.org)。印度和中国在用户成长方面领先,而日本和韩国则输出了广受国际欢迎的文化热门内容。此外,强劲的数位广告支出也支撑着成长,证实了广告支援型影片点播(AVOD)在新兴经济体的永续性。
拉丁美洲正在加速扩张,预计到2029年,SVOD帐户数量将达到1.65亿(advanced-television.com)。光是巴西一国,用户就可能超过5900万。与通讯业者的合作促进了支付,而频宽需求则透过正在进行的光纤项目得到满足,其中包括Entel公司在2024年投资的6.18亿美元(entel.cl)。儘管全球巨头占据主导地位,但区域平台仍然拥有8%的市场份额,这反映了该地区在视讯点播市场中对故事叙述的独特需求。
其他福利:
- Excel格式的市场预测(ME)表
- 3个月的分析师支持
目录
第一章 引言
- 研究假设和市场定义
- 调查范围
第二章调查方法
第三章执行摘要
第四章 市场情势
- 市场概览
- 市场驱动因素
- 亚太新兴市场AVOD平台的快速普及
- 在北美和西欧扩大超高速宽频部署
- 全球串流媒体公司正在加大对原创本地语言内容的投资
- 将视讯点播服务与电信服务和付费电视订阅捆绑在一起,将推动南美洲的普及。
- 云端原生CDN和边缘运算的日益普及降低了视讯点播的延迟。
- 市场限制
- 内容授权成本上涨对平台利润率带来压力。
- 欧盟加强对独家内容交易的反垄断审查
- 在成熟的SVOD市场中,订阅疲劳导致用户解约率上升。
- 监理展望
- 波特五力分析
- 买方的议价能力
- 供应商的议价能力
- 新进入者的威胁
- 替代品的威胁
- 竞争对手之间的竞争
第五章 市场规模与成长预测
- 按经营模式
- 订阅视讯点播 (SVOD)
- 广告支援的视讯点播(AVOD)
- 交易型/按次付费(TVOD)
- 混合动力及其他车型
- 透过技术提供
- Over-The-Top媒体(OTT)
- 网际网路通讯协定电视(IPTV)随选视讯(VOD)
- 付费电视/视讯点播(VOD)
- 混合广播宽频电视(HbbTV)
- 依设备类型
- 智慧型手机和平板电脑
- 智慧电视
- 个人电脑和笔记型电脑
- 连网串流媒体设备
- 其他的
- 按内容类型
- 娱乐与戏剧
- 运动的
- 儿童和家庭
- 教育/纪录片
- 其他(新闻、生活风格)
- 最终用户
- 住宅/个人
- 商业和企业(饭店、航空公司、医院)
- 教育机构
- 公共部门和政府机构
- 按地区
- 北美洲
- 我们
- 加拿大
- 墨西哥
- 南美洲
- 巴西
- 阿根廷
- 其他南美洲
- 欧洲
- 德国
- 英国
- 法国
- 义大利
- 西班牙
- 其他欧洲地区
- 亚太地区
- 中国
- 日本
- 韩国
- 印度
- 澳洲
- 纽西兰
- 亚太其他地区
- 中东和非洲
- 阿拉伯聯合大公国
- 沙乌地阿拉伯
- 南非
- 其他中东和非洲地区
- 北美洲
第六章 竞争情势
- 策略发展
- 供应商定位分析
- 公司简介
- Amazon.com Inc.(Prime Video)
- Netflix Inc.
- The Walt Disney Company(Disney+and Hulu)
- Warner Bros. Discovery Inc.(Max)
- Apple Inc.(Apple TV+)
- Alphabet Inc.(YouTube Premium and YouTube TV)
- Comcast Corporation(Peacock and Xfinity On-Demand)
- Paramount Global(Paramount+)
- Roku Inc.
- Tencent Holdings Ltd.(Tencent Video)
- Alibaba Group(Youku Tudou)
- Baidu Inc.(iQIYI)
- Zee Entertainment Enterprises Ltd.(ZEE5)
- Reliance Industries Ltd.(JioCinema)
- Novi Digital Entertainment Pvt. Ltd.(Disney+Hotstar)
- KT Corporation(Olleh TV)
- Rakuten Group(Rakuten Viki)
- Sky Group Limited(NOW)
- Telstra Corporation(Telstra TV Box Office)
- PCCW Media(Viu)
- Globoplay(Grupo Globo)
- Shahid(MBC Group)
- Showmax(MultiChoice)
- Canal+Group(myCanal)
- Vubiquity Inc.
第七章 市场机会与未来展望
The Video-on-Demand market was valued at USD 126.16 billion in 2025 and estimated to grow from USD 140.63 billion in 2026 to reach USD 241.73 billion by 2031, at a CAGR of 11.47% during the forecast period (2026-2031).
This acceleration mirrors the steady shift from scheduled television to on-demand streaming, supported by rapid broadband rollouts, device proliferation, and richer content libraries. Ultra-high-speed fiber and 5G coverage in North America and Western Europe enable smooth 4K playback, while local-language production budgets in Asia keep regional viewers engaged. The surge of ad-supported tiers offers price-sensitive households alternative entry points, and telecom bundles are lowering acquisition costs in Latin America. The competitive intensity remains high as market leaders hedge churn risk through content exclusivity, cross-service bundles, and cost-efficient delivery networks.
Global Video-on-Demand Market Trends and Insights
Rapid Adoption of AVOD Platforms in Emerging Asia-Pacific Markets
Asia-Pacific audiences are embracing ad-supported offerings as platforms trade lower fees for higher reach, a tactic that garnered a USD 24.4 billion regional video revenue pool in 2023 avia.org. Advertisers value the 1.4 billion unique viewers who collectively streamed almost 14 billion hours of Asian content in the same year avia.org. Forecasts suggest the region will unlock another USD 21 billion in video earnings by 2030 as AVOD inventory scales advanced-television.com . Multilingual ad load personalization and audience-based buying is raising CPMs, allowing platforms to offset thinner subscription margins. Together, these dynamics elevate AVOD from a supplemental to a core monetization pillar across emerging economies.
Expansion of Ultra-High-Speed Broadband Rollout in North America & Western Europe
Fiber-to-the-home penetration, 5G fixed-wireless access, and dynamic CDN routing now underpin seamless UHD delivery. Western European OTT episode and movie revenue will jump to USD 48 billion by 2029 from USD 31 billion in 2023 digitaltvnews.net . Operators are piloting multicast-assisted unicast delivery that can trim bandwidth use by as much as 90% during live traffic peaks streamtvinsider.com . Viewers benefit through faster start times and reduced buffering across TVs, phones, and in-vehicle screens. Such quality upgrades raise engagement minutes, directly supporting ARPU stability within the Video-on-Demand market.
Escalating Content Licensing Costs Squeezing Platform Margins
Multiyear bidding wars over hit franchises inflate minimum guarantees, squeezing service profitability. Some mid-tier providers have culled libraries, positioning themselves either as buyers of exclusive hits or as sellers monetizing deep back catalogs. The European Commission notes that generative AI tools could eventually ease production costs but the near-term imbalance between spending and returns persists ec.europa.eu. Consequently, operators either push prices up or introduce lower-tier plans with ads, reinforcing the two-track monetization model visible throughout the Video-on-Demand market.
Other drivers and restraints analyzed in the detailed report include:
- Increased Content Investments in Local-Language Originals by Global Streamers
- Bundling of VoD with Telecom & Pay-TV Subscriptions Driving Uptake in South America
- Rising Churn Rates Due to Subscription Fatigue in Matured SVOD Markets
For complete list of drivers and restraints, kindly check the Table Of Contents.
Segment Analysis
SVOD controlled 83.92% revenue in 2025, reflecting its early-mover status, but AVOD's 11.01% forecast CAGR signals accelerating demand for low-cost entertainment. The Video-on-Demand market size attributable to AVOD will widen as global advertising outlays migrate to connected screens. Hybrid packages that merge limited ads with modest fees are emerging to curb subscription fatigue while preserving predictable cash receipts. Niche TVOD windows retain relevance for blockbuster premieres, with sports pay-per-view sustaining premium pricing elasticity.
Consumers in emerging economies increasingly treat AVOD as a first-choice service rather than a fallback, prompting platforms to localize ad creative and shorten ad loads. Advertisers, meanwhile, gain addressable targeting that rivals social media precision. For SVOD incumbents, gradual entry into advertising mitigates ARPU erosion. Together, these shifts refine monetization structures without altering the centrality of customer experience within the broader Video-on-Demand market.
OTT streaming garnered 71.35% of 2025 revenues and is forecast at 11.22% CAGR through 2031. Unlike managed IPTV, OTT scales globally via open internet and adaptive bitrate protocols. MAUD trials that cut peak bandwidth needs by up to 90% further bolster cost efficiency for live events streamtvinsider.com. Thus, the Video-on-Demand market size for OTT channels will outpace legacy cable and satellite, even where Pay-TV VoD persists.
IPTV remains entrenched in regions with bundled DSL and fiber offerings, while HbbTV adoption in Europe and Brazil's upcoming TV 3.0 highlight hybrid models that blend broadcast reach with broadband flexibility advanced-television.com. Looking ahead, the Video-on-Demand industry will integrate edge compute nodes to slash latency for immersive experiences such as volumetric video.
The Video-On-Demand (VoD) Market Report is Segmented by Business Model (Subscription VoD, Advertising VoD, and More), Delivery Technology (OTT Streaming, IPTV VoD, and More), Device Type (Smartphones and Tablets, Smart TVs, and More), Content Genre (Entertainment and Drama, Sports, and More), End-User (Residential, Commercial and Enterprise, and More), and Geography. The Market Forecasts are Provided in Terms of Value (USD).
Geography Analysis
North America remained the largest contributor at 41.10% revenue share in 2025, benefiting from early broadband ubiquity and deep original-content pipelines. Industry bundles launched in 2025 combine multiple flagship services into discounted packages, an antidote to subscription fatigue. Federal infrastructure grants continue to extend rural fiber, reinforcing the Video-on-Demand market's leadership position.
Asia-Pacific is the fastest-growing territory, tracking a 12.05% CAGR to 2031. National initiatives spanning 5G, cloud, and local-language production have spurred USD 24.4 billion in 2023 regional revenue avia.org. India and China top subscriber additions, while Japan and South Korea export cultural hits that travel well internationally. Growth is further supported by robust digital advertising spend, underpinning AVOD viability across emerging economies.
Latin America shows accelerating scale, projected to host 165 million SVOD accounts by 2029 advanced-television.com. Brazil alone may surpass 59 million subs. Telco partnerships ease payments and satisfy bandwidth requirements via ongoing fiber projects such as Entel's USD 618 million 2024 investment entel.cl. Although global majors dominate, local platforms still secure 8% market share, reflecting regional storytelling demand within the Video-on-Demand market.
- Amazon.com Inc. (Prime Video)
- Netflix Inc.
- The Walt Disney Company (Disney+ and Hulu)
- Warner Bros. Discovery Inc. (Max)
- Apple Inc. (Apple TV+)
- Alphabet Inc. (YouTube Premium and YouTube TV)
- Comcast Corporation (Peacock and Xfinity On-Demand)
- Paramount Global (Paramount+)
- Roku Inc.
- Tencent Holdings Ltd. (Tencent Video)
- Alibaba Group (Youku Tudou)
- Baidu Inc. (iQIYI)
- Zee Entertainment Enterprises Ltd. (ZEE5)
- Reliance Industries Ltd. (JioCinema)
- Novi Digital Entertainment Pvt. Ltd. (Disney+ Hotstar)
- KT Corporation (Olleh TV)
- Rakuten Group (Rakuten Viki)
- Sky Group Limited (NOW)
- Telstra Corporation (Telstra TV Box Office)
- PCCW Media (Viu)
- Globoplay (Grupo Globo)
- Shahid (MBC Group)
- Showmax (MultiChoice)
- Canal+ Group (myCanal)
- Vubiquity Inc.
Additional Benefits:
- The market estimate (ME) sheet in Excel format
- 3 months of analyst support
TABLE OF CONTENTS
1 INTRODUCTION
- 1.1 Study Assumptions and Market Definition
- 1.2 Scope of the Study
2 RESEARCH METHODOLOGY
3 EXECUTIVE SUMMARY
4 MARKET LANDSCAPE
- 4.1 Market Overview
- 4.2 Market Drivers
- 4.2.1 Rapid adoption of AVOD platforms in emerging Asia-Pacific markets
- 4.2.2 Expansion of ultra-high-speed broadband rollout in North America and Western Europe
- 4.2.3 Increased content investments in local-language originals by global streamers
- 4.2.4 Bundling of VoD with telecom and pay-TV subscriptions driving uptake in South America
- 4.2.5 Growing adoption of cloud-native CDN and edge compute lowering VoD latency
- 4.3 Market Restraints
- 4.3.1 Escalating content licensing costs squeezing platform margins
- 4.3.2 Intensifying antitrust scrutiny over exclusive content deals in EU
- 4.3.3 Rising churn rates due to subscription fatigue in matured SVOD markets
- 4.4 Regulatory Outlook
- 4.5 Porter's Five Forces Analysis
- 4.5.1 Bargaining Power of Buyers
- 4.5.2 Bargaining Power of Suppliers
- 4.5.3 Threat of New Entrants
- 4.5.4 Threat of Substitutes
- 4.5.5 Intensity of Competitive Rivalry
5 MARKET SIZE AND GROWTH FORECASTS (VALUE)
- 5.1 By Business Model
- 5.1.1 Subscription Video-on-Demand (SVOD)
- 5.1.2 Advertising Video-on-Demand (AVOD)
- 5.1.3 Transactional/Pay-per-view (TVOD)
- 5.1.4 Hybrid and Other Models
- 5.2 By Delivery Technology
- 5.2.1 Over-the-Top (OTT) Streaming
- 5.2.2 Internet Protocol Television (IPTV) VoD
- 5.2.3 Pay-TV VoD
- 5.2.4 Hybrid Broadcast Broadband TV (HbbTV)
- 5.3 By Device Type
- 5.3.1 Smartphones and Tablets
- 5.3.2 Smart TVs
- 5.3.3 PCs and Laptops
- 5.3.4 Connected Streaming Devices
- 5.3.5 Others
- 5.4 By Content Genre
- 5.4.1 Entertainment and Drama
- 5.4.2 Sports
- 5.4.3 Kids and Family
- 5.4.4 Educational and Documentary
- 5.4.5 Others (News, Lifestyle)
- 5.5 By End-user
- 5.5.1 Residential / Individual
- 5.5.2 Commercial and Enterprise (Hotels, Airlines, Hospitals)
- 5.5.3 Educational Institutions
- 5.5.4 Public Sector and Government
- 5.6 By Geography
- 5.6.1 North America
- 5.6.1.1 United States
- 5.6.1.2 Canada
- 5.6.1.3 Mexico
- 5.6.2 South America
- 5.6.2.1 Brazil
- 5.6.2.2 Argentina
- 5.6.2.3 Rest of South America
- 5.6.3 Europe
- 5.6.3.1 Germany
- 5.6.3.2 United Kingdom
- 5.6.3.3 France
- 5.6.3.4 Italy
- 5.6.3.5 Spain
- 5.6.3.6 Rest of Europe
- 5.6.4 Asia-Pacific
- 5.6.4.1 China
- 5.6.4.2 Japan
- 5.6.4.3 South Korea
- 5.6.4.4 India
- 5.6.4.5 Australia
- 5.6.4.6 New Zealand
- 5.6.4.7 Rest of Asia-Pacific
- 5.6.5 Middle East and Africa
- 5.6.5.1 United Arab Emirates
- 5.6.5.2 Saudi Arabia
- 5.6.5.3 South Africa
- 5.6.5.4 Rest of Middle East and Africa
- 5.6.1 North America
6 COMPETITIVE LANDSCAPE
- 6.1 Strategic Developments
- 6.2 Vendor Positioning Analysis
- 6.3 Company Profiles (includes Global level Overview, Market level overview, Core Segments, Financials as available, Strategic Information, Products and Services, and Recent Developments)
- 6.3.1 Amazon.com Inc. (Prime Video)
- 6.3.2 Netflix Inc.
- 6.3.3 The Walt Disney Company (Disney+ and Hulu)
- 6.3.4 Warner Bros. Discovery Inc. (Max)
- 6.3.5 Apple Inc. (Apple TV+)
- 6.3.6 Alphabet Inc. (YouTube Premium and YouTube TV)
- 6.3.7 Comcast Corporation (Peacock and Xfinity On-Demand)
- 6.3.8 Paramount Global (Paramount+)
- 6.3.9 Roku Inc.
- 6.3.10 Tencent Holdings Ltd. (Tencent Video)
- 6.3.11 Alibaba Group (Youku Tudou)
- 6.3.12 Baidu Inc. (iQIYI)
- 6.3.13 Zee Entertainment Enterprises Ltd. (ZEE5)
- 6.3.14 Reliance Industries Ltd. (JioCinema)
- 6.3.15 Novi Digital Entertainment Pvt. Ltd. (Disney+ Hotstar)
- 6.3.16 KT Corporation (Olleh TV)
- 6.3.17 Rakuten Group (Rakuten Viki)
- 6.3.18 Sky Group Limited (NOW)
- 6.3.19 Telstra Corporation (Telstra TV Box Office)
- 6.3.20 PCCW Media (Viu)
- 6.3.21 Globoplay (Grupo Globo)
- 6.3.22 Shahid (MBC Group)
- 6.3.23 Showmax (MultiChoice)
- 6.3.24 Canal+ Group (myCanal)
- 6.3.25 Vubiquity Inc.
7 MARKET OPPORTUNITIES AND FUTURE OUTLOOK
- 7.1 White-space and Unmet-Need Assessment
 视讯点播市场分析及预测(至2035年):按类型、产品类型、服务、技术、设备、部署类型、最终用户、组件和应用划分
 随选视讯市场规模、份额和成长分析(按收入模式、类型、内容类型、应用和地区划分)-2026-2033年产业预测
 视讯点播市场机会、成长要素、产业趋势分析及2026年至2035年预测
 视讯点播市场-2025-2030年预测
 全球 VOD 市场(按服务模式、内容类型和设备类型)预测(2025-2032 年)
 全球视讯点播市场交易全球基于广告的视讯点播市场全球视讯点播市场的发展
 视讯点播(VoD)的全球市场:各服务形式,各平台,各内容类型,收益模式,各用途,各用户类型,各地区,市场规模,产业动态,机会分析,预测(2025年~2033年)
 全球订阅随选视讯市场:市场规模、份额、趋势分析(按最终用途、收益模式、内容类型、设备类型和地区)、展望和未来预测(2025-2032 年)